
Green Finance Market Size and Share
Market Overview
| Study Period | 2020 - 2031 |
|---|---|
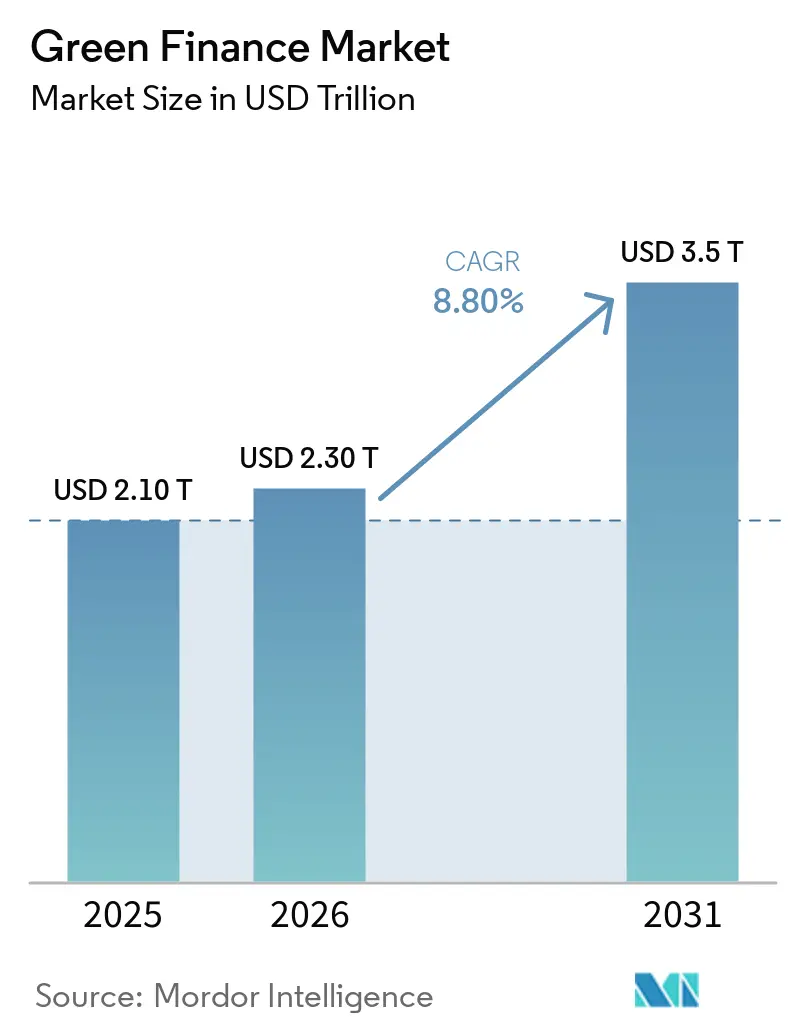
| Market Size (2026) | USD 2.30 Trillion |
| Market Size (2031) | USD 3.5 Trillion |
| Growth Rate (2026 - 2031) | 8.80 % |
| Fastest Growing Market | Middle East and Africa |
| Largest Market | Asia-Pacific |
| Market Concentration | Low |
Major Players *Disclaimer: Major Players sorted in no particular order Image © Mordor Intelligence. Reuse requires attribution under CC BY 4.0. | |
Green Finance Market Analysis by Mordor Intelligence
The green finance market is projected to grow from USD 2.1 trillion in 2025 to USD 3.5 trillion by 2031, at a CAGR of 8.8% during 2026-2031. The market is supported by a shift in capital allocation toward labeled instruments, with cumulative labeled sustainable bond volume reaching USD 7.52 trillion by June 2026. Annual mitigation finance requirements are estimated at USD 7.8 trillion for 2025-2030, creating substantial funding needs across energy, transport, buildings, and resilience projects. Regulation is increasing the importance of credible reporting and external review, while lenders and investors are expanding products that support low-carbon assets. This environment favors institutions that can combine structuring capabilities, reliable data, and access to large project pipelines. It also creates opportunities for blended finance, where commercial investors require public or concessional support to participate in earlier-stage projects.
Key Report Takeaways
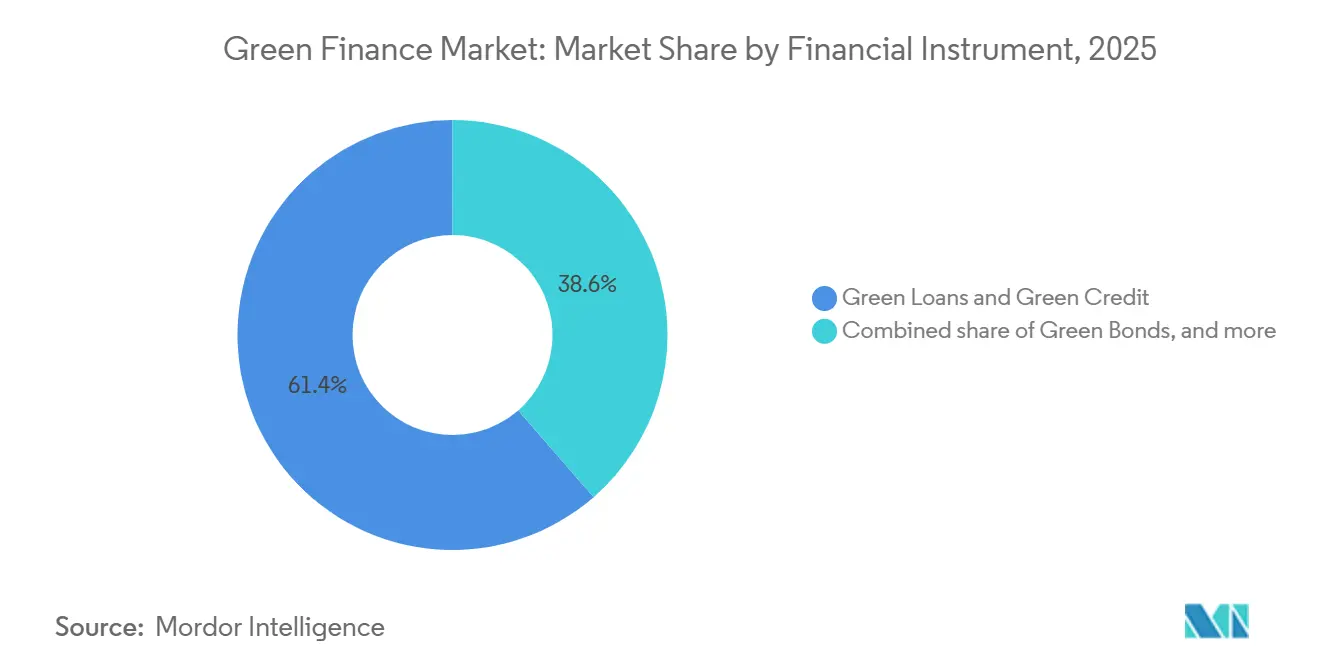
- By financial instrument, green loans and green credit accounted for 61.4% of the green finance market in 2025, while other green debt and financing instruments are projected to grow at a CAGR of 11.5% through 2031.
- By environmental theme, energy efficiency, storage, networks, and green buildings accounted for 29.8% of the green finance market in 2025, while climate change adaptation and resilience are projected to grow at a CAGR of 12.6% through 2031.
- By issuer or borrower, large non-financial corporates accounted for 39.3% of the green finance market in 2025, while households and individuals are projected to grow at a CAGR of 12.1% through 2031.
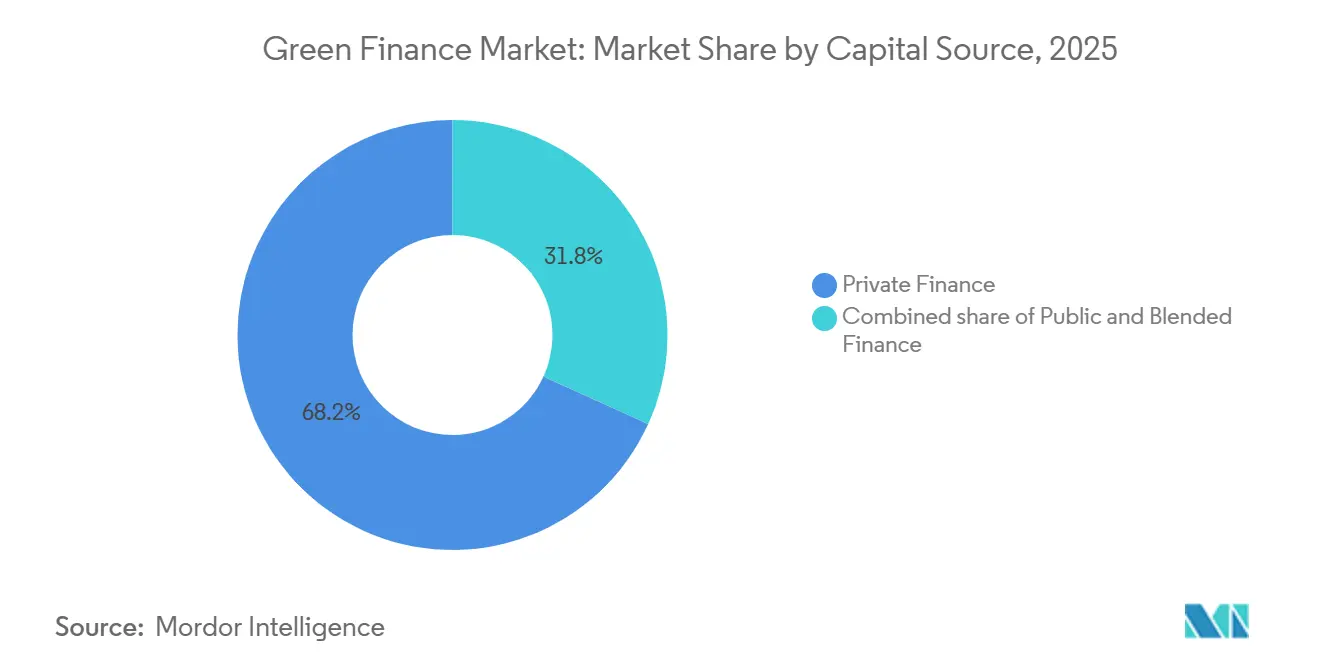
- By capital source, private finance accounted for 68.2% of the green finance market in 2025, while public-private and blended finance are projected to grow at a CAGR of 13.0% through 2031.
- By financing purpose, new financing accounted for 52.8% of the green finance market in 2025, while refinancing is projected to grow at a CAGR of 10.5% through 2031.
- By geography, Asia-Pacific accounted for 54.1% of the green finance market in 2025, while the Middle East and Africa are projected to grow at a CAGR of 11.0% through 2031.
Note: Market size and forecast figures in this report are generated using Mordor Intelligence’s proprietary estimation framework, updated with the latest available data and insights as of January 2026.
Global Green Finance Market Trends and Insights
Drivers Impact Analysis*
| Driver | (~) % Impact on CAGR Forecast | Geographic Relevance | Impact Timeline |
|---|---|---|---|
| Expansion of Green Taxonomies and Sustainable-Finance Regulations | +1.8% | Global, with early gains in Europe, China, and the Association of Southeast Asian Nations | Short term (≤ 2 years) |
| Institutional Demand for Green Investment Products | +1.5% | Global, concentrated in North America and Europe | Medium term (2-4 years) |
| Rising Financing Requirements for Low-Carbon Infrastructure | +2.0% | Global | Long term (≥ 4 years) |
| Growth and Standardization of Green Bond and Green Loan Markets | +1.4% | Global, strongest in Europe and Asia-Pacific | Medium term (2-4 years) |
| Integration of Climate Risk into Financial Institutions’ Capital Allocation | +1.0% | Global, with early gains in Europe and North America | Medium term (2-4 years) |
| Expansion of Green Finance Instruments in Emerging Markets | +1.2% | Asia-Pacific, the Middle East and Africa, and South America | Long term (≥ 4 years) |
| Source: Mordor Intelligence | |||
Expansion of Green Taxonomies and Sustainable-Finance Regulations
The European Union Green Bond Standard became an active infrastructure for the green finance market in 2026. The European Securities and Markets Authority external-reviewer register became operational on June 22, 2026, under Regulation (EU) 2023/2631. Commission Delegated Regulation (EU) 2026/73 also simplified technical screening criteria for taxonomy-aligned activities. Mandatory external review is raising verification requirements for issuers and increasing the value of providers with established review capacity. China’s Green Finance Support Project Catalogue, 2025 version, took effect in October 2025 and created a single identification standard across 9 domains with activity-level eligibility and greenhouse-gas reduction fields[1]. These parallel frameworks support cross-border product recognition, including Panda and Dim Sum bond issuance, although issuers still need to meet separate local requirements.
Institutional Demand for Green Investment Products
Institutional demand is extending the green finance market beyond traditional bond issuance. The Asset Management Association of China issued guidelines in June 2026 that require sustainable investment funds to invest at least 80% of assets in line with stated sustainability objectives[2]. This requirement gives sustainability objectives a more formal role in fund construction and portfolio monitoring. Global clean-energy capital expenditure reached USD 2.2 trillion in 2025, equal to 65% of total energy capital expenditure. Goldman Sachs Asset Management launched a dedicated biodiversity bond fund in February 2025, structured as a Sustainable Finance Disclosure Regulation Article 9 product aligned with United Nations Sustainable Development Goals 6, 12, 14, and 15. Such products broaden the investor base for thematic assets and support demand for new forms of environmental finance.
Rising Financing Requirements for Low-Carbon Infrastructure
Rising infrastructure needs are a long-term driver of the green finance market. Achieving Paris Agreement targets in emerging markets and developing economies requires climate investment of more than USD 2.4 trillion annually by 2030[3]. Of this amount, USD 250 billion is required for adaptation and resilience, where scalable commercial project structures remain limited. This funding gap supports the projected 12.6% CAGR for adaptation and resilience finance. Adaptation is a key application for concessional capital, as public de-risking often needs to precede commercial investment. This requirement places blended finance structures and verified project pipelines at the center of funding growth in underfinanced areas.
Growth and Standardization of Green Bond and Green Loan Markets
Green bonds and green loans are becoming more standardized across the green finance market. Green bonds and green loans are projected to represent 60% of total sustainable debt issuance in 2026, compared with 50% in 2024 and 40% in 2021[4]. The second quarter of 2026 recorded USD 210.8 billion in green bond issuance, while aligned green volume reached USD 364.1 billion in the first half. Standardization makes issuance more efficient for repeat borrowers who can apply established frameworks across large transaction programs. Smaller borrowers in emerging markets and developing economies still face verification costs that can reduce the pricing benefit of a green label. The same gap encourages banks, development institutions, and issuers to use common reporting practices that can lower transaction costs over time.
Restraints Impact Analysis*
| Restraint | (~) % Impact on CAGR Forecast | Geographic Relevance | Impact Timeline |
|---|---|---|---|
| Greenwashing Risk and Higher Verification Requirements | -0.8% | Global, concentrated in Europe | Short term (≤ 2 years) |
| Fragmentation of Green Taxonomies and Environmental, Social, and Governance Data Standards | -0.7% | Asia-Pacific, the Middle East and Africa, and South America | Medium term (2-4 years) |
| Limited Pipeline of Investment-Ready Green Projects | -0.6% | Middle East, Africa, and South America | Long term (≥ 4 years) |
| High Risk and Long Payback Periods of Green Infrastructure Projects | -0.5% | Global | Long term (≥ 4 years) |
| Source: Mordor Intelligence | |||
Greenwashing Risk and Higher Verification Requirements
Greenwashing risk restrains the green finance market because issuers must demonstrate that their use of proceeds, reporting practices, and sustainability claims align with the applicable framework. External review requirements increase compliance costs for issuers without established reporting systems. They also increase the importance of reliable use-of-proceeds reporting and impact measurement. Regulatory responsibilities may be divided between oversight of external reviewers and issuer-level enforcement by national authorities. Differences in national enforcement can create uneven outcomes across jurisdictions and add complexity for cross-border issuers.
Fragmentation of Green Taxonomies and Environmental, Social, and Governance Data Standards
Fragmented taxonomy and disclosure standards create challenges for the green finance market, particularly in cross-border transactions. Issuers must navigate differing eligibility criteria and reporting requirements across Europe, China, the Association of Southeast Asian Nations, and India. Frameworks designed for mature markets may not align with the technology, regulatory capacity, and financing conditions in emerging economies. Multilateral development banks can often manage associated structuring costs more effectively than private borrowers. Limited pipelines of investment-ready projects and long payback periods further constrain financing in lower-capacity markets. As a result, large and sophisticated issuers can access green funding more easily than smaller borrowers in emerging markets and developing economies.
*Our forecasts treat driver/restraint impacts as directional, not additive. The impact forecasts reflect baseline growth, mix effects, and variable interactions.
Segment Analysis
By Financial Instrument: Bank Credit Anchors Volume as Capital-Market Alternatives Accelerate
Green loans and green credit held 61.4% of the green finance market in 2025, making bank credit the largest financial instrument category. China’s green loan balance reached RMB 43.51 trillion (USD 6.2 trillion) by the third quarter of 2025, increasing 17.5% year over year. This lending base gives bank channels a substantially larger volume platform than the bond market. European and North American banks also use green credit to fund energy, buildings, transport, and corporate transition programs. Green bonds remained the leading capital market instrument in the second quarter of 2026, accounting for 69% of labeled sustainable bond issuance during the quarter.
Other green debt and financing instruments are forecast to grow at a CAGR of 11.5% through 2031, representing the fastest growth among financial instruments. This category includes sustainability-linked bonds, transition bonds, and green securitizations. Sustainability-linked debt is expected to stabilize above 10% of total issuance as frameworks for hard-to-abate sectors mature. Transition bond growth is expanding beyond its earlier concentration in Asia. These instruments provide additional options for borrowers whose assets or transition plans do not align with conventional green bond use-of-proceeds structures. Their expansion also highlights the importance of clear standards, as investor confidence depends on credible targets and transparent reporting.
By Environmental Theme: Built-Environment Capital Dominates, Resilience Finance Gains Momentum
Energy efficiency, storage, networks, and green buildings accounted for 29.8% of the green finance market size by environmental theme in 2025. Building decarbonization mandates, deep retrofits, and grid modernization programs support this position. These uses have identifiable assets and clear funding needs across advanced and developing economies. Renewable energy and low-carbon power are the second-largest environmental themes. Transport and buildings still require 3 to 4 times the current annual finance flows to close the mitigation gap. This finance gap maintains demand for lending and bond programs linked to physical infrastructure.
Climate-change adaptation and resilience are forecast to grow at a 12.6% CAGR through 2031, the fastest rate among environmental themes. Its pace reflects the difference between high adaptation needs and a limited supply of investable projects. The green finance industry is also expanding into biodiversity, carbon capture, the circular economy, sustainable agriculture, water, pollution prevention, and clean transportation. Goldman Sachs Asset Management introduced a biodiversity bond fund in February 2025 to support a dedicated environmental thematic product. The Food and Agriculture Organization published guidance in May 2026 on mobilizing private capital for agrifood systems through green bonds. The fund launch and guidance support broader thematic coverage while maintaining the need for credible project selection and reporting.
By Issuer/Borrower: Household Borrowers Emerge as the Fastest-Growing Segment
Large non-financial corporates accounted for 39.3% of the green finance market size by issuer and borrower in 2025. Corporate demand is supported by disclosure rules and targets for Scope 1 and Scope 2 emissions reductions. These requirements encourage large green bond and green loan programs. Sovereigns are also increasing participation, representing 45% of total sovereign debt issuance in the first quarter of 2026. Their activity can support domestic taxonomies, benchmark curves, and market visibility. Small and medium-sized enterprise aggregation remains underdeveloped, which leaves a need for structures that combine smaller transactions.
Households and individuals are forecast to grow at 12.1% CAGR through 2031, the fastest rate among borrower groups. Retail green mortgages and consumer energy-efficiency loans are expanding in Europe, North America, and Australia. Santander United Kingdom and Octopus Energy launched a mortgage for Zero Bills homes in July 2026. Eligible homebuyers can borrow up to GBP 30,000 (USD 38,700), more than under a comparable standard product. The structure removes monthly energy bills from affordability assessments for eligible properties. This type of product shows how household financing can connect energy performance with mortgage underwriting.
By Capital Source: Private Finance Leads, Blended Structures Reshape Risk Architecture
Private finance accounted for 68.2% of the green finance market in 2025. The growing use of green investment products in institutional portfolios supports their leading role. Commercial capital plays a central role in financing renewable energy, low-carbon power, buildings, and other mature asset classes. Institutional investment is increasingly aligned with real-economy transition requirements. Clean-energy capital expenditure reached USD 2.2 trillion in 2025. Private investors remain most active in projects with predictable revenue streams, sufficient scale, and established reporting practices.
Public-private and blended finance are projected to expand at a CAGR of 13.0% through 2031, making it the fastest-growing capital source. These structures are particularly important for early-stage and adaptation projects that require concessional funding before attracting commercial capital. The United Nations Development Programme identifies blended finance as an important mechanism for adaptation projects, where project risks and limited track records can constrain private investment. Public-sector participation can absorb specific risks, provide guarantees, or support project preparation. These measures can improve project bankability in emerging markets and developing economies. Blended finance complements private finance by enabling investment in projects that may otherwise remain unfunded.
By Financing Purpose: Refinancing Acceleration Driven by the Green, Social, and Sustainability Maturity Wall
New financing accounted for 52.8% of green finance activity by financing purpose in 2025. Renewable energy, electric vehicle infrastructure, and sustainable buildings supported new project pipelines. New financing remains essential because the transition requires additional physical assets and infrastructure upgrades. It provides capital for construction, equipment, and other project-stage requirements. China’s Green Bond Endorsed Project Catalogue also helps identify eligible activities. Clear eligibility criteria can help lenders and borrowers direct new capital toward recognized green uses.
Refinancing is forecast to grow at a CAGR of 10.5% through 2031, the fastest rate among financing purposes. This growth is linked to the maturity of the green, social, and sustainability bond market. Crédit Agricole Corporate and Investment Bank projects a 37% increase in sustainable bond refinancing volume in 2026, as EUR 425 billion (USD 463.3 billion) of green, social, and sustainability bonds issued between 2019 and 2022 reach maturity. Refinancing decisions will determine whether maturing debt retains a labeled structure and influence the volume of outstanding sustainable debt. The renewal cycle allows issuers to update reporting, revise frameworks, and align with newer standards.
Geography Analysis
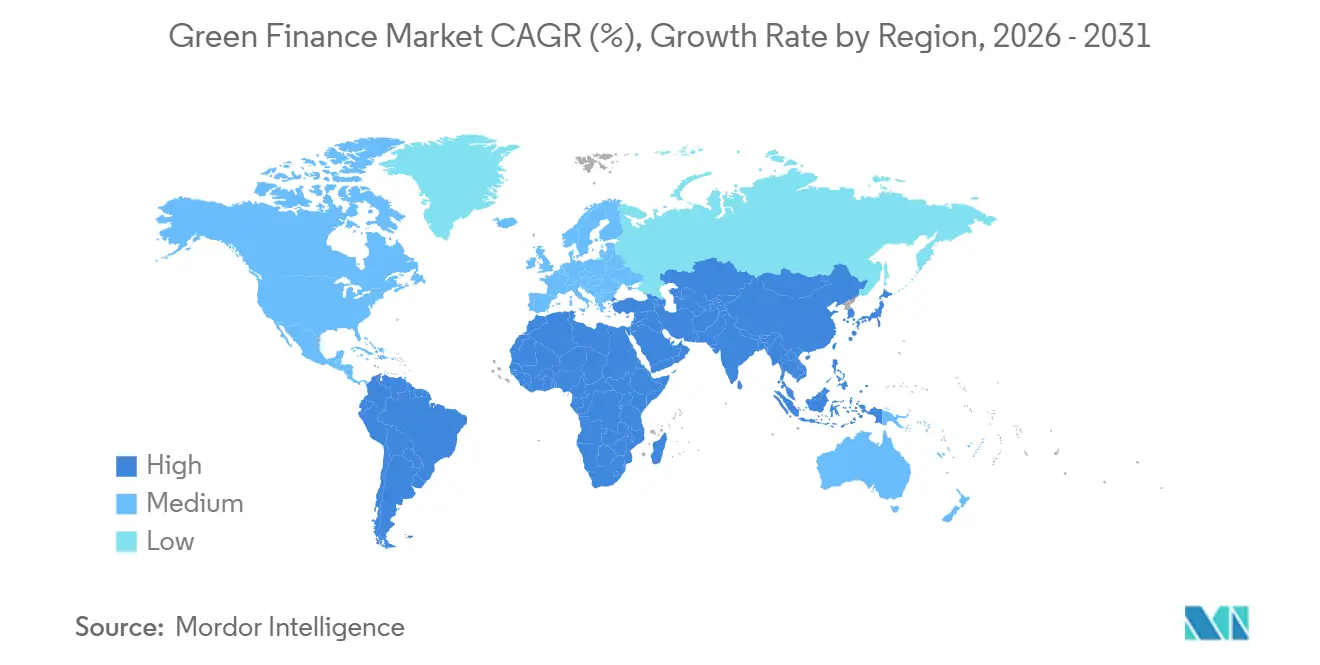
Asia-Pacific accounted for 54.1% of the green finance market in 2025, making it the leading regional market. China was the main contributor, supported by its large green lending system and expanding sustainable debt activity. China issued USD 111.1 billion in green, social, sustainability, and sustainability-linked bonds in 2025, representing a 56.5% increase from 2024. By the end of the first half of 2026, China had accumulated USD 729 billion in aligned green, social, and sustainability-linked bond issuances. Hong Kong accounted for 40% of regional green and sustainable bond arranging volume, while its sustainable debt instruments exceeded USD 76 billion in 2025.
The Middle East and Africa are forecast to grow at a CAGR of 11.0% through 2031, the fastest rate among regions. Europe remains a regulatory hub, as the European Union Green Bond Standard has established a formal framework for issuers and external reviewers. Global sustainable bond issuance is projected to reach EUR 870 billion (USD 948.3 billion) in 2026, supported by the refinancing of EUR 425 billion (USD 463.3 billion) in maturing green, social, and sustainability bonds. The United States remains a major origination market, with Goldman Sachs, JPMorgan Chase, and Bank of America underwriting significant green bond issuances. Freddie Mac’s GreenCHOICE Mortgages program also supports household-level financing through agency channels.
Egypt issued JPY 80 billion (USD 500 million) in sustainability samurai bonds with a partial credit guarantee from the African Development Bank in 2026. The country also issued its inaugural USD 1 billion sovereign social bond in May 2026, which received a final order book of USD 3.9 billion. The International Fund for Agricultural Development and Equity Group launched a USD 200 million adaptation finance mechanism in September 2026. The facility is designed to provide financing to micro, small, and medium-sized enterprises and smallholder farmers in East Africa. Nasdaq Dubai also supports cross-border issuance by connecting Gulf Cooperation Council issuers with international investors.
Competitive Landscape
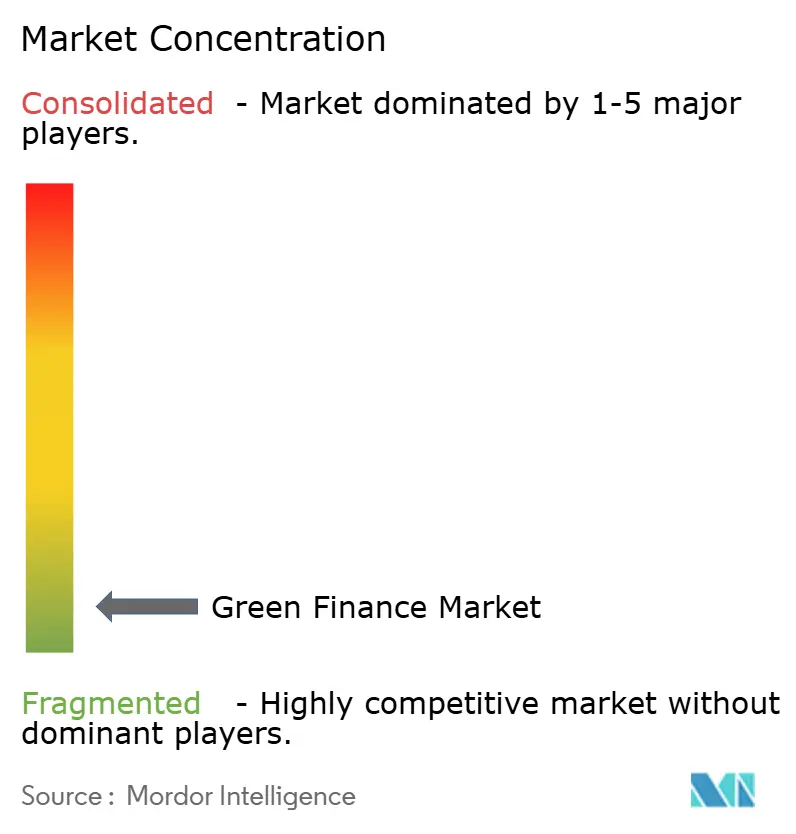
The green finance market remains fragmented across arranging and underwriting activities, although a small group of global banks leads sustainable bond origination and green loan structuring. BNP Paribas maintained its leading position in sustainable bonds and loans for the third consecutive year through 2025, with sustainable finance volumes reaching USD 69 billion, including USD 26.2 billion in green bonds. Technology is also playing an increasingly important role through digital issuance platforms, ESG analytics, and carbon-accounting systems, enabling banks to strengthen in-house sustainability capabilities and potentially reduce their reliance on external second-party opinion providers.
Multilateral development institutions, including the European Investment Bank, International Finance Corporation, and World Bank Group, act as market makers, standard setters, and anchor investors. Their role is especially significant in first-of-a-kind and emerging-market transactions that commercial banks can later replicate. White-space opportunities include small and medium-sized enterprise aggregation, local-currency instruments in emerging markets and developing economies, and biodiversity and nature-positive financing. BlackRock and Amundi are expanding green assets under management through standardized fund structures and retail distribution. Specialist climate finance platforms and digital carbon accounting providers may reduce verification costs for issuers and increase pressure on incumbent institutions to build these functions internally.
In September 2026, Industrial and Commercial Bank of China listed dual-currency USD 713 million China-Arab States Renewable Energy Cooperation-themed green bonds on Nasdaq Dubai. In January 2026, Emirates NBD completed an inaugural dual-tranche USD 1 billion Blue-Green Bond under its updated Sustainable Finance Framework. In July 2026, the International Finance Corporation invested up to USD 100 million as an anchor investor in Jordan Kuwait Bank’s second green bond. These actions show competition across issuance, distribution, and the development of green asset pipelines. Market concentration is higher in global arranging than in the broader set of issuers, projects, and investment products.
Green Finance Industry Leaders
-
BNP Paribas
-
HSBC Holdings plc
-
JPMorgan Chase & Co.
-
BlackRock, Inc.
-
Crédit Agricole S.A.
- *Disclaimer: Major Players sorted in no particular order
Recent Industry Developments
- September 2026: ICBC listed dual-currency USD 713 million "China-Arab States Renewable Energy Cooperation"-themed green bonds on Nasdaq Dubai. The USD tranche was 3.8 times oversubscribed, bringing ICBC's total outstanding bonds on Nasdaq Dubai to USD 4.24 billion and institutionalizing cross-border China-Gulf Cooperation Council green capital flows through the United Arab Emirates market infrastructure.
- September 2026: The World Bank, International Bank for Reconstruction and Development, issued a EUR 3 billion (USD 3.27 billion), 10-year Sustainable Development Bond with lead managers Goldman Sachs, Crédit Agricole, Citigroup, and JPMorgan. It was listed on the Luxembourg Stock Exchange at a 3.45% annual coupon.
- August 2026: Climate Bonds Initiative published its Green, Social, Sustainability, and Sustainability-Linked Panda and Dim Sum Bond Market Report. The report confirmed that China’s aligned market reached CNY 4.6 trillion (USD 682.2 billion) in cumulative volume by the end of 2025.
- July 2026: Santander United Kingdom and Octopus Energy launched the United Kingdom’s first high-street bank mortgage for Zero Bills homes. Eligible buyers can borrow up to GBP 30,000 (USD 38,700) more than on a standard product.
Global Green Finance Market Report Scope
| Green Bonds |
| Green Loans and Green Credit |
| Other Green Debt and Financing Instruments |
| Renewable Energy and Low-Carbon Power |
| Energy Efficiency, Storage, Networks, and Green Buildings |
| Clean Transportation |
| Sustainable Water, Wastewater and Flood Management |
| Pollution Prevention and Control |
| Circular Economy, Resource Efficiency, and Eco-Efficient Products / Processes |
| Sustainable Agriculture, Forestry, Fisheries and Land Use |
| Terrestrial and Aquatic Biodiversity and Ecosystem Conservation |
| Climate-change Adaptation and Resilience |
| Carbon Capture, Utilisation, Removal and Storage |
| Sovereigns, Sub-Sovereigns and Public Agencies |
| Development Banks and Other Official Financial Institutions |
| Commercial Financial Institutions |
| Large Non-Financial Corporates |
| SMEs |
| Households and Individuals |
| Public Finance |
| Private Finance |
| Public-Private / Blended Finance |
| New Financing |
| Refinancing |
| North America | United States |
| Canada | |
| Mexico | |
| South America | Brazil |
| Argentina | |
| Rest of South America | |
| Europe | United Kingdom |
| Germany | |
| France | |
| Italy | |
| Spain | |
| Rest of Europe | |
| Asia-Pacific | China |
| Japan | |
| India | |
| South Korea | |
| Australia | |
| Indonesia | |
| Thailand | |
| Malaysia | |
| Singapore | |
| Vietnam | |
| Rest of Asia-Pacific | |
| Middle East and Africa | Saudi Arabia |
| United Arab Emirates | |
| Turkey | |
| South Africa | |
| Egypt | |
| Rest of Middle East and Africa |
| By Financial Instrument | Green Bonds | |
| Green Loans and Green Credit | ||
| Other Green Debt and Financing Instruments | ||
| By Environmental Theme | Renewable Energy and Low-Carbon Power | |
| Energy Efficiency, Storage, Networks, and Green Buildings | ||
| Clean Transportation | ||
| Sustainable Water, Wastewater and Flood Management | ||
| Pollution Prevention and Control | ||
| Circular Economy, Resource Efficiency, and Eco-Efficient Products / Processes | ||
| Sustainable Agriculture, Forestry, Fisheries and Land Use | ||
| Terrestrial and Aquatic Biodiversity and Ecosystem Conservation | ||
| Climate-change Adaptation and Resilience | ||
| Carbon Capture, Utilisation, Removal and Storage | ||
| By Issuer / Borrower | Sovereigns, Sub-Sovereigns and Public Agencies | |
| Development Banks and Other Official Financial Institutions | ||
| Commercial Financial Institutions | ||
| Large Non-Financial Corporates | ||
| SMEs | ||
| Households and Individuals | ||
| By Capital Source | Public Finance | |
| Private Finance | ||
| Public-Private / Blended Finance | ||
| By Financing Purpose | New Financing | |
| Refinancing | ||
| By Geography | North America | United States |
| Canada | ||
| Mexico | ||
| South America | Brazil | |
| Argentina | ||
| Rest of South America | ||
| Europe | United Kingdom | |
| Germany | ||
| France | ||
| Italy | ||
| Spain | ||
| Rest of Europe | ||
| Asia-Pacific | China | |
| Japan | ||
| India | ||
| South Korea | ||
| Australia | ||
| Indonesia | ||
| Thailand | ||
| Malaysia | ||
| Singapore | ||
| Vietnam | ||
| Rest of Asia-Pacific | ||
| Middle East and Africa | Saudi Arabia | |
| United Arab Emirates | ||
| Turkey | ||
| South Africa | ||
| Egypt | ||
| Rest of Middle East and Africa | ||
Key Questions Answered in the Report
What is driving growth in green finance?
The expansion is supported by regulatory standards, institutional investment demand, and funding needs for low-carbon infrastructure and adaptation. The market is forecast to grow at an 8.8% CAGR from 2026 to 2031.
Which financial instrument leads green finance?
Green Loans and Green Credit led with 61.4% share in 2025, supported by large bank lending programs, particularly in China.
Which green finance theme is growing fastest?
Climate-Change Adaptation and Resilience is forecast to grow at 12.6% CAGR through 2031 because adaptation needs are large and the project pipeline remains underdeveloped.
Why is Asia-Pacific important for green finance?
Asia-Pacific held 54.1% share in 2025. China’s lending system and sustainable bond activity are major contributors to the region’s position.
How does blended finance support climate projects?
Blended structures can use public or concessional funding to reduce risk and attract commercial capital to early-stage and adaptation projects.
What are the main risks for issuers?
Greenwashing scrutiny, verification requirements, different taxonomies, and inconsistent environmental, social, and governance data standards can raise transaction costs.