Tunisia Agriculture Market Analysis by Mordor Intelligence
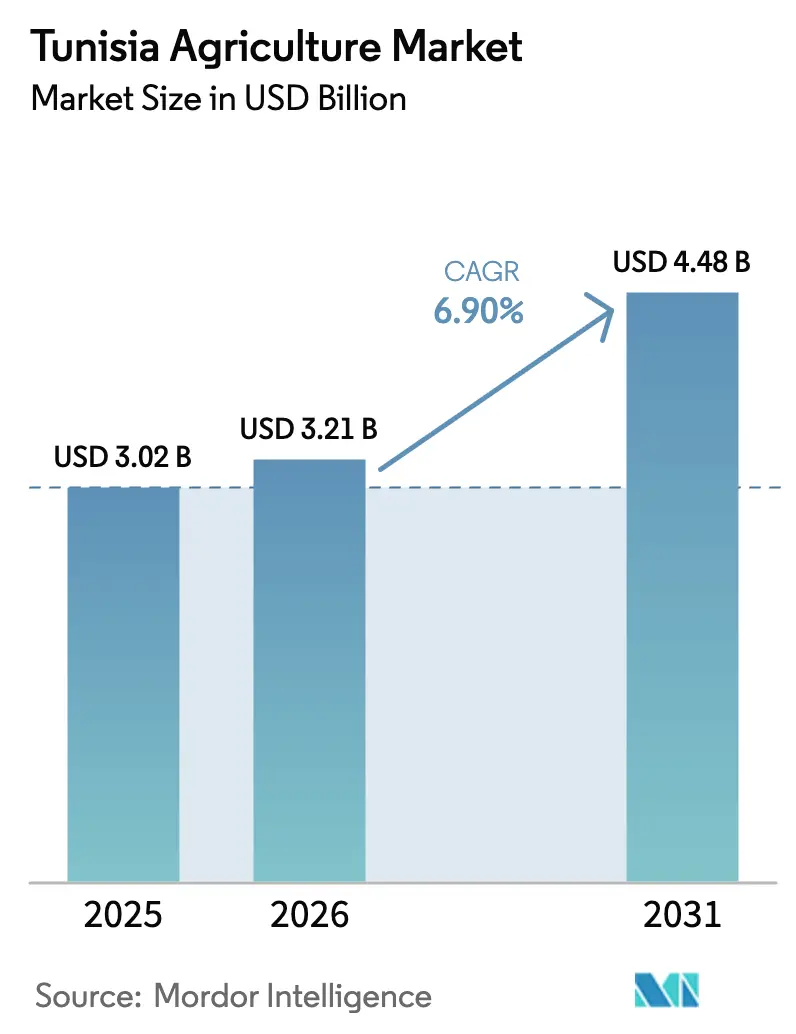
The Tunisia Agriculture Market size is anticipated to increase from USD 3.02 billion in 2025 to USD 3.21 billion in 2026 and reach USD 4.48 billion by 2031, growing at a CAGR of 6.90% over 2026-2031. The Tunisia agriculture market is expanding as greenhouse horticulture and premium olive oil exports offset structural water deficits. Public-sector capital, including the World Bank’s USD 520 million package, is being utilized to rehabilitate irrigation and post-harvest infrastructure[1]Source: United States Department of Agriculture, “Tunisia Grain and Feed Annual Report,” ipad.fas.usda.gov. Meanwhile, a EUR 59 million (USD 62 million) green-finance facility reduces borrowing costs for drip irrigation. Record olive oil output in the 2024-2025 marketing year, along with the introduction of new salt-tolerant cereal cultivars and the near-shoring advantages created by the European Union's Green Deal, are lifting profitability across export corridors. At the same time, fragmented landholdings and chronic water scarcity hinder cereal yields, thereby maintaining high import demand.
Key Report Takeaways
- By commodity type, cereals and grains accounted for the largest share, comprising 45% of the Tunisian agricultural market size in 2025. Fruits and vegetables emerge as the fastest-growing segment, expanding at a 6.80% CAGR through 2031.
Note: Market size and forecast figures in this report are generated using Mordor Intelligence’s proprietary estimation framework, updated with the latest available data and insights as of January 2026.
Tunisia Agriculture Market Trends and Insights
Drivers Impact Analysis*
| Driver | (~) % Impact on CAGR Forecast | Geographic Relevance | Impact Timeline |
|---|---|---|---|
| Government support and subsidy programs | +0.8% | National priority zones Kairouan, Kasserine, Sidi Bouzid | Medium term (2-4 years) |
| Growing domestic demand for cereals | +0.6% | Coastal cities Tunis, Sfax, Sousse | Long term (≥ 4 years) |
| Rising import demand for Tunisian olive oil | +1.0% | Sfax, Mahdia, Monastir | Short term (≤ 2 years) |
| Expansion of greenhouse horticulture footprint | +0.7% | Sahel, Sfax, Kebili, Tozeur | Medium term (2-4 years) |
| Near-shoring effect of the European Union Green Deal | +0.5% | Cap Bon, Sahel tomato and citrus corridors | Medium term (2-4 years) |
| Adoption of salt-tolerant cereal cultivars and solar-powered desalination | +0.4% | Kairouan, Mahdia, Sfax | Long term (≥ 4 years) |
| Source: Mordor Intelligence | |||
Government Support and Subsidy Programs
The World Bank's USD 300 million financing, approved in March 2024, modernizes 15,000 hectares of irrigation in the Medjerda Valley and funds 50 cold-chain aggregation centers, reducing spoilage losses in tomatoes and peppers from 25% to below 10%. Cabinet approval in June 2025 for fertilizer imports places subsidized urea and diammonium phosphate at prices 40% below global benchmarks, stabilizing cereal input costs. The EUR 59 million (USD 62 million) Green Economy Financing Facility halves the interest rates for micro and small-scale growers shifting to drip irrigation, reducing payback periods to under four years [2]Source: European Bank for Reconstruction and Development, “EBRD, EU, and TCX Launch EUR 59 Million Green Economy Financing Facility in Tunisia,” ebrd.com. These overlapping interventions compress production risk and raise net margins, especially for smallholders. Improved rural credit access further accelerates the uptake of technology and land consolidation.
Growing Domestic Demand for Cereals
Urban population growth of 1.1% per year in Tunis and Sfax underpins rising bread consumption, which keeps annual soft-wheat demand near 2.1 million metric tons, while domestic output reached only 1.25 million metric tons in the marketing year 2024-2025. Office des Céréales therefore imported 1.8 million metric tons of soft wheat and 400,000 metric tons of durum, spending USD 600 million in the marketing year 2024-2025. Subsidized bread prices at USD 0.06 per baguette (TND 0.19) sustain affordability but strain public finances. Genetic gains from new heat-tolerant durum varieties are indicated to increase yields to 2.2 metric tons per hectare by 2028, narrowing the gap between output and consumption.
Rising Import Demand for Tunisian Olive Oil
A record 340,000 metric tons olive oil crop in 2024-2025 lifted Tunisia to the world’s second-largest exporter. Firms diversified buyers in October 2025, shipping organic and Protected Designation of Origin certified oils to Asia and South America at 20% to 30% premiums over commodity grades. Gulf Capital took an equity position in CHO Company in May 2025, financing the bottling lines that capture value-added products in Tunisia. Investments in traceability made to comply with European pesticide thresholds of below 0.01 parts per million now underpin marketing claims in new regions. Higher export earnings feed back into grove renewal and mechanized harvesting.
Adoption of Salt-Tolerant Cereal Cultivars and Solar-Powered Desalination
Soil salinity touches 1.5 million hectares nationwide. The “Salim” durum wheat line tolerates eight deciSiemens per meter and yields 1.8 metric tons per hectare on degraded soils, which is double the yield of traditional varieties. Distribution reached 12,000 hectares in 2025 and aims at 50,000 hectares by 2028. Solar-powered reverse-osmosis units in Gabes and Mahdia treat groundwater to below one deciSiemens per meter, costing USD 8,000 per hectare to install yet eliminating USD 1,200 per hectare in diesel pumping each year. Lower operating costs and rising vegetable prices shorten payback to seven years.
Restraints Impact Analysis*
| Restraint | (~) % Impact on CAGR Forecast | Geographic Relevance | Impact Timeline |
|---|---|---|---|
| Chronic water scarcity and inefficient irrigation networks | −1.2% | Kairouan, Kasserine, Sidi Bouzid, southern governorates | Long term (≥ 4 years) |
| Soil salinity and land degradation in coastal regions | −0.6% | Sahel, Sfax, Mahdia, Gabes | Long term (≥ 4 years) |
| Fragmented landholding limiting mechanization | −0.5% | Nationwide average farm 5 hectares | Medium term (2-4 years) |
| Stricter phytosanitary rules and pest incursions | −0.3% | Cap Bon, Sahel, Sfax export zones | Short term (≤ 2 years) |
| Source: Mordor Intelligence | |||
Chronic Water Scarcity and Inefficient Irrigation Networks
Renewable water supply averages 450 cubic meters per capita, far below the 1,000 cubic meter scarcity threshold[3]Source: Food and Agriculture Organization, “FAO Aquastat: Tunisia Water Resources,” fao.org/aquastat. Open canals lose up to 50% of flow. A USD 220 million corridor project replaces them with pressurized pipelines on 25,000 hectares, yet the full benefits will not arrive until 2028. Aquifer levels in the Sahel decline by 0.5 meters per year, and desalinated water at USD 1.50 per cubic meter remains uneconomical for broadacre crops, reinforcing reliance on rainfall patterns.
Fragmented Landholding Limiting Mechanization
The average plot size of five hectares sits below economic thresholds for combine harvesters. Custom hire costs USD 80 per hectare, eroding margins for cereal growers. Attempts to replicate dairy-sector cooperatives that aggregated 200 producers have stalled in field crops due to legal uncertainties around shared assets. Land consolidation proposals face political resistance, slowing the adoption of precision planting and harvest technologies that could lift productivity.
*Our forecasts treat driver/restraint impacts as directional, not additive. The impact forecasts reflect baseline growth, mix effects, and variable interactions.
Segment Analysis
By Commodity Type: Cereals and Grains Face a Structural Water Ceiling
Cereals and grains accounted for 45% of Tunisia's agricultural market in 2025. The segment's CAGR lags behind the broader Tunisia agriculture market growth, as average wheat yields remain at 1.5 metric tons per hectare. New irrigation rehabilitation in the Medjerda Valley and the saline-tolerant “Salim” line aim to elevate productivity. However, imports will cover a 900,000-metric-ton soft-wheat gap through 2031. Domestic barley output of 600,000 metric tons meets only half of the feed demand. The adoption of conservation agriculture practices, including minimum tillage and stubble retention, improves soil moisture but requires machinery that is often beyond the reach of most smallholders.
The fruit and vegetable sector in Tunisia is projected to be the fastest-growing segment between 2026 and 2031, with a CAGR of 6.8%, despite cereals and grains holding the largest market share in 2025. This growth is attributed to factors such as Tunisia's strategic advantage as a leading organic exporter recognized by the EU and Switzerland, the adoption of modern technologies like greenhouse horticulture, shifting consumer preferences towards fresh produce, and targeted government support for high-value agro-food products.


Geography Analysis
The Medjerda Valley in the northwest anchors Tunisia’s grain and forage production, supported by relatively reliable surface water and a dense network of feeder canals. Ongoing rehabilitation of these canals improves delivery efficiency and limits seasonal rationing, giving growers a productivity edge over rain-fed zones. Access to paved roads and nearby milling hubs further shortens the time from harvest to processor, lowering spoilage and transportation costs. As irrigation upgrades continue, the valley is anticipated to preserve its role as the country’s principal food-grain corridor.
The Sahel coastal strip, stretching from Sousse to Mahdia, is a major hub for olive oil processing and horticulture exports. Proximity to deep-water ports and a cluster of modern mills enables producers to respond quickly to shifts in overseas demand and phytosanitary audits. Private equity funding supports integrated supply chains that capture higher margins through bottling and branding, enabling companies to achieve greater profitability. Despite concerns over climatic volatility, growers are increasingly adopting drip irrigation and certified organic practices to mitigate risks.
Southern governorates such as Kebili, Tozeur, and Gabes leverage geothermal resources and high solar irradiance to power greenhouses and date-palm packhouses. Solar photovoltaics and low-carbon heating align with European importers’ sustainability criteria, strengthening market access for off-season tomatoes and premium Deglet Nour dates. Despite chronically low groundwater reserves, investment in precision irrigation keeps expansion on track. Interior regions, such as Kairouan and Sidi Bouzid, lag in technology uptake, but targeted credit lines are beginning to narrow the gap.
Competitive Landscape
Tunisia’s fresh-produce chain starts with more than 200,000 smallholder growers who grow tomatoes, peppers, citrus, melons, and dates on plots of 3 to 5 hectares. Consolidation appears farther downstream, where vertically integrated firms control branding, certification, and cold storage. Groupe Sotovit and Atlas Fruits operate packing houses equipped with optical sorters, which reduce rejection rates in European markets from 12% to below 5%. Their GlobalGAP and organic seals translate into price premiums of 15% to 20% in European Union retail aisles. Société Nouvelle Agricole utilizes contract farming in Cap Bon and Nabeul to supply seedlings, provide advice, and offer guaranteed pickup to 300 growers, thereby creating full traceability for phytosanitary checks.
Value addition centers on life-extension rather than processing. Greenhouse clusters in Kebili and Tozeur tap geothermal heat to ship winter tomatoes at USD 2.63 per kilogram (EUR 2.50 per kilogram), roughly double summer prices. Modified-atmosphere films now stretch shelf life to 14 days, making sea freight to northern Europe practical. Société Ellouhou Dates hand-sorts Deglet Nour and Allig varieties and secures 20% to 30% premiums in North American and Gulf stores. Solar photovoltaic projects guaranteed by the Multilateral Investment Guarantee Agency reduce electricity costs for regional cold rooms by 40%, allowing warehouses to operate profitably at smaller scales.
Competition hinges on fast port access and compliance with carbon audits mandated by the European Union Green Deal. Two-day sailings from Tunis to Marseille emit 0.15 kilograms of carbon dioxide per kilogram of produce, versus 0.45 kilograms for Turkish routes, giving Tunisian shippers a measurable edge. Only 8% of vegetable growers hold third-party organic certificates, leaving ample room for certification-driven differentiation. Leading exporters already utilize blockchain traceability and Internet of Things temperature sensors in refrigerated containers, while many small aggregators rely on paper logs, creating a fragmented supply chain that rewards verified operators and leaves uncertified producers vulnerable to volatile spot demand.
Recent Industry Developments
- June 2025: A cabinet meeting chaired by Prime Minister Sara Zaafrani Zenzri approved accelerated fertilizer stock-building, streamlined credit procedures and dedicated energy-supply guarantees for storage facilities ahead of the 2025-2026 cropping year.
- May 2024: The Multilateral Investment Guarantee Agency backed two 50-megawatt solar photovoltaic plants in Tunisia's Sidi Bouzid and Tozeur locations, reducing electricity costs by 40% for new produce warehouses and lowering the break-even volume for cold storage from 5,000 metric tons to 3,000 metric tons.


Research Methodology Framework and Report Scope
Market Definitions and Key Coverage
Our study defines the Tunisian agriculture market as the annual gross value of all crops and livestock produced within the country, measured at first-sale prices and expressed in constant 2024 U.S. dollars. It embraces production, short-haul handling, and on-farm primary processing while tracking trade flows that shape local price discovery.
Scope exclusion: fisheries, aquaculture, and downstream food manufacturing are analyzed separately and therefore not included here.
Segmentation Overview
- By Commodity Type
- Grains and Cereals
- Production Analysis (Volume)
- Overview
- Area Harvested and Yield
- Consumption Analysis (Value and Volume)
- Trade Analysis (Value and Volume)
- Import Market Analysis
- Overview
- Key Supplying Markets
- Export Market Analysis
- Overview
- Key Destinations Markets
- Import Market Analysis
- Wholesale Price Trend Analysis and Forecast
- Seasonality Analysis
- Production Analysis (Volume)
- Pulses and Oilseed
- Production Analysis (Volume)
- Overview
- Area Harvested and Yield
- Consumption Analysis (Value and Volume)
- Trade Analysis (Value and Volume)
- Import Market Analysis
- Overview
- Key Supplying Markets
- Export Market Analysis
- Overview
- Key Destinations Markets
- Import Market Analysis
- Wholesale Price Trend Analysis and Forecast
- Seasonality Analysis
- Production Analysis (Volume)
- Fruits and Vegetables
- Production Analysis (Volume)
- Overview
- Area Harvested and Yield
- Consumption Analysis (Value and Volume)
- Trade Analysis (Value and Volume)
- Import Market Analysis
- Overview
- Key Supplying Markets
- Export Market Analysis
- Overview
- Key Destinations Markets
- Import Market Analysis
- Wholesale Price Trend Analysis and Forecast
- Seasonality Analysis
- Production Analysis (Volume)
- Cash Crop
- Production Analysis (Volume)
- Overview
- Area Harvested and Yield
- Consumption Analysis (Value and Volume)
- Trade Analysis (Value and Volume)
- Import Market Analysis
- Overview
- Key Supplying Markets
- Export Market Analysis
- Overview
- Key Destinations Markets
- Import Market Analysis
- Wholesale Price Trend Analysis and Forecast
- Seasonality Analysis
- Production Analysis (Volume)
- Grains and Cereals
Detailed Research Methodology and Data Validation
Primary Research
We held structured interviews and short mobile surveys with growers' cooperatives, grain millers, input dealers, and export-oriented pack-houses across northern irrigated belts and central dryland clusters to test secondary findings, refine price spreads, and validate planting-area intentions.
Desk Research
Mordor analysts first map the market landscape through public datasets such as Tunisia's National Institute of Statistics, FAOSTAT, World Bank commodity balances, and USDA GAIN shipment reports. Trade association bulletins from ONAGRI, regional climate and water-table readings, and peer-reviewed agronomy journals furnish seasonality and yield coefficients. Paid platforms including D&B Hoovers for agribusiness financials and Dow Jones Factiva for policy news help us cross-reference firm-level output shifts. The sources listed illustrate our desk work; many additional repositories were mined before numbers were frozen.
Market-Sizing & Forecasting
A top-down supply-and-utilization model reconstructs value by layering farmgate output, average realized prices, and post-harvest loss factors, which are then corroborated with selective bottom-up checks such as sampled olive-oil crusher throughput and wheat import channel invoices. Key variables include harvested hectares, yield per hectare, import parity pricing, irrigation coverage, fertilizer intensity, and subsidy pass-through ratios. Forecasts deploy multivariate regression blended with scenario analysis around rainfall variance and EU demand elasticity, producing a CAGR and a baseline value.
Data Validation & Update Cycle
Outputs move through variance screening against World Bank value-added series and customs export tallies before senior analyst sign-off. Reports refresh yearly, with interim updates after droughts, tariff shifts, or subsidy revisions.
Why Mordor's Tunisia Agriculture Baseline Delivers Dependable Clarity
Published estimates differ; rival figures often swing with scope choices, conversion rates, or dated inventories. Two widely cited numbers are USD 4.07 billion for 2021 and USD 4.50 billion for 2023.
Key gap drivers include whether horticulture gate value is net or gross, treatment of informal livestock sales, currency base year, and refresh cadence. Mordor normalizes all segments to constant dollars, applies uniform farm-to-gate margins, and updates rainfall-linked volumes every season.
Benchmark comparison
| Market Size | Anonymized source | Primary gap driver |
|---|---|---|
| USD 3.20 B (2025) | Mordor Intelligence | - |
| USD 4.07 B (2021) | Global Consultancy A | Uses production value without subtracting intermediary inputs; older base year |
| USD 4.50 B (2023) | Data Service B | Includes fisheries and forestry; applies nominal FX without inflation adjustment |
These contrasts show why decision-makers lean on Mordor's seasonally refreshed, scope-disciplined baseline that can be traced to transparent variables and repeatable steps.


Key Questions Answered in the Report
What is the current size of the Tunisia agriculture market?
The Tunisia agriculture market reached USD 3.21 billion in 2026 and is projected to rise to USD 4.48 billion by 2031.
Which commodity group grows the fastest and at what rate?
Fruits and vegetables lead growth, advancing at a 6.80% CAGR through 2031 on the back of greenhouse expansion and off-season demand in Europe.
Which commodity holds the largest share and what is its growth outlook?
Cereals and grains account for 45% of market value in 2025 and expand at a 3.00% CAGR through 2031.
Where are geothermal greenhouses concentrated?
Kebili, Tozeur, and Gabes use underground heat and solar power to grow winter tomatoes and peppers.
Page last updated on:


