
Market Overview
| Study Period | 2020 - 2031 |
|---|---|
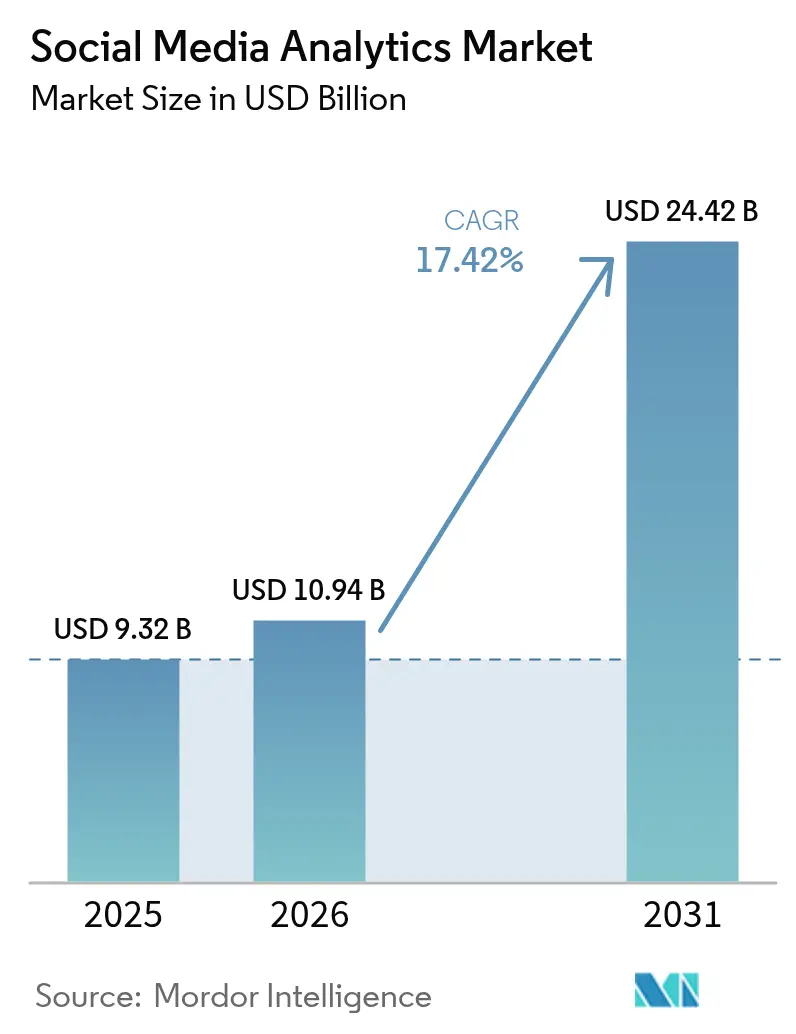
| Market Size (2026) | USD 10.94 Billion |
| Market Size (2031) | USD 24.42 Billion |
| Growth Rate (2026 - 2031) | 17.42 % |
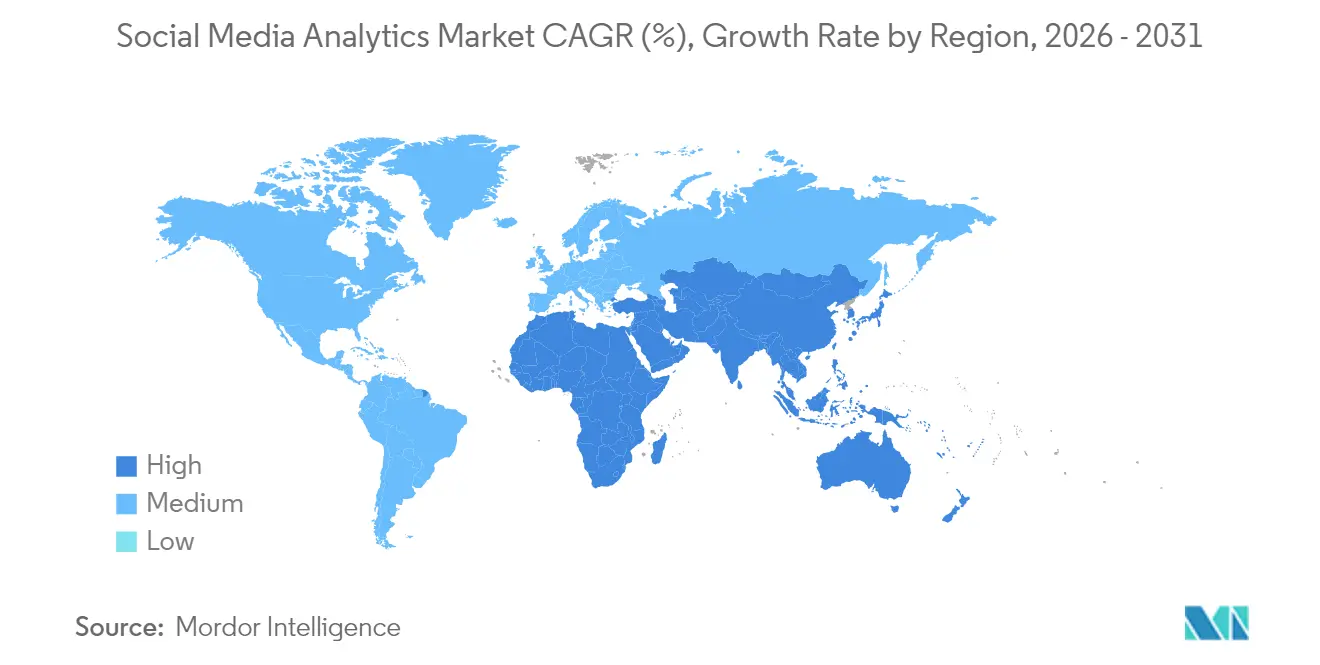
| Fastest Growing Market | Asia Pacific |
| Largest Market | North America |
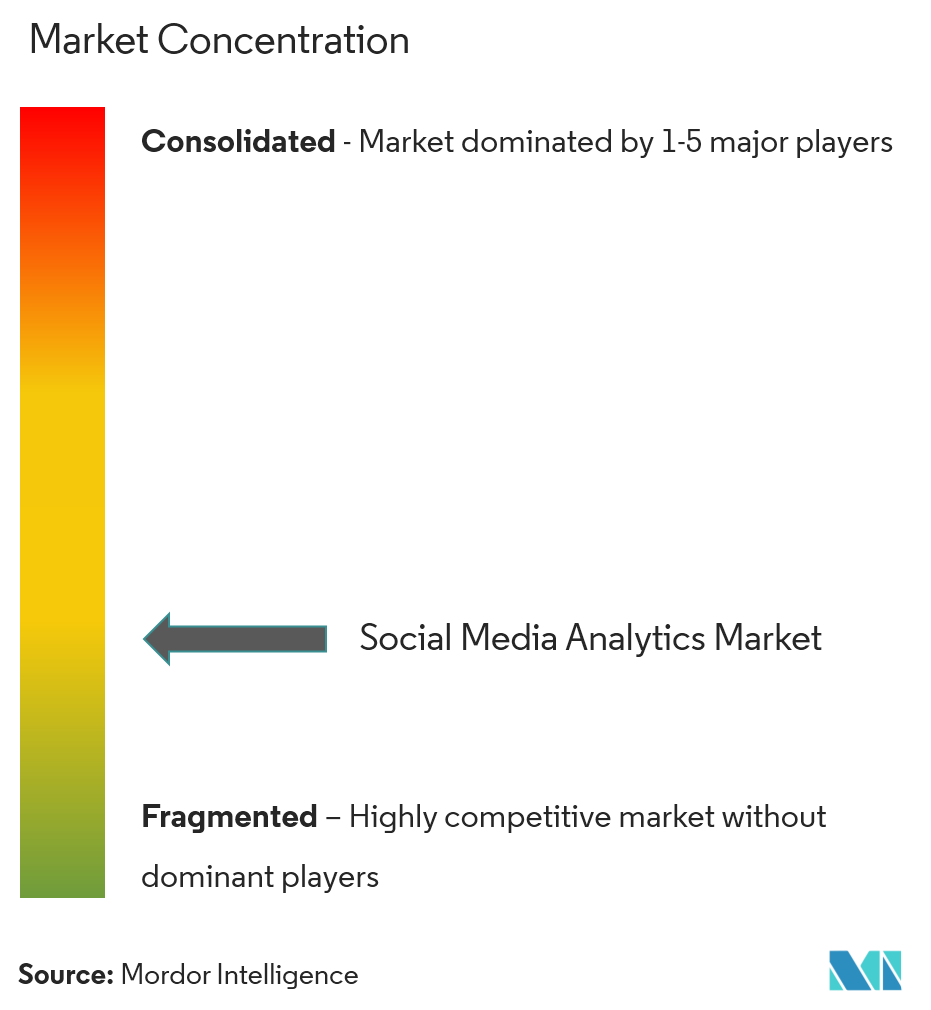
| Market Concentration | Medium |
Major Players *Disclaimer: Major Players sorted in no particular order Image © Mordor Intelligence. Reuse requires attribution under CC BY 4.0. | |
Social Media Analytics Market Analysis by Mordor Intelligence
The social media analytics market size is expected to grow from USD 9.32 billion in 2025 to USD 10.94 billion in 2026 and is forecast to reach USD 24.42 billion by 2031 at 17.42% CAGR over 2026-2031. Surging enterprise demand for real-time sentiment detection, predictive behavioral modeling, and campaign ROI measurement underpins this expansion. [1]Adobe Inc., “2025 AI and Digital Trends,” adobe.com Growth also reflects a decisive pivot from stand-alone brand monitoring toward unified, AI-driven insight engines that ingest text, image, audio, and video at scale. Accelerated cloud migration, the proliferation of social commerce, and fresh data-privacy mandates are reshaping solution roadmaps. Vendors able to combine multimodal processing, transparent model governance, and domain-specific data connectors are capturing share as buyers consolidate point tools into integrated customer-experience stacks. Competitive intensity remains high because switching costs are modest and proof-of-value cycles are short; as a result, product roadmaps emphasize continuous model retraining and embedded GenAI co-pilots to sustain differentiation.
Key Report Takeaways
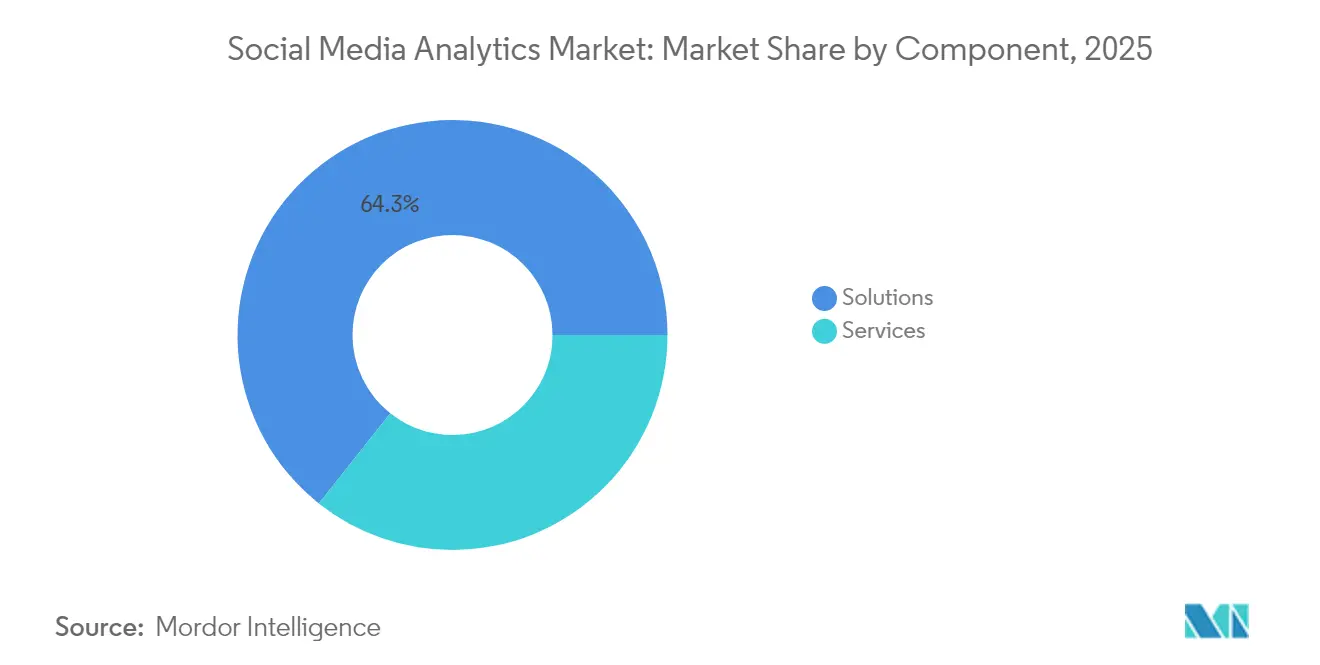
- By component, Solutions led with 64.32% revenue share in 2025; Services are expanding at a 22.65% CAGR to 2031, reflecting the implementation complexity of GenAI use-cases.
- By deployment mode, Cloud reached 71.25% of the social media analytics market share in 2025 and is forecast to grow at a 21.25% CAGR as scalability needs rise.
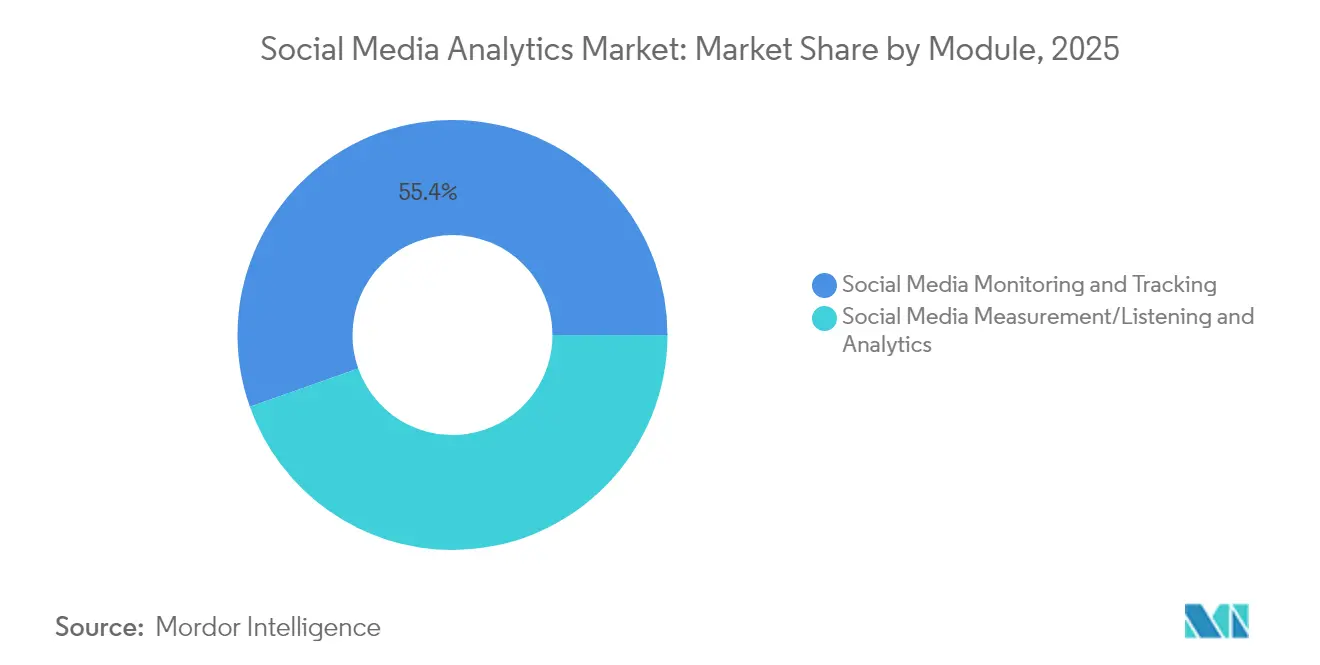
- By module, Monitoring and Tracking held 55.42% share in 2025, while Measurement/Listening and Analytics record the fastest CAGR at 19.62% to 2031.
- By end-user industry, Retail and e-Commerce accounted for 21.65% of the social media analytics market size in 2025; Healthcare and Life-sciences is projected to advance at a 24.14% CAGR.
- By geography, North America commanded 37.55% of 2025 revenue; Asia-Pacific is the fastest growing region at a 20.85% CAGR through 2031.
Note: Market size and forecast figures in this report are generated using Mordor Intelligence’s proprietary estimation framework, updated with the latest available data and insights as of 2026.
Market Trends and Insights
Drivers Impact Analysis of Social Media Analytics Market*
| Driver | (~) % Impact on CAGR Forecast | Geographic Relevance | Impact Timeline |
|---|---|---|---|
| Exponential Growth of Number of Social Media Users | +4.2% | Global, with APAC leading growth | Medium term (2-4 years) |
| GenAI-powered Insight Engines Driving Upsell in North America | +3.8% | North America and EU | Short term (≤ 2 years) |
| Acceleration of In-App Social Commerce ROI Tracking | +3.1% | Global, concentrated in APAC and North America | Medium term (2-4 years) |
| Brand-safety Metric Mandates by Global Advertisers (US and EU) | +2.4% | North America and EU, spillover to APAC | Long term (≥ 4 years) |
| Source: Mordor Intelligence | |||
Exponential Growth of Number of Social Media Users
More than 5.24 billion individuals engage on social channels in 2025, expanding data volumes and pushing the social media analytics market toward scalable cloud architectures that parse billions of daily interactions. [2]Socialinsider Research, “2025 Social Media Benchmarks,” socialinsider.io Rising video-first engagement on TikTok, with 2.50% average interaction rates versus 0.50% on Instagram, forces vendors to embed image and video classifiers, displacing text-only sentiment tools. Healthcare providers leverage this user surge to track public health signals, with 90% of US adults sourcing health information on social platforms. Data diversity strengthens vendor lock-in because proprietary domain ontologies and language models improve accuracy over time. However, the need to de-duplicate bots and fake interactions escalates compute costs and necessitates continual algorithmic refinement.
GenAI-Powered Insight Engines Driving Upsell in North America
North American enterprises invest heavily in GenAI to transform passive monitoring into predictive guidance. Sixty-nine percent of regional marketers call GenAI revolutionary for content personalization. Advanced transformer models now detect misinformation with 99.68% accuracy, lifting overall data fidelity. Banking pilots that applied Long Short-Term Memory networks across 136,150 social posts achieved 91% customer-sentiment classification accuracy, enabling micro-segmented campaign offers. Yet only 12% of firms report clear GenAI ROI, creating advisory and managed-service opportunities for providers that can bridge the skills gap. Vendors rolling out low-code model-training interfaces and explainability dashboards are best positioned to capture expansion revenue.
Acceleration of In-App Social Commerce ROI Tracking
The social media analytics market responds to commerce-first platform design as TikTok, Instagram, and WeChat enable native checkout. US social commerce sales are poised to reach USD 80 billion in 2025, demanding real-time attribution models that clarify which creative, influencer, or discount closed a transaction. Asia-Pacific advertisers already allocate USD 77 billion to social placements, growing 15% annually, fuelling analytics demand for multi-touch funnel views. Commerce brands applying granular cohort analysis report 75% higher engagement, but must solve for SKU-level data harmonization across platforms. Vendors embedding product-ID stitching and lifetime-value repeat-purchase metrics strengthen renewal odds.
Brand-Safety Metric Mandates by Global Advertisers
EU Digital Services Act rules that took effect February 2024 require platforms to reveal content-moderation processes, boosting demand for audit-grade analytics that track adjacency risk and misinformation exposure. [3]European Commission, “Digital Services Act,” ec.europa.eu Imperial College research shows 37% of 2024 web traffic was malicious bot activity, up 5% over 2023. Advertisers now stipulate pre-bid avoidance of extremist or fraudulent content, pushing analytics engines to incorporate bot scoring and contextual classifiers. Vendors that certify to GARM standards and offer configurable brand-safety taxonomies enjoy preferred-vendor status on agency buying desks.
Restraints Impact Analysis of Social Media Analytics Market*
| Restraint | (~) % Impact on CAGR Forecast | Geographic Relevance | Impact Timeline |
|---|---|---|---|
| Stringent Privacy Regulations Limiting Data Granularity | -2.8% | EU and North America, expanding globally | Long term (≥ 4 years) |
| Analytics Skill-set Gap for Multimodal Data Interpretation Hinders the Market | -2.1% | Global, acute in emerging markets | Medium term (2-4 years) |
| Bot and Fake-traffic Distortion of Sentiment Metrics Hinders the Market | -1.7% | Global, concentrated in high-engagement platforms | Short term (≤ 2 years) |
| Source: Mordor Intelligence | |||
Stringent Privacy Regulations Limiting Data Granularity
GDPR enforcement cut third-party tracking capability by 14.79% for EU publishers, compelling platforms to devise privacy-preserving analytics such as federated learning. The California Consumer Privacy Act extends similar constraints across the United States. Meta’s “Pay or Okay” policy illustrates how consent frameworks reduce data availability and complicate cross-platform user stitching. Vendors able to deliver aggregated, cohort-level insights while preserving individual privacy comply with regulation and reduce client risk exposure.
Analytics Skill-Set Gap for Multimodal Data Interpretation
Transformer-based multimodal models require expertise in cross-modal fusion rarely found in traditional marketing teams. The 2024 MuSe Challenge recorded only a 0.3573 correlation coefficient on perception tasks, underscoring interpretive difficulty. [4]arXiv Contributors, “MuSe 2024 Multimodal Sentiment Analysis Challenge,” arxiv.org Scarce talent elongates deployment cycles and inflates total cost of ownership. Provider roadmaps prioritize automated feature engineering, drag-and-drop labeling, and managed-model services to close this capability gap.
*Our forecasts treat driver/restraint impacts as directional, not additive. The impact forecasts reflect baseline growth, mix effects, and variable interactions.
Social Media Analytics Market Segment Analysis
By Component:
Services Accelerate Despite Solutions DominanceSolutions contributed 64.32% of 2025 revenue, underlining their role as the entry point to the social media analytics market. Subscription licenses provide predictable margins, yet enterprises now confront implementation backlogs that favor service engagements. Services are forecast to rise at a 22.65% CAGR as firms seek model calibration, taxonomy design, and regulatory mapping. This uptick illustrates how the social media analytics market size for implementation and optimization eclipses basic platform fees, especially when GenAI workflows demand bespoke prompt engineering. Sprinklr’s USD 796.4 million FY25 revenue, up from USD 618.2 million in FY23, showcases the dual-stream model of software plus advisory.
The momentum in professional services also stems from vertical compliance nuances. Healthcare clients require HIPAA alignment, while banking customers demand model explainability for credit-risk decisions. Providers that pool domain experts with data scientists reduce time-to-value and deepen wallet share. Consequently, advisory partners co-develop outcome-based pricing tied to conversion uplift or churn reduction, aligning incentives and boosting recurring revenue.



By Deployment Mode:
Cloud Supremacy Reinforces Infrastructure ShiftCloud captured 71.25% of the social media analytics market share in 2025 and is projected to sustain a 21.25% CAGR through 2031 on the strength of auto-scaling and managed security. Elastic GPU clusters process video streams and transformer models more cost-effectively than most on-premise alternatives. Hybrid options persist in sectors bound by data-residency rules, yet hyperscaler investment in regional zones lowers sovereignty barriers. The social media analytics market size for cloud workloads will therefore expand as real-time dashboards become board-level operational tools.
Cloud-native providers leverage continuous deployment to push weekly feature releases that refine bot-detection, language coverage, and compliance templates. Integration with broader data-warehouse ecosystems such as Snowflake and Databricks enables unified marketing, sales, and service visibility. Conversely, legacy on-premise installations struggle with model-versioning and patch latency, increasing operational risk.
By Module:
Measurement Analytics Gains Despite Monitoring LeadershipMonitoring and Tracking retains 55.42% revenue share because brand-mention alerts and crisis detection remain table stakes. Nonetheless, Measurement/Listening and Analytics is forecast to expand at 19.62% CAGR as executives demand proof that campaigns translate into pipeline, basket size, or patient outcomes. The social media analytics market size for predictive modules is rising because GenAI compresses analysis latency from days to minutes. Banking projects already report 91% classification accuracy, enabling same-day service recovery.
Growth is also fueled by cross-channel attribution. As commerce functionality embeds into social feeds, marketers insist on SKU-level lift reports. Measurement modules now incorporate identity resolution graphs and product-catalog integrations. Vendors offering unified tagging across paid, earned, and owned media enjoy cross-sell momentum, lifting average contract value.
By End-User Industry:
Healthcare Surge Challenges Retail LeadershipRetail and e-Commerce accounted for 21.65% of 2025 revenue thanks to early adoption of influencer analytics and social-commerce checkout. Yet Healthcare and Life-sciences is projected to lead expansion with a 24.14% CAGR as hospitals monitor patient sentiment, vaccine discourse, and care-path adherence. This shift indicates a broader diffusion of the social media analytics industry into mission-critical workflows. Population-health initiatives depend on near-real-time detection of outbreak chatter, while pharmaceutical firms track adverse-event mentions under strict pharmacovigilance guidelines.
For retailers, first-party data deprecation post-cookie accelerates reliance on social datasets for personalization. By contrast, healthcare institutions value clinical accuracy and data security. Providers responding with HIPAA-compliant pipelines and medical entity recognition models capture share. Cross-industry learning occurs as retail A/B testing methodologies inform patient-engagement optimization, while healthcare privacy safeguards influence retail consent frameworks.
Geography Analysis
North America Social Media Analytics Market
North America led the social media analytics market with 37.55% revenue in 2025, buoyed by sophisticated digital-ad ecosystems and early GenAI rollouts. More than 75% of US ad expenditure is online, driving pervasive use of social listening tools within omnichannel campaign orchestration. Enterprises face rising compliance overhead due to state-level privacy statutes, prompting demand for policy-aware analytics frameworks. Despite maturity, growth continues as brands extend usage from marketing into risk, investor relations, and workplace culture assessment.
APAC Social Media Analytics Market
Asia-Pacific posts the highest regional CAGR at 20.85% through 2031 as mobile-first populations adopt social commerce at scale. The region’s USD 77 billion social-media ad spend in 2024, up 15% year over year, anchors investment in cross-language sentiment and influencer fraud detection. China’s ecosystem innovation—such as Taobao’s live-stream selling—spills over to Southeast Asia, creating green-field analytics demand. India’s multilingual diversity further necessitates adaptable ontologies, spurring local-language model development partnerships.
EMEA and LATAM Social Media Analytics Market
Europe records steady growth because GDPR and the Digital Services Act force enterprises to seek compliant analytics alternatives rather than abandon insight generation. Vendors that embed consent management, on-device processing, and differential-privacy reporting expand pipeline among cautious buyers. Meanwhile, Latin America, Middle East, and Africa begin adopting off-the-shelf cloud analytics as internet penetration rises. Urban clusters in Brazil and the Gulf states mirror advanced market behaviors, accelerating social media analytics market adoption without incurring heavy localization expenditure.

Regulatory Landscape
Social media analytics deployments are being reshaped by privacy, online-safety, and AI transparency requirements that influence what data can be collected, how it can be processed, and how AI-generated outputs must be disclosed. In Europe, the Digital Services Act (in effect since February 2024 per the report context) elevates demand for audit-grade brand-safety and platform transparency reporting, and the EU AI Act introduces AI transparency obligations. The reporting notes that these obligations culminate in enforceability of Article 50 transparency requirements from August 2026, including labeling AI-generated content and marking deepfakes. As a result, vendors increasingly focus on provenance controls, explainability tooling, and policy-aware workflows for multimodal content analysis.
In the United Kingdom, Ofcom-led codes of practice set expectations for platforms to implement age-check processes from July 2025, which raises the compliance bar for analytics programs that involve youth-facing content and age-assurance signals. In the United States, federal and state-level governance continues to shape permissible data use. In February 2026, OMB approved USCIS collection of social media identifiers on multiple immigration forms (PRA clearance 1615-0169), pointing to a more formalized posture toward social identifier handling in government workflows, recordkeeping, and security controls. Taken together, these developments support a shift from granular, identity-centric tracking toward privacy-preserving analytics (aggregated/cohort reporting, minimization) and stronger governance for GenAI-assisted social insights.
Value Chain Analysis
The value chain starts with primary data sources (social networks and adjacent channels such as podcasts and creator platforms) and then moves through access and ingestion (platform APIs, licensed data partners, and managed connectors). The next stage is processing and enrichment, including language detection, entity extraction, bot and fraud scoring, and multimodal classification across text, image, audio, and video. Storage and analytics layers increasingly use cloud data platforms, for example Snowflake, BigQuery, and Databricks, before insights are activated in CX, CRM, ad-tech, and BI environments. Agency and services partners also play roles across the chain by handling taxonomy design, compliance mapping, model calibration, and integration, aligning with the report context that services growth is tied to GenAI implementation complexity.
Bottlenecks tend to concentrate on data access volatility and operational overhead. Platform schema drift, evolving API rate limits, and token or permission changes raise connector maintenance burden. The evidence pack cited in the report indicates teams can spend 40% to 60% of engineering time maintaining social data pipelines rather than building new analytics. As enterprises shift from batch exports to real-time use cases, stream-processing architectures (for example Apache Flink with fast indexing or search layers such as Elasticsearch) are used more often to support sub-second monitoring and faster crisis response. Partnerships that add first-party-like signals into enterprise suites, including Sprinklr's March 2026 integration with CreatorIQ for creator intelligence, show how vendors aim to reduce fragmentation across paid, organic, and creator-led measurement while operating within API constraints.
Competitive Landscape
The social media analytics market remains moderately fragmented; the top five vendors hold well under 40% combined revenue, preserving buyer leverage. Incumbent enterprise-software providers capitalize on installed bases to cross-sell analytics modules, while venture-backed specialists compete on depth of AI research. Product strategy now revolves around multimodal ingestion, explainable models, and pre-built compliance kits for healthcare, finance, and public sector.
Sprinklr demonstrates the value of platform breadth: FY25 revenue climbed to USD 796.4 million by delivering marketing, service, and research on one stack. Adobe amplifies Creative Cloud assets with social listening add-ons that feed generative-design tools, shortening content cycles. Challenger firms such as Dataminr exploit high-frequency news detection to serve security and crisis-management use cases. Meanwhile, AI-native start-ups integrate OpenAI APIs to provide conversational analytics in hours rather than weeks, threatening legacy renewal rates.
Strategic partnerships shape differentiation. Oracle aligns with TikTok for commerce attribution, while Google Cloud’s Vertex AI accelerates model deployment within Talkwalker. Vertical specialization also intensifies: Brandwatch pursues consumer-goods benchmarks, whereas YouScan targets visual-logo detection for automotive brands. Consolidation pressure is rising as private-equity investors seek platform roll-ups to achieve scale efficiencies.
Social Media Analytics Industry Leaders
Sprinklr
Oracle Corporation
Synthesio (Crimson Hexagon)
Brandwatch
NetBase Solutions Inc.
- *Disclaimer: Major Players sorted in no particular order
Social Media Analytics Market Companies Covered in this Report
- Sprinklr
- Oracle Corporation
- Synthesio (Crimson Hexagon)
- Brandwatch
- NetBase Solutions Inc.
- Meltwater (Sysomos Inc.)
- Talkwalker
- Sprout Social
- Digimind Social
- Brand24
- Hootsuite Inc.
- Khoros, LLC
- Clarabridge (now Qualtrics)
- Cision Ltd.
- Socialbakers (now Emplifi)
- Mentionlytics
- YouScan
- Pulsar Platform
- Dataminr
- Unmetric
- Awario
- Nuvi
- Adobe Inc.

Market Opportunities and Future Outlook
A key whitespace is interoperability and consolidation. Buyers are replacing point listening tools with unified systems that connect publishing, care, advocacy, and analytics under a single intelligence layer, and then expose those capabilities to broader enterprise stacks. June 2026 product activity from Hootsuite (Social OS, positioned as a unified layer across apps) and April 2026 activity from PostPeer (a standardized Social Media Analytics API schema across multiple networks) indicate ongoing movement toward modular, headless integration patterns. These patterns help plug social signals into BI and automation workflows without relying only on vendor-specific user interfaces. That supports demand for pre-built connectors, governed metric definitions across platforms, and low-latency pipelines that align to enterprise data warehouses.
Compliance-driven analytics engineering is another opportunity area as transparency and safety regimes expand. The EU AI Act Article 50 obligations becoming enforceable in August 2026, alongside DSA-era transparency needs highlighted in the report context, increases demand for audit-ready data lineage, content provenance, and labeling workflows across multimodal ingestion and GenAI-assisted insight generation. Legislative activity also adds pressure on privacy-preserving architectures, including the U.S. Consumer Data Privacy and Security Act of 2026 proposal (S. 4211 introduced in March 2026) and age assurance guidance and enforcement activity in multiple jurisdictions. Vendors that operationalize these requirements into configurable policy templates, automated redaction or minimization, and evidence-grade reporting can differentiate while expanding services revenue tied to implementation and ongoing governance.
Recent Industry Developments in Social Media Analytics Market
- May 2026: Sprinklr announced the acquisition of ViralMoment to strengthen multimodal customer intelligence, particularly around video-first social content. The deal expands Sprinklr's ability to analyze and activate insights from short-form video and creator-driven channels, aligning product roadmaps with the market shift toward multimodal analytics.
- November 2025: Brandwatch expanded data coverage across platforms including Threads, YouTube, TikTok, and LinkedIn, and added capabilities such as podcast transcript analysis and the AI-powered Ask Iris chatbot. Broader coverage and embedded conversational analytics raise switching costs for enterprise buyers consolidating social, media, and consumer intelligence into fewer platforms.
- December 2024: Brandwatch launched an AI-powered React Score for real-time brand reputation monitoring using a combination of generative and proprietary AI methods. Faster reputation signals support crisis response and always-on brand safety measurement, reinforcing demand for low-latency monitoring and explainable scoring in enterprise deployments.


Social Media Analytics Market Report Scope and Research Methodology
Market Definition and Coverage
For this report, the social media analytics market refers to revenue earned from software and related services that collect, process, and analyze social data to produce insights such as sentiment, trends, and performance measurement for organizations worldwide.
This sizing excludes pure social media advertising spend, influencer payouts, and generic social media management tools when they are sold without analytics or insight delivery.
Segments Covered in This Report
- By Component
- Solutions
- Services
- By Deployment Mode
- Cloud
- On-premise
- By Module
- Social Media Monitoring and Tracking
- Social Media Measurement/Listening and Analytics
- By End-user Industry
- Media and Entertainment
- IT and Telecom
- BFSI
- Retail and e-Commerce
- Travel and Hospitality
- Healthcare and Life-sciences
- Other End-user Industries
- By Geography
- North America
- United States
- Canada
- Mexico
- Europe
- United Kingdom
- Germany
- France
- Italy
- Spain
- Rest of Europe
- Asia-Pacific
- China
- India
- Japan
- South Korea
- Rest of Asia-Pacific
- South America
- Brazil
- Argentina
- Rest of South America
- Middle East and Africa
- Middle East
- GCC
- Turkey
- Israel
- Rest of Middle East
- Africa
- South Africa
- Nigeria
- Rest of Africa
- Middle East
- North America
Data Sources, Market Sizing, and Validation
Desk Research
Desk research was used to frame the market and to anchor assumptions that can be checked outside interviews. We relied on public sources such as the International Telecommunication Union (ITU) for connectivity context, World Bank and OECD digital economy indicators, UN Comtrade for relevant cross-border trade signals tied to IT services, and US SEC filings for segment notes where vendors disclose analytics or subscription revenue.
To reduce overfitting to one narrative, we also reviewed standards and measurement guidance from bodies such as NIST (for data governance references), along with reputable press coverage, earnings call transcripts, and investor presentations that describe product scope, pricing direction, and customer adoption. In parallel, we referenced paid subscriptions focused on company financial intelligence, news and financials, and patent databases to cross-check business scale and product activity. These sources are illustrative, and many other public and paid references were also used for data collection, validation, and clarification.
Primary Interviews and Surveys
Primary work was used to validate what is counted as social media analytics revenue, and to test adoption and pricing assumptions by industry and region. We spoke with a mix of software providers, implementation partners, and enterprise buyers across marketing, customer experience, and insights teams. Coverage was balanced across APAC, EMEA, and the Americas so regional spend patterns could be normalized. When responses differed, follow-up questions were used to reconcile what portion of a contract is analytics versus adjacent items such as publishing tools or broader customer analytics.
Distribution of primary research fieldwork respondents
| Company type | Respondent position | Region |
|---|---|---|
| Top tier: 26% | CXOs: 13% | APAC: 50% |
| Mid tier: 58% | Functional/Unit leaders: 28% | EMEA: 29% |
| Smaller Players: 16% | Managers: 59% | Americas: 21% |
Market-Sizing & Forecasting
The core sizing logic is top-down and starts from a demand pool built by region, using digital adoption signals and enterprise analytics spending patterns to reconstruct the share attributable to social media analytics. Once regional totals are formed, they are split and re-checked using selective bottom-up approximations, such as sampled vendor revenue ranges, partner channel checks, and simple ASP times user-seat or account-volume math, to ensure totals do not drift away from observed market behavior.
Key inputs that shape the model include social platform usage intensity, enterprise marketing and customer experience technology budgets, cloud adoption for analytics workloads, the share of spend going to social listening and measurement workflows, and the pace at which AI features are packaged in a way that can lift pricing. Since these factors move together, we applied multivariate regression for the forecast, and then adjusted variable paths using what interviewees indicated for seat growth, contract renewals, and discounting practices. Where vendor disclosures were incomplete, gaps were handled with range-based assumptions tied back to deployment mix and typical contract structures, then trimmed through follow-up validation so outliers do not overstate the total.
Data Validation & Update Cycle
Validation is done through triangulation across independent signals, then through repeat checks for unusual jumps by region, vertical, or deployment type. Analysts compare model outputs against observed budget direction, vendor commentary on bookings and renewals, and any step changes suggested by regulation or platform policy shifts, then review anomalies before sign-off.
Reports are refreshed annually, and interim updates are triggered when material events occur, such as a major pricing reset or a structural change in data access from large social platforms. Before delivery, a fresh pass is completed so the final numbers reflect the latest public information and any new confirmations received through follow-up outreach.
Mordor Intelligence's Global Social Media Analytics Market Size Compared With Other Published Estimates
Published market values for social media analytics often differ, even when they appear to describe the same space. The gaps typically come from different scope choices, different treatment of services and adjacent tools, and differences in timing for currency conversion and refresh.
Some estimates widen the scope to include broader social media management, content publishing, or surrounding digital marketing analytics revenue. In Mordor Intelligence, revenue is counted only when it is tied to social media monitoring, measurement, or listening, and when analytics and insight delivery are part of the offering. That narrower counting tends to keep totals lower than sources that fold in adjacent spend.
Benchmark comparison
| Source | Market Size | Gaps in Research Methodology |
|---|---|---|
| Mordor Intelligence | USD 10.94 B (2026) | |
| Industry Publisher A | USD 16.53 B (2025) | Uses a broader solutions-and-services definition that can absorb adjacent social media management and related digital insight tooling, and it also reports a different base year, which shifts the current-year level. |
| Industry Publisher B | USD 17.10 B (2025) | Includes a wider application-led scope that can blend social media analytics with nearby customer and marketing analytics workstreams, and the forecast path assumes faster pricing expansion from bundled AI features. |
Looking across the table, the spread is mainly explained by what gets counted as in-scope revenue and by the choice of year used for the headline number. Our approach stays traceable to practical demand indicators and repeatable checks, which makes it easier for decision-makers to map the estimate to what buyers actually purchase and renew.


Key Questions Answered in the Report
What is the current value of the social media analytics market?
The market is valued at USD 10.94 billion in 2026 and is projected to reach USD 24.42 billion by 2031.
Which region will grow the fastest through 2031?
Asia-Pacific is forecast to post a 20.85% CAGR due to mobile-first social-commerce adoption and rising ad budgets.
Why are services growing faster than software licenses?
Enterprises need expert support for GenAI tuning, compliance mapping, and multimodal data integration, pushing Services to a 22.65% CAGR.
How are privacy regulations affecting analytics capabilities?
GDPR and state-level US laws reduce data granularity, driving demand for privacy-preserving analytics that rely on federated learning and aggregated reporting.
Which end-user industry shows the highest growth potential?
Healthcare and Life-sciences is projected to expand at a 24.14% CAGR as providers adopt social listening for patient engagement and public-health surveillance.
What emerging feature differentiates leading platforms?
Embedded GenAI co-pilots that convert raw social signals into predictive guidance and creative recommendations are becoming must-have capabilities.
Page last updated on:





