
Serviced Apartment Market Size and Share
Market Overview
| Study Period | 2022 - 2031 |
|---|---|
| Market Size (2026) | USD 157.11 Billion |
| Market Size (2031) | USD 266.78 Billion |
| Growth Rate (2026 - 2031) | 11.17 % |
| Fastest Growing Market | Asia-Pacific |
| Largest Market | North America |
| Market Concentration | Low |
Major Players *Disclaimer: Major Players sorted in no particular order Image © Mordor Intelligence. Reuse requires attribution under CC BY 4.0. | |
Serviced Apartment Market Analysis by Mordor Intelligence
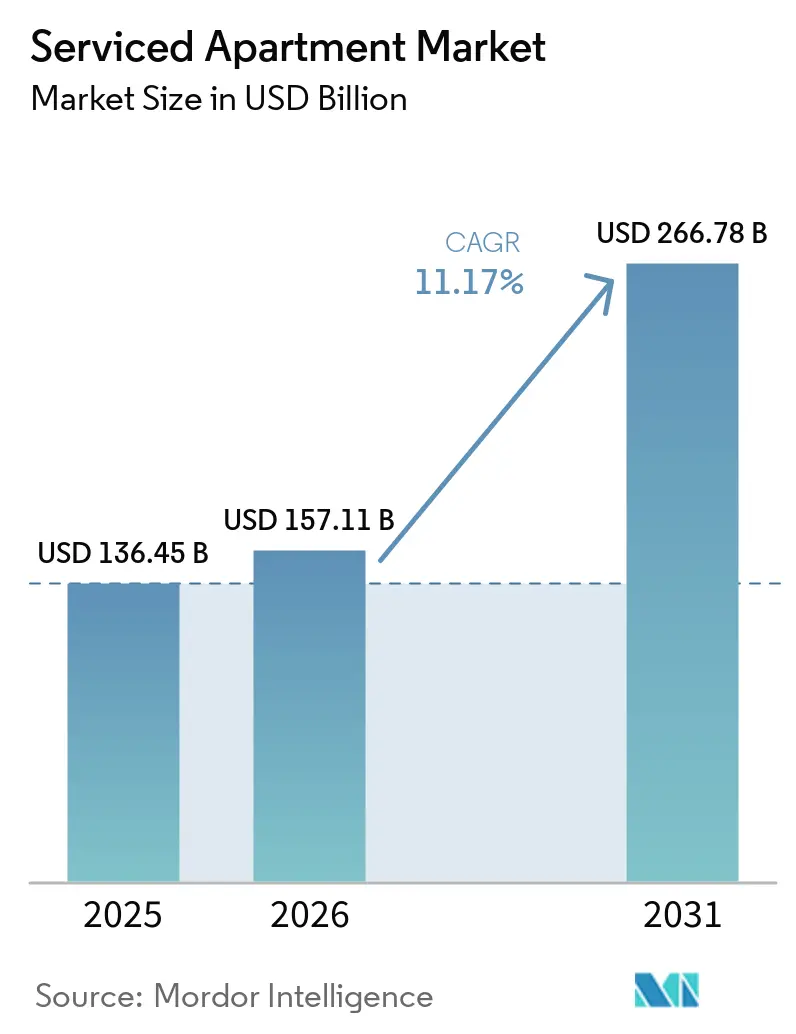
The Serviced Apartment Market size is expected to grow from USD 136.45 billion in 2025 to USD 157.11 billion in 2026 and is forecast to reach USD 266.78 billion by 2031 at 11.17% CAGR over 2026-2031.
The global serviced apartment market is expanding on the back of stronger corporate mobility, relocation demand, and a clear shift toward longer stays that combine residential comfort with hotel-style services. Companies are increasingly using professionally managed furnished accommodation for assignments that run beyond a week, as pricing is more transparent and duty-of-care requirements are easier to manage in this format. The booking window also tightened from 12 days to 7 days over the last four quarters, suggesting deeper integration of this format into corporate mobility workflows. The global serviced apartment market is also benefiting from tighter regulation on informal short-term rentals in several urban markets, which is redirecting demand toward compliant operators. From an India-focused industry lens, this pattern matters because rising GCC activity in cities such as Pune, Jaipur, Kochi, and Coimbatore is creating demand for quality long-stay inventory in markets where professionally managed supply remains limited.[1]
Key Report Takeaways
- By type, long-term (More Than 30 Nights) held 62.10% of revenue for the Global Serviced Apartment Market in 2025 and is projected to expand at a 13.90% CAGR through 2031.
- By booking mode, online travel platforms accounted for 54.55% of bookings in 2025 and are forecast to grow at a 14.23% CAGR through 2031.
- By traveler type, international travelers accounted for 61.65% of the revenue for the Global Serviced Apartment Market in 2025 and are projected to grow at a 13.34% CAGR through 2031.
- By end use, corporate and business travelers accounted for 65.12% of revenue in 2025 and recorded the highest projected CAGR of 14.27% through 2031.
- By geography, North America commanded a 35.44% share of the Global Serviced Apartment Market in 2025, while Asia-Pacific is projected to grow at the highest CAGR of 14.66% through 2031.
Note: Market size and forecast figures in this report are generated using Mordor Intelligence’s proprietary estimation framework, updated with the latest available data and insights as of January 2026.
Global Serviced Apartment Market Trends and Insights
Drivers Impact Analysis*
| Drivers | (~) % Impact on CAGR Forecast | Geographic Relevance | Impact Timeline |
|---|---|---|---|
| Longer Stay Demand from Corporate Mobility and Relocation | +3.5% | Global | Short term (≤ 2 years) |
| Regulatory Re-Allocation Away from Informal Short-Term Rentals | +2.2% | Europe, North America | Medium term (2-4 years) |
| Hybrid Living, Working, And Co-Living Preferences | +1.4% | Global | Medium term (2-4 years) |
| Institutional Capital Seeking Operationally Efficient Living Assets | +1.2% | Europe, Asia-Pacific | Long term (≥ 4 years) |
| Technology-Led Direct Booking and Revenue Management | +0.9% | Global | Short term (≤ 2 years) |
| Rising Demand from Project-Based Workforce Deployment | +1.3% | North America, the Middle East and Africa, Asia-Pacific | Medium term (2-4 years) |
| Source: Mordor Intelligence | |||
Longer Stay Demand from Corporate Mobility and Relocation
Corporate mobility is moving further away from conventional hotel stays and toward longer-stay furnished formats with better cost visibility and easier compliance handling. In the global serviced apartment market, this supports steadier demand because assignments linked to relocation, internal transfers, and rotational staffing often run well beyond a few nights. Business travel spending is expected to reach USD 1.57 trillion in 2026, which keeps the corporate demand base active across major markets. Companies are also treating these properties as part of their risk-control framework because professional management, inclusive pricing, and standardized service reduce the uncertainty that comes with informal rentals. This shift is also relevant for India, where multinational employers expanding GCC operations need accommodation that can support both short onboarding cycles and multi-month project stays.
Regulatory Re-Allocation Away from Informal Short-Term Rentals
Regulatory tightening across several major markets is acting as a channel for demand transfer in the global serviced apartment market. Stricter rules in cities like Amsterdam and Edinburgh, as well as broader national regulations in France and Spain, are making compliance harder for unregulated short-term rental inventory and easier for professionally managed operators to win displaced demand. This matters because compliant serviced apartment operators can absorb guests who still need city-based, furnished, flexible accommodation, especially for work-led travel. The effect is not only about occupancy, because it also improves the relative position of licensed operators when investors and corporate buyers compare risk. For the global serviced apartment market, the result is a stronger competitive moat in cities where enforcement is tightening, and professional formats have clearer legal standing.[2]
Hybrid Living, Working, and Co-Living Preferences
The global serviced apartment market is also gaining support from changing consumer preferences around living and working patterns. Guests now expect furnished accommodation to support work, rest, and daily life in one setting, especially when travel lasts more than a few nights. This is increasing the appeal of apartments that offer kitchens, living space, connectivity, and the ability to function as a temporary home rather than only a room for sleep. The effect is visible across both corporate and non-corporate demand, because the same layout can suit a project assignee, a relocated employee, or a professional on a mid-length work trip. In India, this preference shift is especially relevant in emerging business cities where younger mobile workforces value flexibility but still expect predictable service standards.
Institutional Capital Seeking Operationally Efficient Living Assets
Institutional capital is providing the global serviced apartment market with added support, as the asset class now sits between residential stability and hotel-style operating upside. More investors targeted serviced apartments in 2025 compared to 2024, and that platform-level funding has also moved into the space. CapitaLand highlighted the same structural appeal in its June 2025 residential and living report, where flexible living formats were positioned as operational real estate with diversified demand pools. For the global serviced apartment market, this means more interest in assets that can deliver occupancy resilience, steady income, and better use of urban living formats. It also improves the odds of more organized expansion in high-demand corridors, including Asia-Pacific cities that continue to attract global business activity.
Restraints Impact Analysis*
| Restraints | (~) % Impact on CAGR Forecast | Geographic Relevance | Impact Timeline |
|---|---|---|---|
| Fragmented Supply and Inconsistent Operating Standards | -0.8% | Global | Short term (≤ 2 years) |
| Zoning, Licensing, And Planning Constraints in Core Cities | -1.2% | Europe, North America | Medium term (2-4 years) |
| High Fit-Out, Compliance, And Asset Conversion Costs | -0.7% | Global | Long term (≥ 4 years) |
| Limited High-Quality Investable Stock in Prime Markets | -0.5% | Europe, North America | Long term (≥ 4 years) |
| Source: Mordor Intelligence | |||
Fragmented Supply and Inconsistent Operating Standards
Fragmented supply remains one of the clearest operational limits on the global serviced apartment market. Large corporate buyers want consistent quality, transparent reporting, consolidated billing, and compliance-ready documentation across multiple cities, but smaller, independent operators often struggle to deliver this at scale. The revenue management in this segment is more complex than in standard hotel inventory because stay length and utilization patterns differ sharply. This creates a technological barrier separating well-funded platform operators from undercapitalized independents. In the global serviced apartment market, that gap affects both profitability and buyer confidence, especially in enterprise-led contracts.
Zoning, Licensing, and Planning Constraints in Core Cities
Zoning and licensing barriers are slowing supply expansion in several high-demand urban markets. Operators in some cities face major planning hurdles when they try to convert assets or open new stock without the right use classification. This matters because the market opportunity is already present, but the time taken to secure approvals delays revenue generation and limits new capacity. The effect is stronger in gateway cities where land is scarce, conversions are complicated, and policy attention on housing and tourism is high. In the global serviced apartment market, these constraints keep existing licensed supply valuable while also capping the pace of near-term scaling.
*Our forecasts treat driver/restraint impacts as directional, not additive. The impact forecasts reflect baseline growth, mix effects, and variable interactions.
Segment Analysis
By Type: Long-Term Formats Anchor Revenue While Shorter Stays Broaden Demand
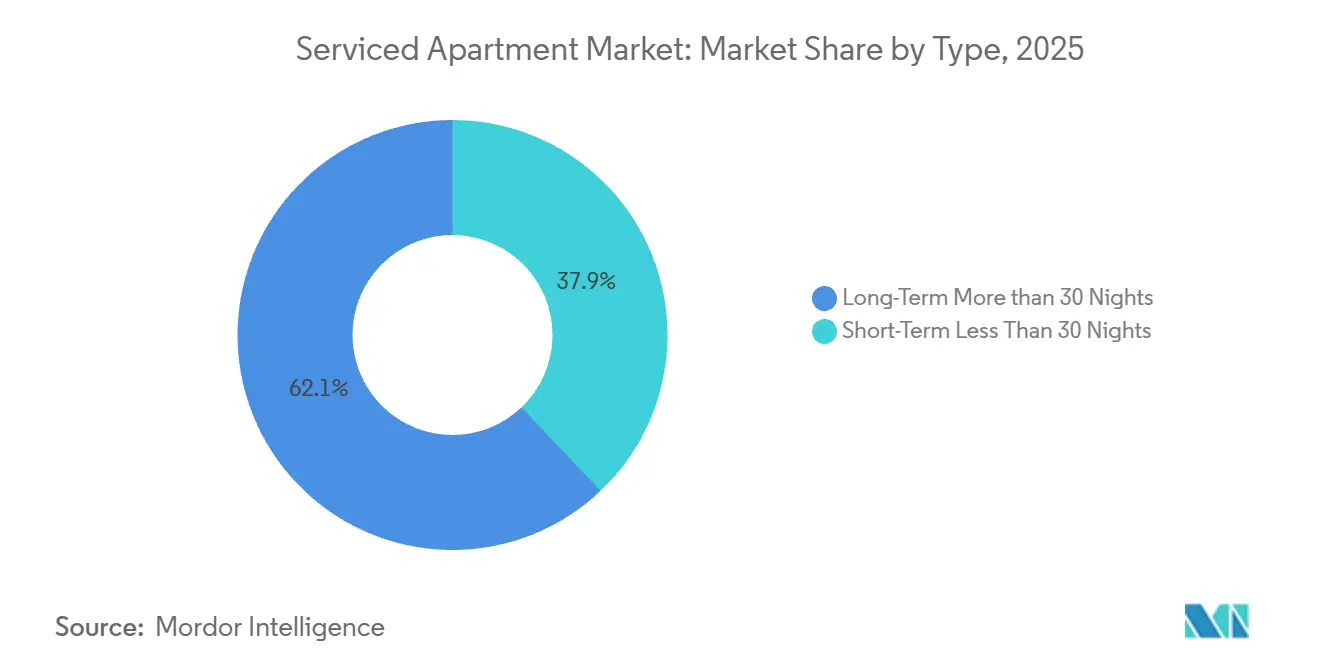
Long-Term (>30 Nights) accommodation held 62.10% of the global serviced apartment market share in 2025 and is projected to grow at a 13.90% CAGR through 2031. This segment continues to lead because corporate assignments, expatriate relocations, and project-based deployments still require furnished units that can function as temporary homes. The value proposition is straightforward: clients get inclusive utilities, living space, and service support in one package, while operators benefit from steadier occupancy and stronger unit economics over longer-stay periods. In the global serviced apartment market, longer stays also reduce turnover intensity, helping operators manage labor and service costs more efficiently. The segment remains closely tied to business mobility patterns, which is why it remains the core revenue anchor.
Short-Term (<30 Nights) accommodation remains smaller in revenue share, but it is expanding its role as demand patterns become more flexible. Guests staying for 7 to 12 nights increasingly prefer managed apartments when they want more space, privacy, and in-room utility than a standard hotel room provides. This does not displace long-term demand, but it does widen the addressable customer base for the same operating format. The global serviced apartment market, therefore, benefits from a broader stay-length spectrum, in which a single property can appeal to both corporate and lifestyle travelers across different trip durations. Operators that can balance rate, occupancy, and stay length across both formats are likely to create more stable portfolio performance through the cycle.

By Booking Mode: Platforms Lead Volumes While Direct Channels Improve Economics
Online Travel Platforms accounted for 54.55% of bookings in 2025 and are forecast to grow at a 14.23% CAGR through 2031. Their lead comes from visibility, comparison tools, and the convenience of established digital booking behavior across leisure and mixed-purpose travelers. In the global serviced apartment market, these platforms remain the highest-volume channel, especially for shorter stays and first-time bookings in new cities. Their influence is also reinforced by loyalty ecosystems and rate transparency, which help users compare furnished accommodation with hotel options within the same trip-planning flow. This means platform dependency is still a defining feature of distribution for many operators.
Direct Booking remains strategically important because the economics are better when operators can avoid third-party commissions and manage the guest relationship themselves. Moving 15% to 20% of bookings toward direct channels can recover meaningful commission outflow for a 50-unit property. Direct channels also suit corporate buyers because negotiated rate codes, B2B portals, and consolidated billing better align with procurement and compliance processes than retail booking journeys. Others, including marketplace booking, relocation platforms, and specialist corporate housing channels, continue to matter for longer stays, where transparency into the total assignment cost is more important than broad consumer discovery. The global serviced apartment market is therefore likely to remain split between high-volume platform distribution and higher-margin managed channels, with technology investment shaping who benefits most.
By Traveler Type: International Demand Leads While Domestic Use Builds Stability
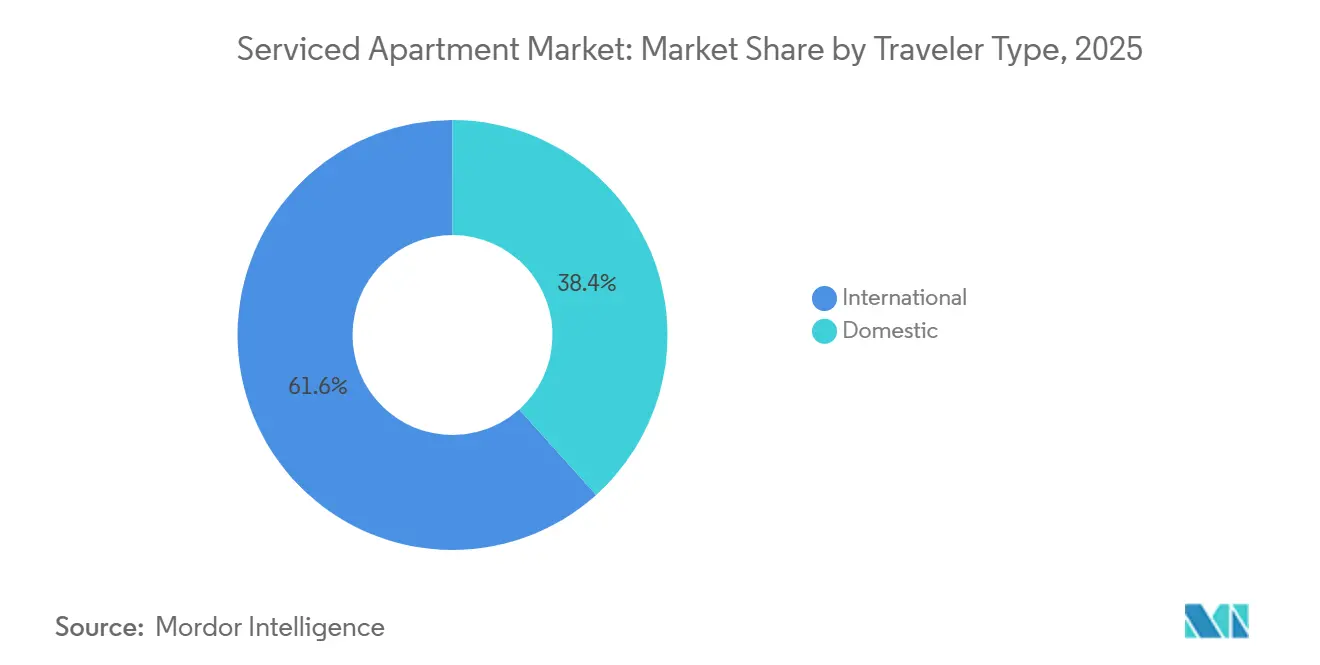
International travelers accounted for 61.65% of the global serviced apartment market in 2025 and are projected to grow at a 13.34% CAGR through 2031. This segment leads because cross-border corporate travel, expatriate mobility, and inbound business-linked travel still generate the highest concentration of extended-stay need. International demand is especially important in cities that serve as regional headquarters, relocation centers, or project management bases. It also supports premium pricing because travelers arriving for work, onboarding, or transition often require convenience, certainty, and furnished accommodation from day 1. The global serviced apartment market, therefore, continues to depend heavily on cross-border demand in its largest urban clusters.
Domestic travelers remain smaller in share, but they are becoming more important as a stabilizing layer of demand. This is especially visible where companies move staff across regions within the same country for infrastructure, technology, manufacturing, and internal transfer assignments. In India, domestic business mobility is becoming more relevant as GCC expansion spreads beyond major metros into cities such as Pune, Jaipur, Kochi, and Coimbatore, where quality serviced inventory is still catching up. Domestic demand also helps operators reduce exposure to external shocks that may affect inbound travel or aviation flows. Over time, this mix should make the global serviced apartment market less dependent on only international gateways and more balanced across national corporate networks.
By End Use: Corporate Demand Leads While Other Uses Deepen Occupancy Support
Corporate and Business Travellers accounted for 65.12% of the global serviced apartment market size in 2025 and are projected to expand at a 14.27% CAGR through 2031. This is the largest and fastest-growing end-use segment because business mobility needs now span executive travel, long assignments, trainee housing, rotational staffing, and project teams. The segment is also internally layered, which creates space for premium, midscale, and value-led products within the same operating model. In the global serviced apartment market, this depth of demand is important because it supports scale and enables operators to place different traveler profiles within one brand family or across one city portfolio. Corporate demand, therefore, continues to set the pace for revenue visibility and asset planning.
Expats and Relocators remain smaller in absolute value, but they offer longer stays and more predictable move-in and move-out cycles. Leisure Travelers are also contributing to occupancy, particularly for family trips and multi-person stays where a standard hotel room is less suitable. This means a single property can capture multiple demand pools without changing its core operating format. The model is particularly attractive where a city serves both business and lifestyle travel, because operators can use the same unit base across different customer groups throughout the year. In the global serviced apartment market, this broader end-use mix improves utilization and reduces the risk of relying on a single traveler category.
Geography Analysis
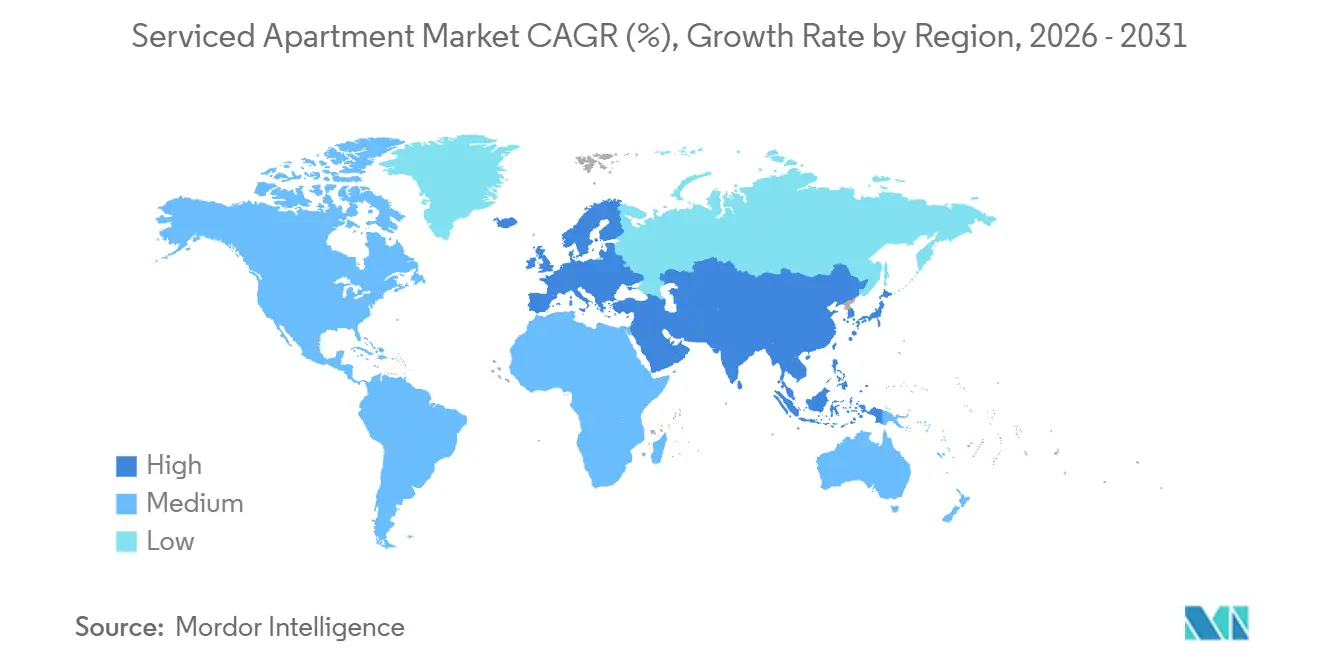
North America held 35.44% of the global serviced apartment market share in 2025, making it the largest regional market. The region benefits from a mature extended-stay ecosystem, deeper corporate housing infrastructure, and steady demand from business mobility across the United States, Canada, and Mexico. The United States extended-stay hotel demand rose 5.4% year on year in Q1 2026, while occupancy remained 13.5 percentage points above comparable hotel classes, which supports the structural strength of the format. Project-linked demand tied to data centers, manufacturing, and infrastructure investment is adding further support in corridors such as Texas, Northern Virginia, and the Midwest. At the same time, fit-out and labor costs, along with zoning timelines, are keeping new supply disciplined, which protects pricing for existing inventory.
Europe remains one of the most established regions in the global serviced apartment market, supported by gateway cities such as London, Berlin, Madrid, Paris, and Amsterdam. Demand is being supported by tighter regulation of informal short-term rentals, which is improving the position of licensed, professionally managed operators in several urban markets. Serviced apartment occupancy in Europe reached 79% in 2025, compared with 75% for the wider hotel market, suggesting stronger operating resilience for this format. The Middle East and Africa remain less penetrated. Still, the region is scaling as real estate, infrastructure, energy, and headquarters activity bring more long-stay business travelers and expatriate staff into key cities. This is relevant from an Indian research perspective because many Indian firms, service providers, and professionals are directly linked to mobility corridors across the Gulf.
Asia-Pacific is the fastest-growing region in the global serviced apartment market, with a projected 14.66% CAGR through 2031. Growth is being supported by manufacturing-linked workforce movement in Vietnam, semiconductor and AI investment in Japan, and the spread of GCC activity in India beyond the major metros. The Tokyo serviced apartment ADR rose 6% quarter on quarter in Q2 2026, which reflects stronger demand from foreign professionals and advanced industry investment. India is a standout within this region because demand is moving into Pune, Jaipur, Kochi, and Coimbatore, where professionally managed long-stay supply remains constrained. South America is still smaller in value terms, but Tier-1 cities such as São Paulo and Bogotá are gradually building a longer-stay furnished accommodation base as multinational activity in the region expands.[3]
Competitive Landscape
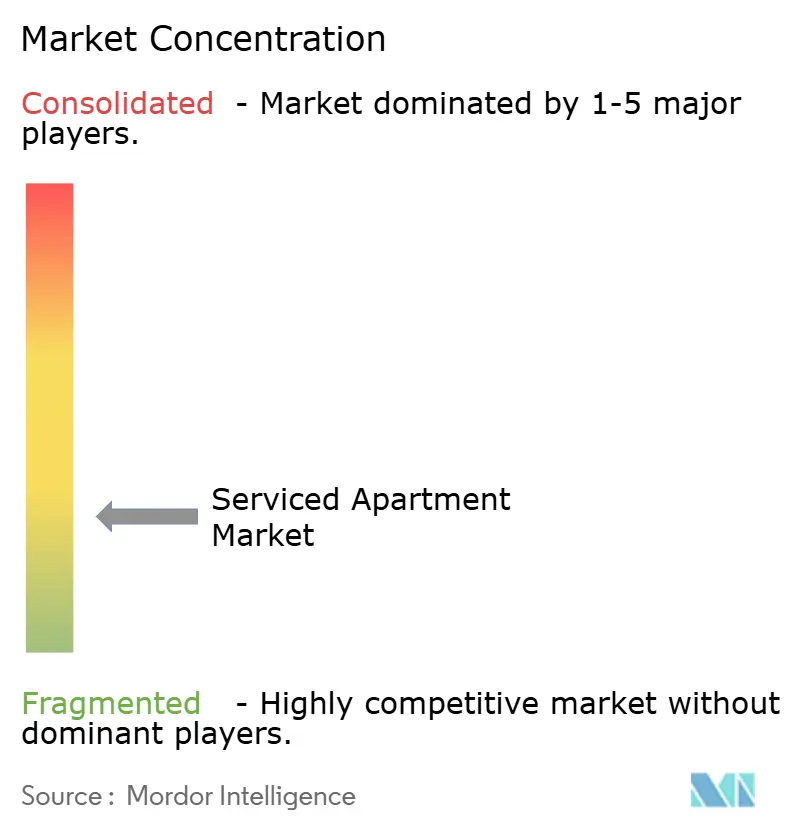
The global serviced apartment market remains fragmented, and that fragmentation shapes both competition and execution. Large hotel groups, dedicated serviced-apartment operators, and technology-led flexible-living platforms are all competing for the same long-stay demand pools. Still, they do not bring the same balance of scale, systems, and asset exposure. Some players are expanding through asset-light management and franchise structures, while others are using direct ownership or fund-backed portfolio growth. In the global serviced apartment market, this creates a clear split between operators building operating scale and those building asset bases. The competitive edge now depends less on simple unit count and more on who can manage distribution, compliance, and portfolio economics consistently across cities.
The Ascott Limited is a strong example of the expansion strategy now visible in the global serviced apartment market. It signed a record 19,000 units across 102 properties in 2025, a 27% year-on-year increase that underlined the continued push into branded living formats. It also reported its strongest-ever Southeast Asia signing performance in 2025, adding more than 7,300 units across the region, underscoring how major operators are using regional scale to deepen their pipeline. Mitsubishi Estate also moved decisively by acquiring Habyt’s Asia-Pacific portfolio, which operates units in Singapore and Hong Kong, expanding its flexible living platform, which already operates units in Japan under the Hmlet and Blueground brands. These moves show that scale, control of branded inventory, and access to flexible living demand are becoming more important than simple market presence.
Brand entry and operating model discipline are also becoming more important in the global serviced apartment market. IHG signed a dual-branded Milan development combining Crowne Plaza rooms with Staybridge Suites apartments, underscoring the value of pairing traditional hotel and extended-stay formats within a single conversion-led strategy. Marriott also advanced its StudioRes offer in 2025, positioning it as a midscale extended-stay format with a simple owner value proposition through a cost-capped franchise structure. The weaker side of the competitive picture was evident in Sonder’s collapse, which led to an immediate wind-down after the business failed to meet financial commitments under its Marriott-linked arrangement. This reinforces the point that scale alone is not enough, because the global serviced apartment market increasingly rewards capital discipline, technology strength, and operating structures that can handle variable stay patterns without excessive lease risk. For India-facing investors and operators, the same lesson applies because growth corridors are attractive, but only disciplined execution can convert demand into durable returns.
Serviced Apartment Industry Leaders
-
The Ascott Limited
-
Marriott International, Inc.
-
Frasers Hospitality
-
Accor S.A.
-
Staycity Group
- *Disclaimer: Major Players sorted in no particular order
Recent Industry Developments
- June 2026: IHG Hotels & Resorts signed a dual-branded development in Milan's NoLo district, 167 Crowne Plaza rooms and 96 Staybridge Suites apartments through the conversion of an existing hotel, with both hotels scheduled to open in January 2027. The project marks Staybridge Suites' entry into Italy and IHG's strategy to pair upper-upscale and extended-stay formats in single conversions
- April 2026: Mitsubishi Estate acquired the Asia-Pacific portfolio of Habyt, bringing units in Singapore and Hong Kong to its dedicated flexible living platform FLJ, which already operated units in Japan under the Hmlet and Blueground brands. The transaction marks a significant expansion by a major Japanese real estate conglomerate in the flexible living sector, consolidating management across multiple internationally recognized brands.
- April 2026: The Ascott Limited reported its strongest-ever Southeast Asia signings performance in 2025, adding over 7,300 units across the region, a 55% increase over the 4,700 units signed in 2024. Ascott now operates over 200 properties in Southeast Asia with a pipeline of approximately 150 further properties, placing it among the top three hospitality companies in the region by new signings
- February 2026: Saudi Arabia's Sarcc (Smart Accommodation for Residential Complexes Company, a Public Investment Fund entity) signed heads of terms with Tamimi Global to develop a 4,000-bed staff accommodation project in North Riyadh, with a total development cost of SAR 1.52 billion (USD 405 million). First phase operations are expected to commence in Q1 2029.
Global Serviced Apartment Market Report Scope
| Short-Term Less Than 30 Nights |
| Long-Term More Than 30 Nights |
| Direct Booking |
| Online Travel Platforms |
| Others (Marketplace Booking and others) |
| Domestic |
| International |
| Corporate and Business Traveler |
| Leisure Traveler |
| Expats and Relocators |
| Other End Users |
| North America | United States |
| Canada | |
| Mexico | |
| South America | Brazil |
| Peru | |
| Chile | |
| Argentina | |
| Rest of South America | |
| Europe | United Kingdom |
| Germany | |
| France | |
| Spain | |
| Italy | |
| BENELUX (Belgium, Netherlands, Luxembourg) | |
| NORDICS (Denmark, Finland, Iceland, Norway, Sweden) | |
| Rest of Europe | |
| Asia-Pacific | India |
| China | |
| Japan | |
| Australia | |
| South Korea | |
| South-East Asia (Singapore, Malaysia, Thailand, Indonesia, Vietnam, and The Philippines) | |
| Rest of Asia-Pacific | |
| Middle East & Africa | United Arab Emirates |
| Saudi Arabia | |
| South Africa | |
| Nigeria | |
| Rest of Middle East & Africa |
| By Type | Short-Term Less Than 30 Nights | |
| Long-Term More Than 30 Nights | ||
| By Booking Mode | Direct Booking | |
| Online Travel Platforms | ||
| Others (Marketplace Booking and others) | ||
| By Traveler Type | Domestic | |
| International | ||
| By End Use | Corporate and Business Traveler | |
| Leisure Traveler | ||
| Expats and Relocators | ||
| Other End Users | ||
| By Geography | North America | United States |
| Canada | ||
| Mexico | ||
| South America | Brazil | |
| Peru | ||
| Chile | ||
| Argentina | ||
| Rest of South America | ||
| Europe | United Kingdom | |
| Germany | ||
| France | ||
| Spain | ||
| Italy | ||
| BENELUX (Belgium, Netherlands, Luxembourg) | ||
| NORDICS (Denmark, Finland, Iceland, Norway, Sweden) | ||
| Rest of Europe | ||
| Asia-Pacific | India | |
| China | ||
| Japan | ||
| Australia | ||
| South Korea | ||
| South-East Asia (Singapore, Malaysia, Thailand, Indonesia, Vietnam, and The Philippines) | ||
| Rest of Asia-Pacific | ||
| Middle East & Africa | United Arab Emirates | |
| Saudi Arabia | ||
| South Africa | ||
| Nigeria | ||
| Rest of Middle East & Africa | ||
Key Questions Answered in the Report
What is the 2031 value forecast for serviced apartments worldwide?
The global serviced apartment market is forecast to reach USD 266.78 billion by 2031, rising from USD 157.11 billion in 2026 at an 11.17% CAGR.
Which booking channel leads revenue generation in this space?
Online Travel Platforms lead booking activity with a 54.55% share in 2025 and are projected to grow at a 14.23% CAGR through 2031.
Why are long-term stays so important for this business?
Long-Term stays accounted for 62.10% of revenue in 2025 and remain central because they align with relocation, project staffing, and extended corporate assignments.
Which traveler group contributes the most demand?
International travellers led with 61.65% of revenue in 2025, supported by business travel, expatriate movement, and cross-border corporate deployments.
What is driving demand in India-related corporate mobility corridors?
Growth is being supported by GCC expansion into cities such as Pune, Jaipur, Kochi, and Coimbatore, where demand for professionally managed long-stay accommodation is rising faster than quality supply.
Which region is expected to grow the fastest through 2031?
Asia-Pacific is the fastest-growing region, with a projected 14.66% CAGR, supported by manufacturing mobility, semiconductor investment, and India’s expanding corporate location footprint.