
Retail Fuel Market Size and Share
Market Overview
| Study Period | 2022 - 2032 |
|---|---|
| Market Size (2027) | USD 2.46 Trillion |
| Market Size (2032) | USD 2.88 Trillion |
| Growth Rate (2027 - 2032) | 3.17 % |
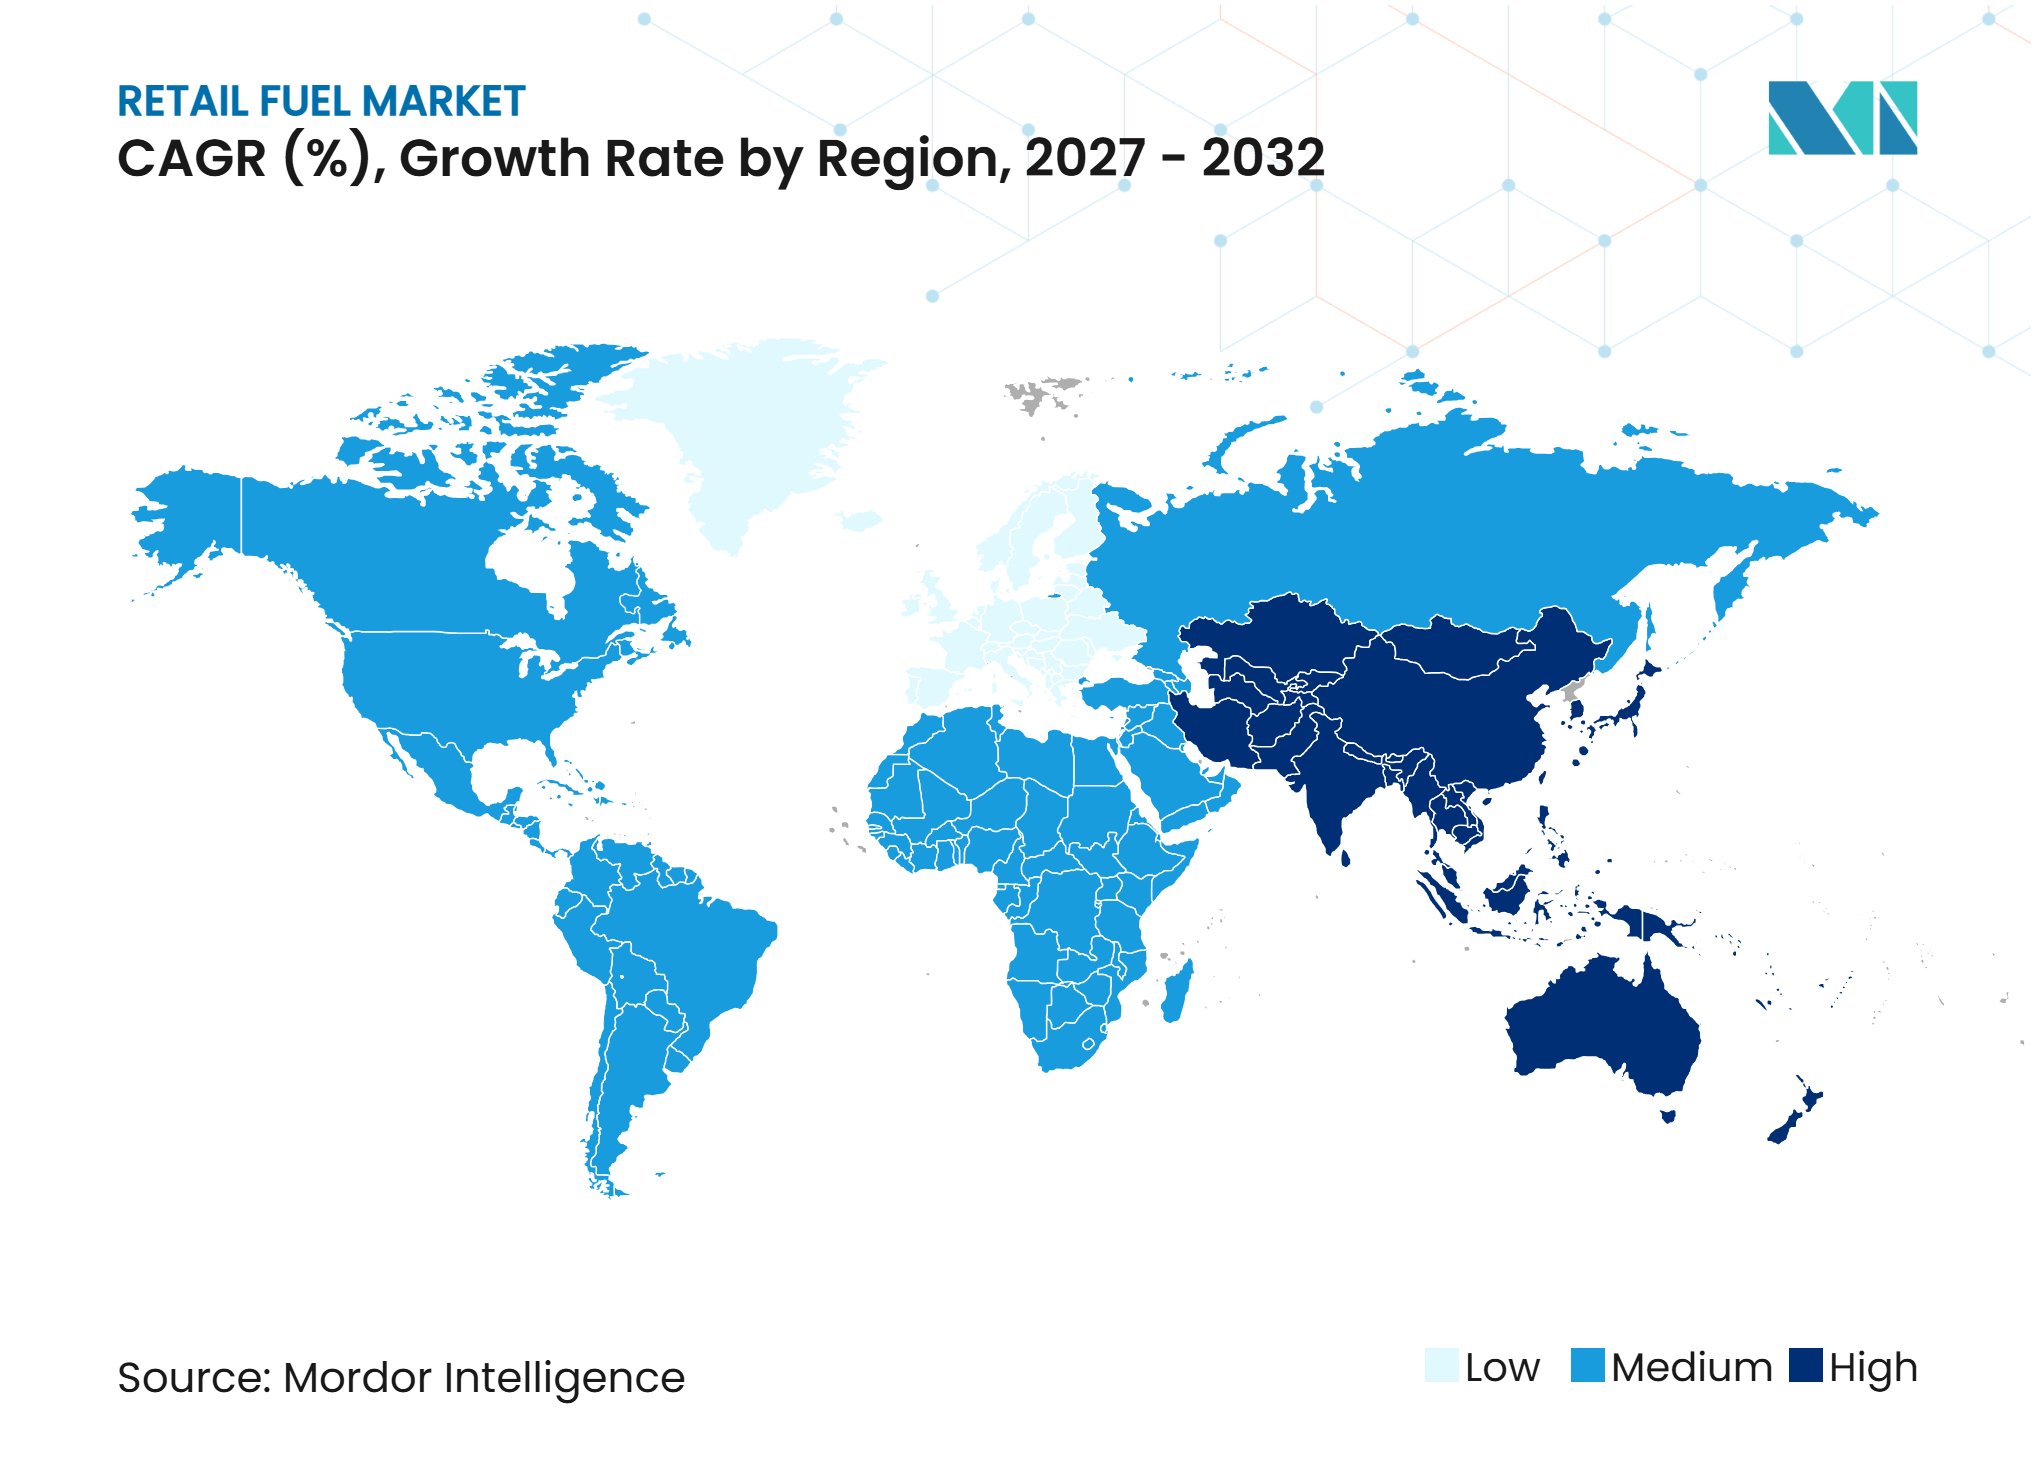
| Fastest Growing Market | Asia-Pacific |
| Largest Market | North America |
| Market Concentration | Low |
Major Players *Disclaimer: Major Players sorted in no particular order Image © Mordor Intelligence. Reuse requires attribution under CC BY 4.0. | |
Retail Fuel Market Analysis by Mordor Intelligence
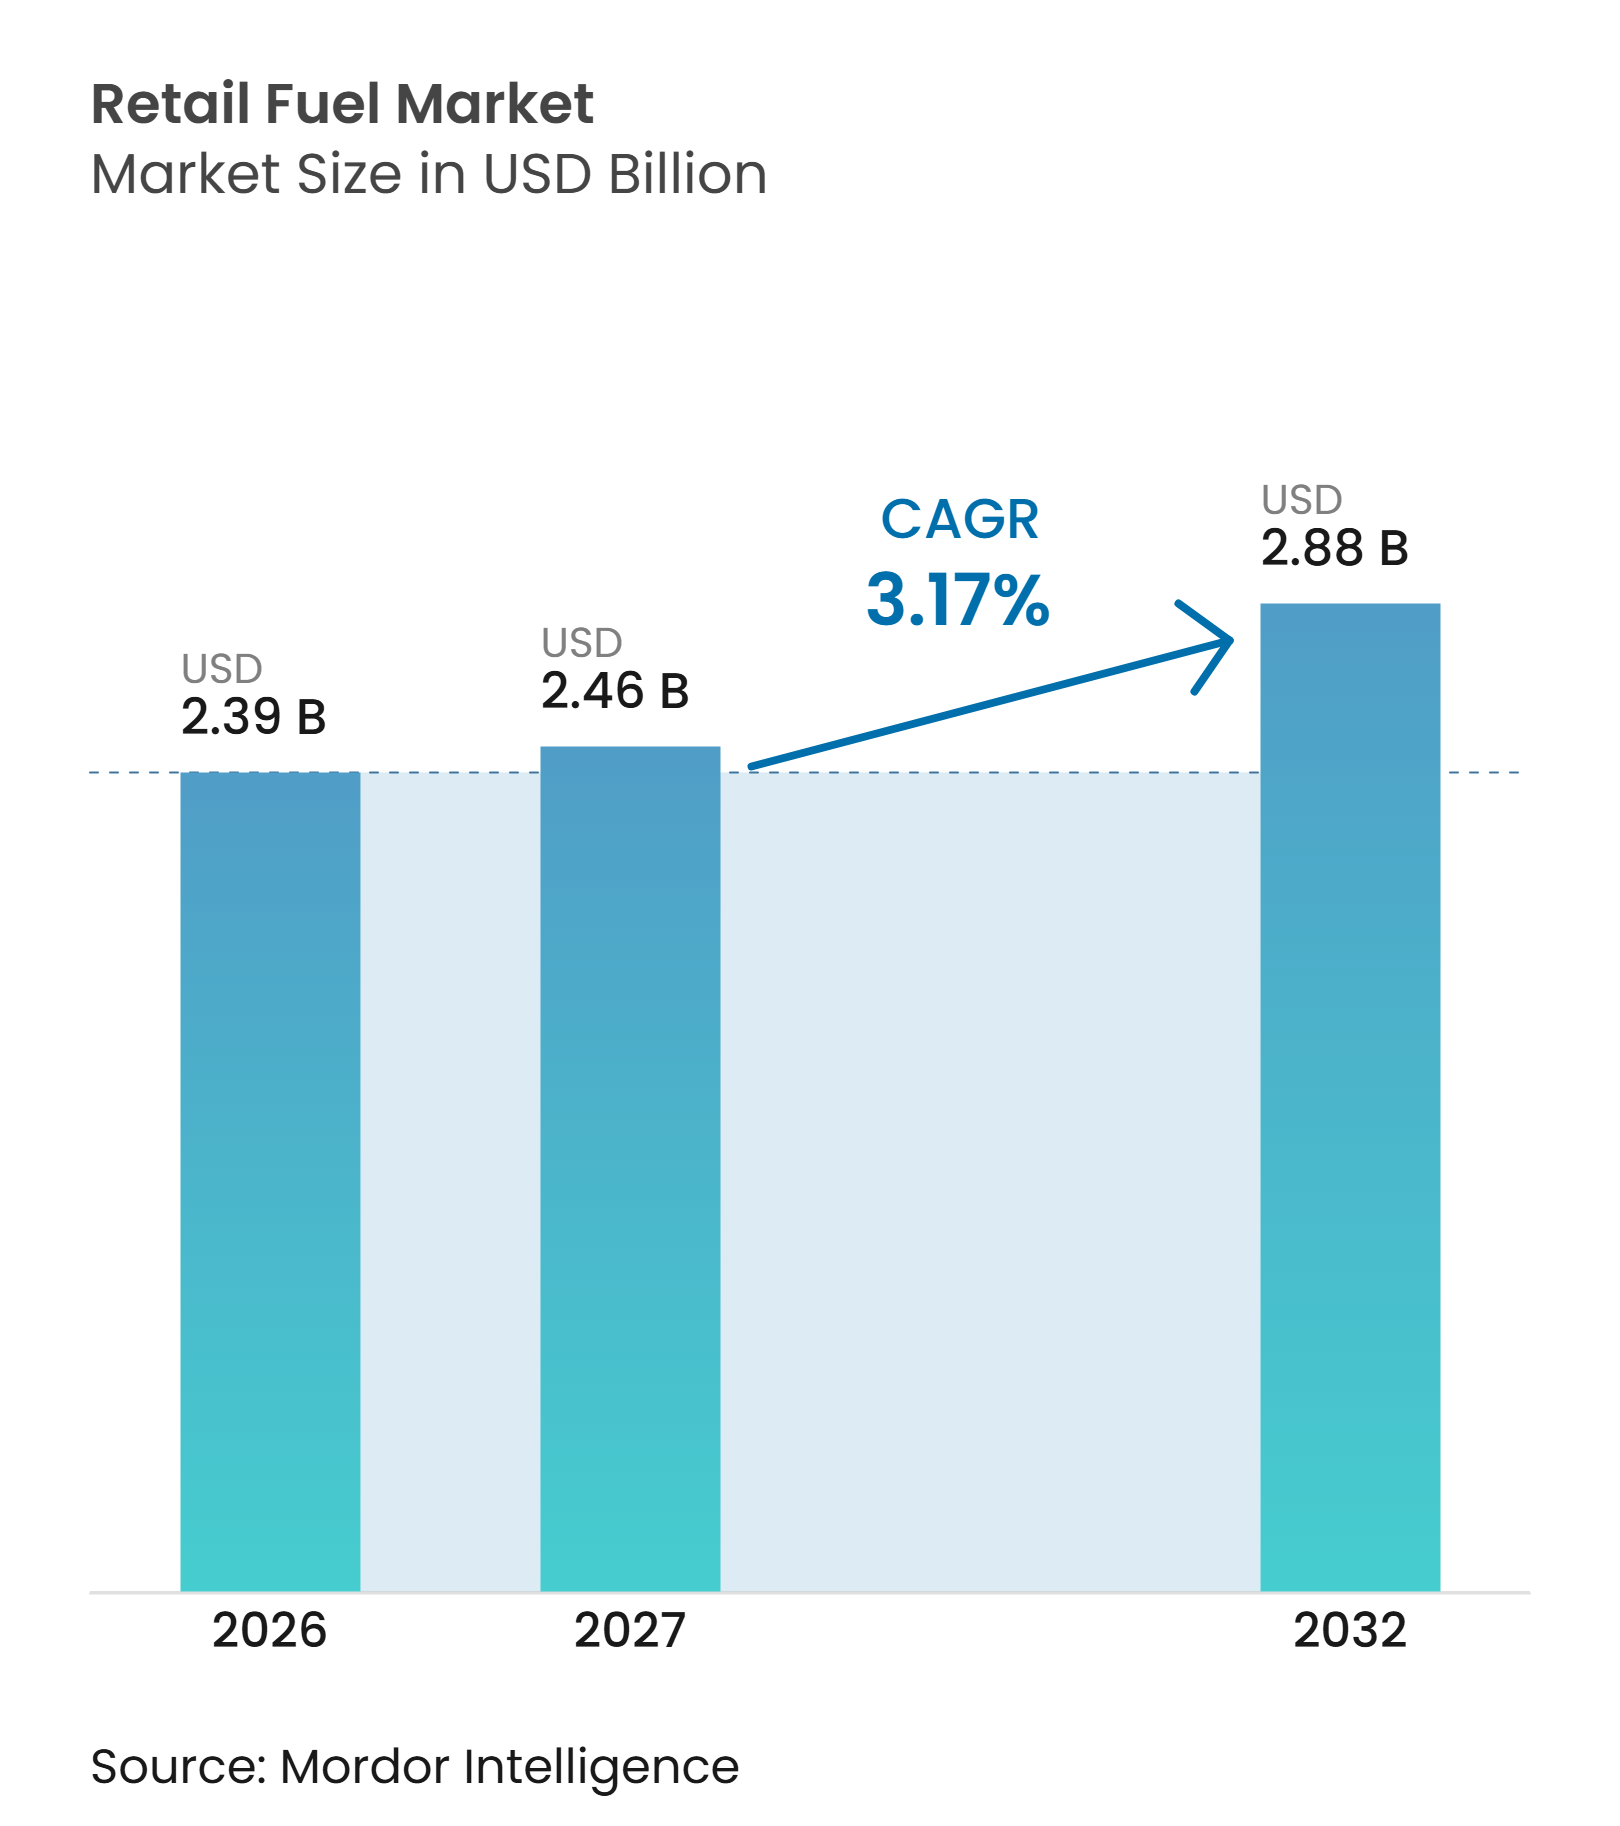
The global retail fuel market size is projected to grow from USD 2.39 trillion in 2026 to USD 2.88 trillion by 2032, registering a CAGR of 3.17% between 2027 and 2032. Growth is supported by resilient road transport demand, though improvements in vehicle efficiency, biofuel blending, and electric vehicle adoption are moderating fuel volumes in mature economies. Global oil demand for road transport rose by 0.65 million barrels per day in 2025, indicating that the demand shift is gradual rather than immediate.[1] The market is also moving toward higher revenue per visitor, as convenience retail, foodservice, digital loyalty programs, and charging services are becoming more important to station economics. This trend favors operators that can use well-located sites, customer data, and a broader retail offering to improve margins beyond fuel sales. The competitive landscape reflects two distinct approaches: some international oil companies are reducing underperforming sites, while national oil companies and convenience store operators are expanding selected networks.
Key Report Takeaways
-
By fuel type, petrol/gasoline held 44.7% of the retail fuel market share in 2026, while compressed natural gas (CNG) is projected to grow at a 5.3% CAGR through 2032.
-
By station type, urban fuel stations held 37.2% of the retail fuel market size in 2026 and are forecast to grow at a 3.8% CAGR through 2032.
-
By end user, individual consumers held 55.6% of the market in 2026, while fleet operators are projected to grow at a 3.5% CAGR through 2032.
-
By geography, North America held 33.2% of the retail fuel industry in 2026, while Asia-Pacific is projected to grow at a 3.7% CAGR through 2032.
Note: Market numbers in this report are based on Mordor Intelligence's proprietary estimation framework, which combines nine months of actuals with Q4 projections for base year 2026.
Market Trends and Insights
Drivers Impact Analysis of Retail Fuel Market*
| Driver | (~) % Impact on CAGR Forecast | Geographic Relevance | Impact Timeline |
|---|---|---|---|
| Emerging-Market Vehicle Fleet Expansion | +1.1% | Asia-Pacific core, spill-over to Middle East and Africa and South America | Medium term (2-4 years) |
| Freight and Logistics Activity Growth | +0.8% | Global, concentrated in North America, Europe, and Asia-Pacific | Short term (≤ 2 years) |
| Convenience Retail and Foodservice Monetization | +0.5% | North America, Europe, and urban Asia-Pacific | Medium term (2-4 years) |
| Alternative-Fuel and Biofuel Network Expansion | +0.4% | Europe and India, expanding to Asia-Pacific and Middle East and Africa | Medium term (2-4 years) |
| Digital Loyalty and Forecourt Automation | +0.2% | North America, Europe, and urban Asia-Pacific | Long term (≥ 4 years) |
| Underused Forecourt Real-Estate Monetization | +0.1% | Global, with the highest impact in high-density urban locations | Long term (≥ 4 years) |
| Source: Mordor Intelligence | |||
Emerging-Market Vehicle Fleet Expansion
South and Southeast Asia retain room for greater vehicle ownership, supporting a multiyear demand base for conventional fuels. Indian Oil Corporation recorded domestic petroleum product sales of 84.96 million metric tons in FY2024-25 and held a 41.52% domestic petroleum market share across more than 63,000 touchpoints.[2] The retail fuel market benefits from demand generated by two-wheelers, light commercial vehicles, and utility vehicles in urban and semi-urban areas. India had 8,154 CNG stations in May 2025, while the Petroleum and Natural Gas Regulatory Board had authorized 307 geographical areas for city gas network development. These developments favor rural and semi-urban independent stations, which may become relevant acquisition or network partners for consolidators. Larger operators can use local infrastructure to extend branded supply and service coverage without building every site from the ground up.
Freight and Logistics Activity Growth
Road freight remains a fuel-intensive transport mode, supporting diesel and CNG demand at highway stations and commercial truck stops. GAIL Gas reported CNG sales growth at a 36% CAGR across the 3 years through FY2025, while Adani Total Gas reported a 19% increase in CNG volume during FY2025. The retail fuel market benefits from logistics activity because fleet accounts provide predictable throughput even when consumer demand varies. WEX Incorporated and BP expanded the Earnify fleet card in 2025 to provide rebates across more than 8,000 stations under the BP, Amoco, TravelCenters of America, TA Express, and Petro brands. Alimentation Couche-Tard introduced Pro DIGITAL+ in Canada during June 2025 with instant digital issuance, real-time controls, and fuel discounts. Digital fleet programs convert occasional fueling into managed purchasing relationships and help operators plan volumes more reliably.
Convenience Retail and Foodservice Monetization
Convenience retail and foodservice can raise the value of visits in the retail fuel market, particularly when EV charging increases the time customers spend on-site. BP opened an EV-only charging and convenience hub at Cromwell Road in London during February 2025, with five 300 kW chargers, Marks and Spencer Food, and a Wildbean Cafe. Alimentation Couche-Tard opened an EV-only location in Gårda, Gothenburg, in May 2025, combining ten 400 kW chargers with a fresh-food convenience store. These formats demonstrate how charging sites can be designed around food and convenience purchases rather than liquid-fuel transactions. Digital loyalty programs and forecourt automation complement this model by enabling operators to recognize customers, tailor offers, and reduce routine transaction steps. High-density sites also present an opportunity to use available forecourt space for complementary retail when fuel demand alone does not justify the full site value.
Alternative-Fuel and Biofuel Network Expansion
Alternative fuels are becoming a commercial growth area in markets where policy mandates and fleet economics support supply. Repsol expanded its 100% renewable diesel network to more than 1,500 stations in Spain and Portugal by December 2025 and reported more than 210 million liters sold. India has rolled out E20 petrol nationally, and Bharat Petroleum Corporation Limited reported a 19.9% ethanol blending rate in FY2025-26 under the Ministry of Petroleum framework. The European Union's Alternative Fuels Infrastructure Regulation supports the rollout of alternative fuel infrastructure on the Trans-European Transport Network and creates a clear compliance framework for highway sites. China Petroleum and Chemical Corporation increased automotive natural gas sales by 37.1% during 2025, demonstrating that CNG retail is operating at scale within China's downstream network. The retail fuel market can therefore add volume and customer relevance when operators align network investments with local fuel mandates and fleet requirements.
Restraints Impact Analysis of Retail Fuel Market*
| Restraint | (~) % Impact on CAGR Forecast | Geographic Relevance | Impact Timeline |
|---|---|---|---|
| Electric-Vehicle Oil Displacement | -0.6% | Europe and China immediate, North America and Asia-Pacific medium term | Short term (≤ 2 years) |
| High Grid-Connection and Compliance Costs | -0.2% | North America and the European Union | Medium term (2-4 years) |
| Fuel-Price Volatility and Margin Compression | -0.4% | Global | Short term (≤ 2 years) |
| Low Utilization of Early Charging Assets | -0.1% | North America and Europe | Short term (≤ 2 years) |
| Source: Mordor Intelligence | |||
Electric-Vehicle Oil Displacement
Electric vehicle (EV) adoption represents a clear structural constraint on conventional fuel demand, particularly in markets with strong electrification policies. The International Energy Agency (IEA) projects that oil displacement from EVs will reach 5.4 million barrels per day by 2030 under stated policies. The retail fuel market faces the greatest exposure at urban gasoline sites in Europe and coastal US areas, where charging access and vehicle turnover are advancing at a faster pace. Operators that add charging infrastructure can use longer dwell times to generate in-store sales, while operators without a broader retail offering face pressure on both fuel volume and footfall. Grid-connection costs, utility upgrades, and compliance requirements can make this transition expensive in North America and the European Union. Early charging assets can also remain underutilized, making site selection and demand planning important considerations before committing capital.
Fuel-Price Volatility and Margin Compression
Crude price changes can compress retail fuel margins because pump prices cannot always be adjusted immediately without affecting customer traffic. US regular gasoline averaged USD 3.097 per gallon in 2025, while labor, utility, and card-processing costs continued to weigh on operators. China Petroleum and Chemical Corporation's marketing segment operating profit fell 46.5% year over year to USD 1.39 billion (CNY 10.0 billion) in 2025, partly due to crude-price-related inventory losses. Smaller stations lack the refinery integration or purchasing scale that can moderate these fluctuations. The retail fuel market may therefore see more branded supply agreements and consolidation among independent operators in the United States, Germany, and Southeast Asia. Such arrangements can provide greater supply stability, although they may also reduce the commercial independence of smaller owners.
*Our forecasts treat driver/restraint impacts as directional, not additive. The impact forecasts reflect baseline growth, mix effects, and variable interactions.
Retail Fuel Market Segment Analysis
By Fuel Type:
CNG Momentum Reshapes the Alternative-Fuel MixPetrol/gasoline held 44.7% of the retail fuel market share in 2026, reflecting the established role of private vehicles in both mature and emerging economies. U.S. motor gasoline consumption totaled 136.72 billion gallons in 2025 and represented 43% of total U.S. petroleum product consumption. Diesel remains important for commercial freight, while renewable diesel is beginning to change the category through branded dealer networks. LPG and ethanol blends also retain local importance, particularly where Brazil's ethanol policy and India's E20 rollout support demand. The retail fuel market continues to depend on a broad fuel mix because vehicle fleets, regulations, and fueling infrastructure differ sharply by region.
CNG is projected to expand at a 5.3% CAGR through 2032, making it the fastest-growing fuel category in the available segmentation data. Sinopec reported a 37.1% increase in automotive natural gas sales in 2025 even as its overall retail gasoline volume fell by 4%. This pattern indicates that commercial fleets are shifting part of their demand from diesel to CNG where cost and network access are favorable. Hydrogen remains at an early commercial stage, although Shell Oman opened its first hydrogen refueling station in 2025 and ExxonMobil's Strathcona renewable diesel facility began commercial operations in the same year. AFIR also provides a policy framework for CNG and hydrogen infrastructure across major European transport corridors.
By Station Type:
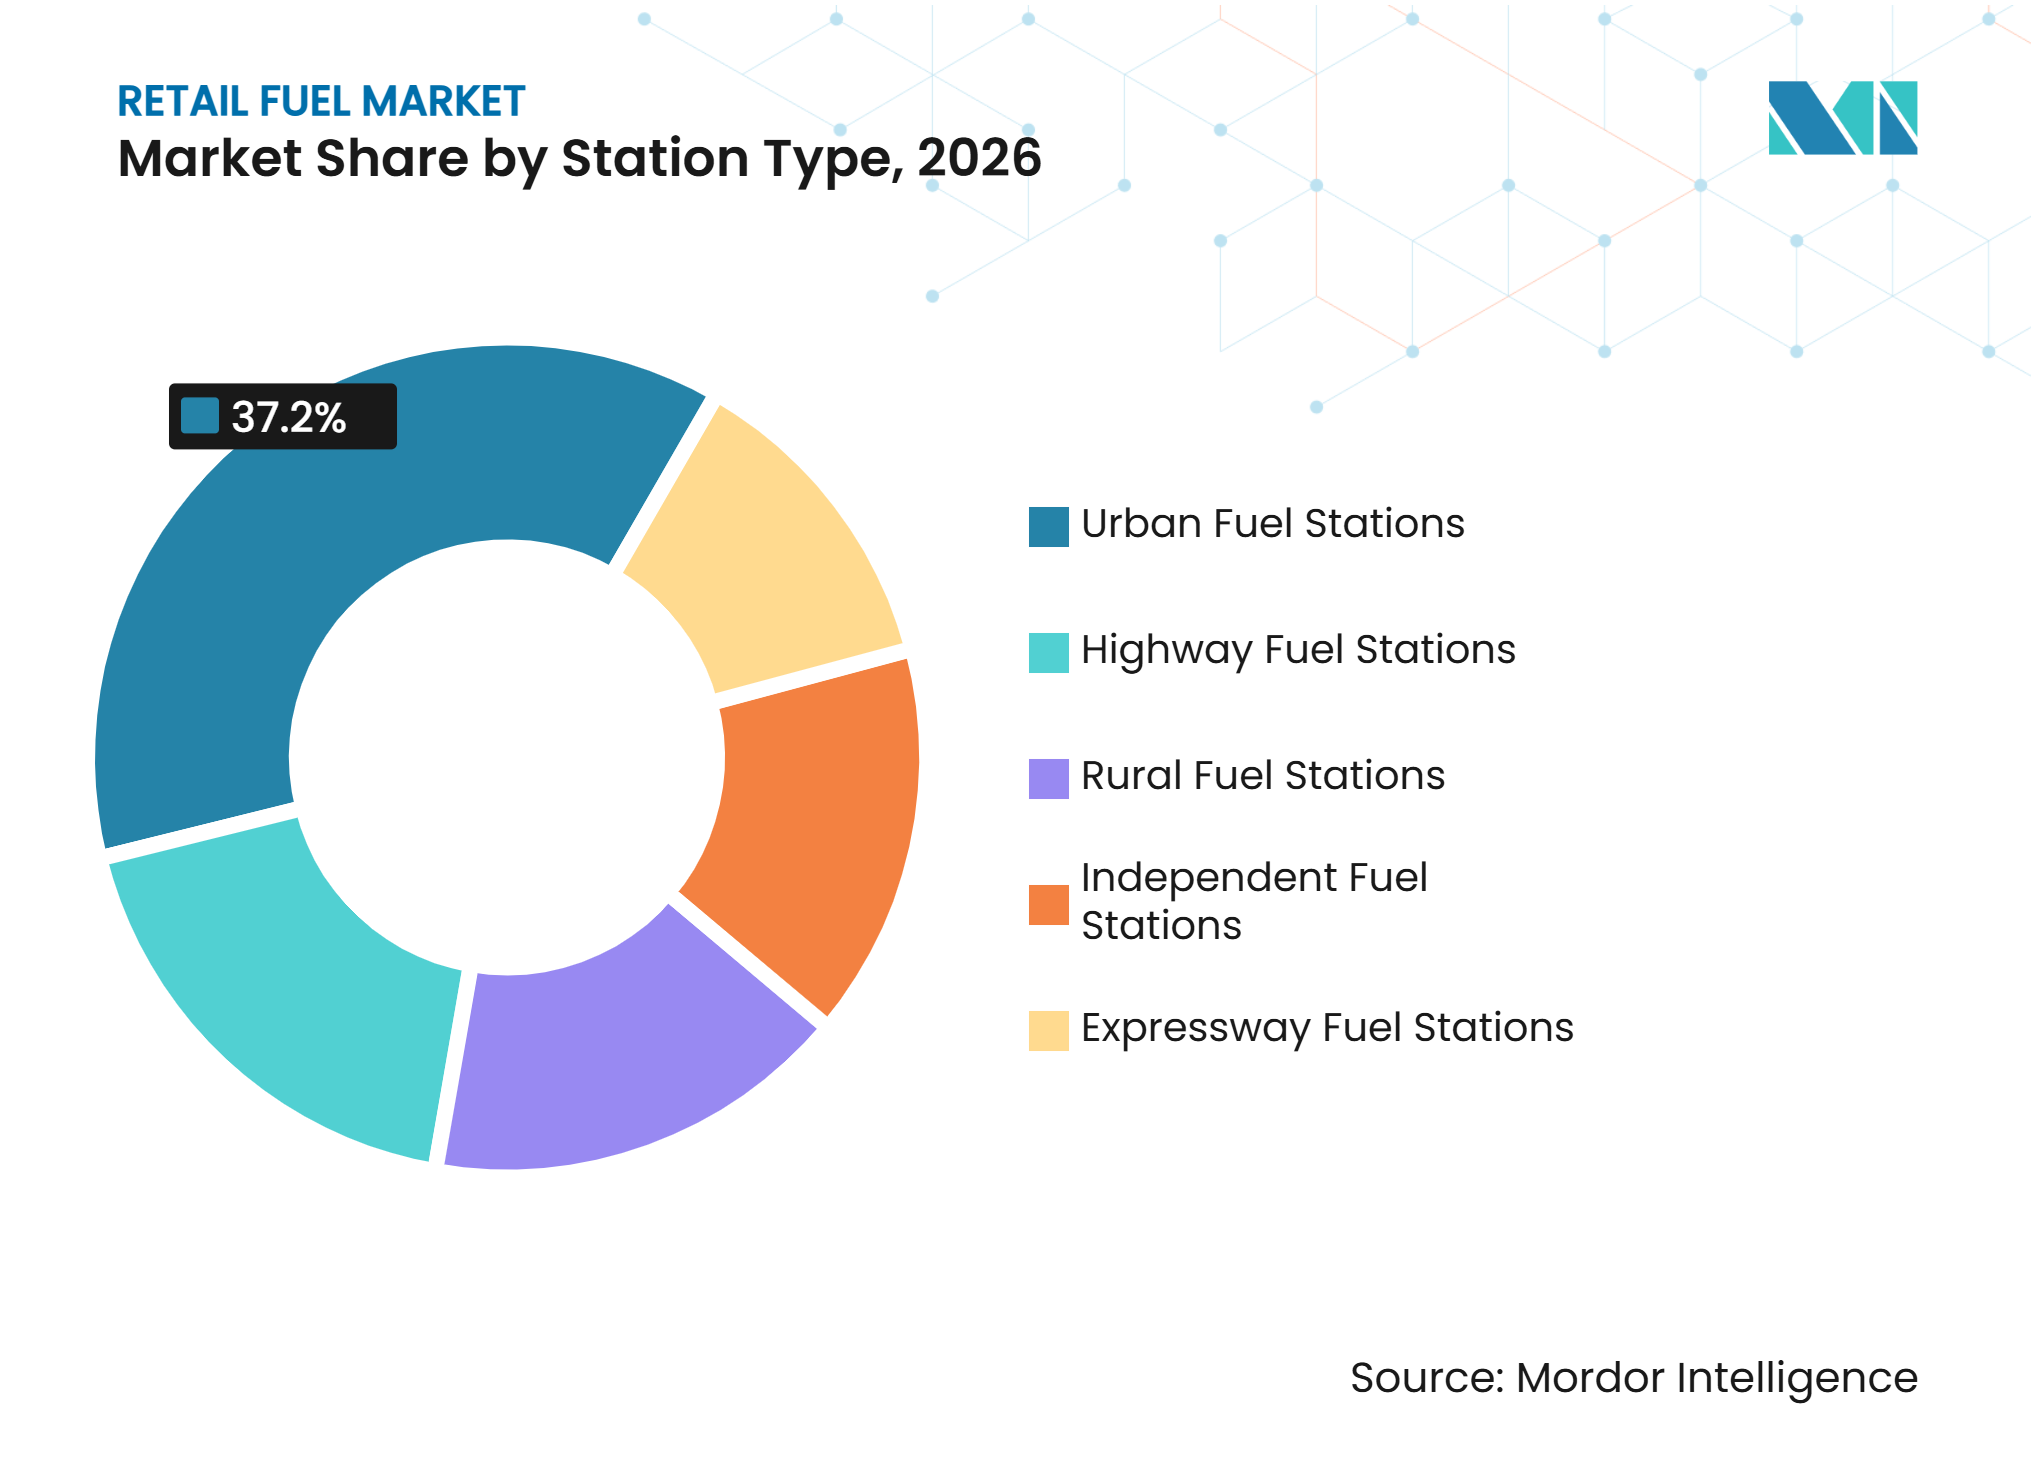
Urban Stations Lead Both Scale and GrowthUrban fuel stations held 37.2% of the retail fuel market size in 2026 and are projected to grow at a 3.8% CAGR through 2032. Their position reflects the advantages of dense catchment areas, higher footfall, and a stronger fit with convenience retail. PTT Oil and Retail Business Public Company Limited operated 2,413 PTT stations in Thailand that served more than 3.9 million customers each day through Café Amazon, Jiffy, and 7-Eleven offerings.[3] Repsol operated 3,253 stations in Spain and served 24 million customers through its Waylet loyalty platform, which had 9 million users. These networks demonstrate how urban locations can combine fuel transactions, food, convenience retail, and digital engagement.
Highway and expressway stations serve long-distance travelers and freight traffic, often generating higher throughput per site than urban formats. Independent stations face greater pressure because digital loyalty, charging, and foodservice require investment that may be difficult for single-site operators. Rural stations remain necessary access points in lower-density areas. Indian Oil Corporation and Bharat Petroleum Corporation Limited maintain major rural and semi-urban networks in India, where wider service coverage remains strategically important. Urban formats are increasingly being developed as retail destinations, while rural and independent formats are focused on reliable fueling throughput, prompting network owners to apply different investment models.



By End User:
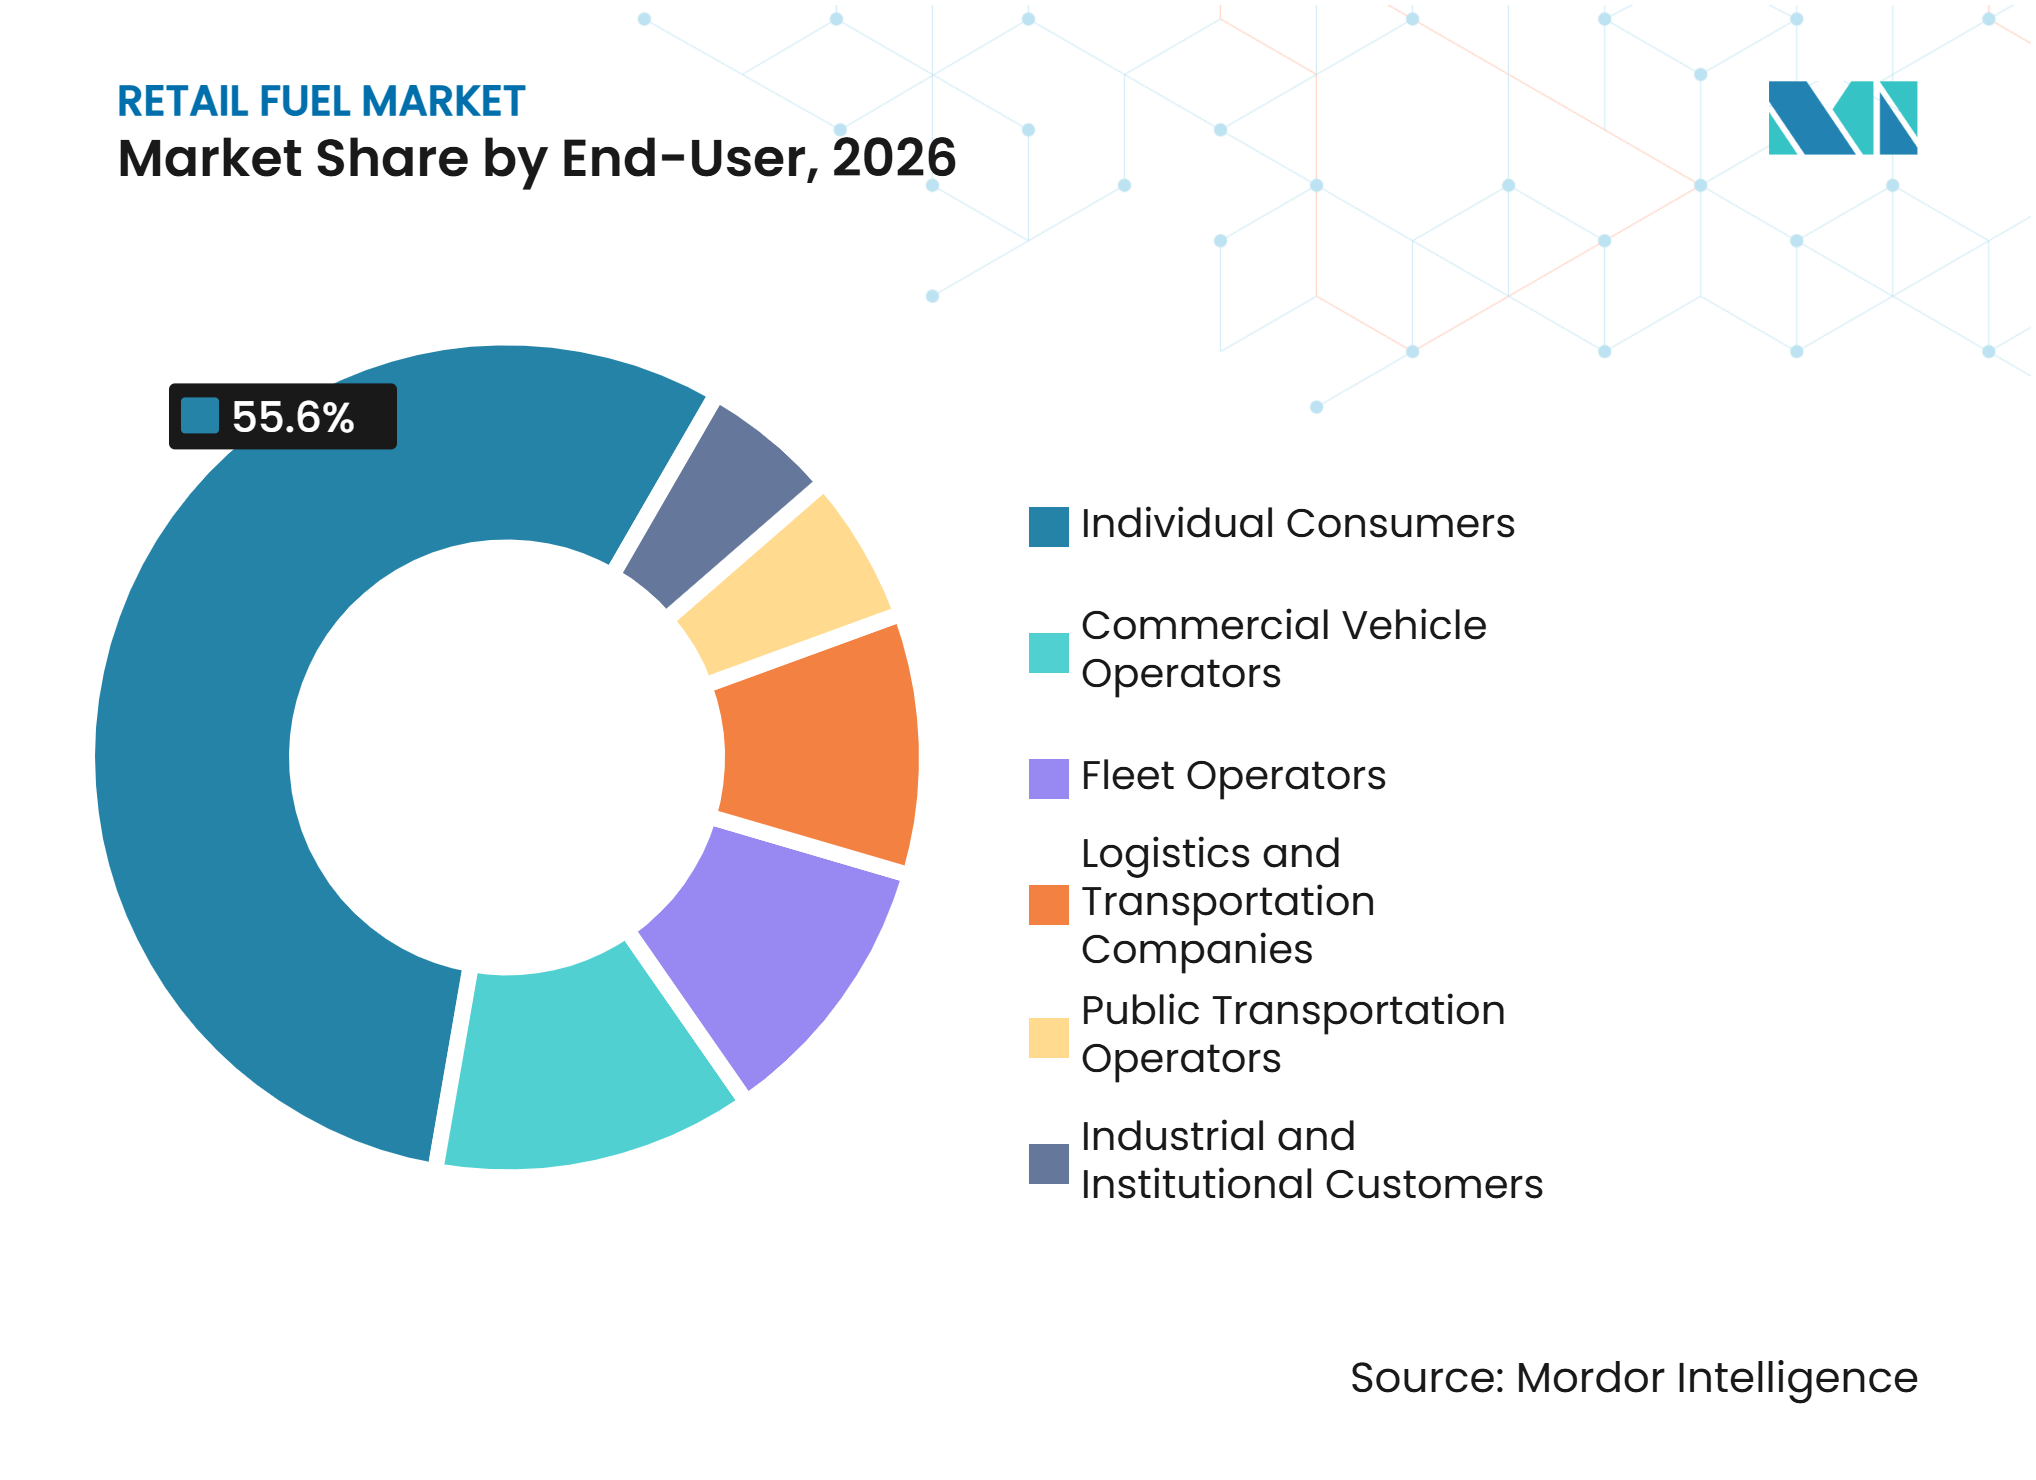
Fleet Operators Redefine the B2B PremiumIndividual consumers held 55.6% of the retail fuel industry in 2026, keeping personal mobility as the primary demand base across regions. Station cleanliness, digital programs, retail amenities, and consistent customer service can influence consumer preference alongside pump prices. Fleet operators are projected to grow at a 3.5% CAGR through 2032, supported by card programs and volume-commitment arrangements. Circle K offered a WEX-powered fleet card across more than 6,800 U.S. sites, while Indian Oil Corporation's TrucksUp program covered more than 40,000 outlets and provided 0.4% cashback. These programs support retention by simplifying fuel purchasing, payments, and account management for business customers.
Commercial vehicle operators, logistics firms, and transport businesses deliver high volumes, even when their per-liter margins are lower. These customers value predictable supply and are more likely to choose locations that offer fuel, AdBlue or diesel exhaust fluid, driver amenities, and food in a single stop. The retail fuel market uses these bundled services to improve the value of highway locations and capture demand from vehicles traveling beyond their normal routes. Public transportation operators are also moving toward CNG and renewable diesel where air-quality regulations affect municipal contracts. Industrial and institutional customers remain a smaller but potentially higher-margin group, particularly in Middle East and Africa industrial zones. This mix means the retail fuel market is becoming more differentiated by vehicle use, route pattern, and compliance requirements.

Geography Analysis
North America
North America held 33.2% of the market in 2026. U.S. motor gasoline consumption reached 136.72 billion gallons in 2025 at an average price of USD 3.097 per gallon, representing 43% of national petroleum product consumption. ExxonMobil had 18,533 retail fuel sites worldwide at year-end 2025, including 10,206 in the United States, operating through distributor and reseller arrangements rather than company-operated formats. Circle K operated 9,217 North American stores, including 8,202 with fuel, and sold 42 million gallons per day. Fleet cards and convenience retail are strengthening the commercial role of these sites in the North American retail fuel market, while Circle K's Pro DIGITAL+ card in Canada and Mexico's vehicle growth are driving urbanization-led changes in station formats.
Asia-Pacific
Asia-Pacific is projected to grow at a 3.7% CAGR through 2032. India's three public sector oil marketing companies operated more than 87,000 outlets in FY2024-25, including 40,221 for Indian Oil, 25,323 for Bharat Petroleum Corporation Limited, and 23,747 for Hindustan Petroleum Corporation Limited. India's ethanol blending program and compressed natural gas (CNG) expansion support the retail fuel market as vehicle ownership and freight activity increase. China's gasoline and diesel demand was largely unchanged in 2025; however, Sinopec operated 31,195 stations and PetroChina operated 22,127 stations, both with growing multi-energy infrastructure. PetroChina established 1,525 integrated energy stations and added 37,600 electric vehicle (EV) charging guns during 2025. Saudi Aramco's acquisition of a 25% stake in Unioil, which operates more than 175 Philippine stations, reflects confidence in Southeast Asian demand.[4]
Europe, South America, and Middle East and Africa
Europe is shifting from volume-led fueling toward value-led sites that include charging and lower-carbon fuels. Shell reduced its branded network by 800 sites in 2025 while increasing owned EV charge points by more than 20% to 88,000. Eni operated 5,294 European stations and recorded 7.81 million tonnes of retail petroleum product sales in 2025. Repsol's renewable diesel network illustrates how regulatory influence and alternative-fuel investment can become a commercial advantage in the European retail fuel market. South America remains shaped by Brazil's ethanol mandate and Argentina's price deregulation, while Middle East and Africa markets are more often influenced by national oil company pricing and network ownership, including Saudi Aramco's 18,000 global service stations through affiliates.
Competitive Landscape
Market Concentration
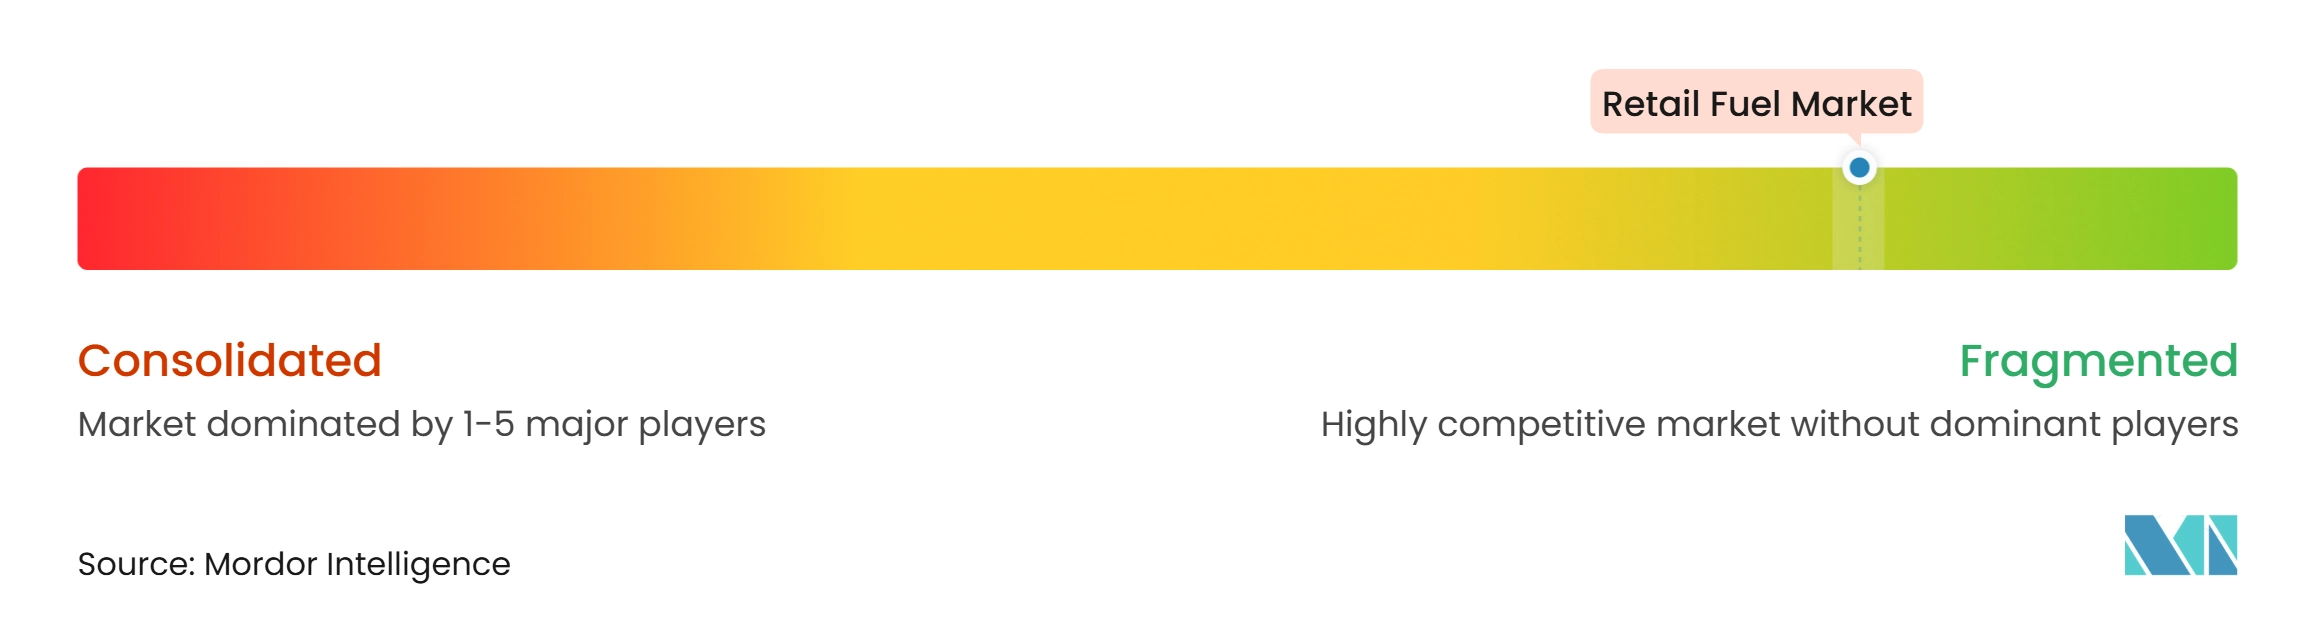
The retail fuel market is fragmented at the individual-station level, but brand ownership, supply arrangements, and customer data are becoming more concentrated. Shell had 47,000 retail fuel and convenience sites and 33 million daily customers at year-end 2025. During 2025, the company closed or sold 800 lower-performing branded sites while adding charging infrastructure. BP exited 5% of its company-owned retail sites in 2025 and focused charging investment on Germany, the United Kingdom, China, and the United States. These actions reflect a shift from network volume toward sites with stronger retail and energy-service potential.
National oil companies are taking a different approach by expanding their networks and using scale to strengthen consumer access. Indian Oil held a 41.52% domestic petroleum market share and operated 40,221 outlets as of March 2025. Sinopec operated 31,195 branded service stations at the end of 2025, while PetroChina expanded its multi-energy offering through integrated energy stations, liquefied natural gas (LNG) locations, and charging infrastructure. These companies benefit from large domestic networks, fuel mandates, and established supply systems. Their position in the retail fuel market makes it difficult for smaller operators to match their coverage and capital investment.
Convenience store specialists occupy the space between pure fuel retailing and grocery retail. Circle K operated 17,000 stores globally, while 7-Eleven's wider network exceeded 83,000 stores across 17 countries. PTT Oil and Retail Business Public Company Limited combines fuel sites with coffee, convenience retail, and charging, while Repsol uses its Waylet platform to connect 9 million users with its retail network. Independent and branded-dealer sites that cannot fund digital inventory management or charging investment remain likely candidates for acquisition or franchise agreements.
Retail Fuel Industry Leaders
-
Shell plc
-
China Petroleum & Chemical Corporation (Sinopec)
-
Indian Oil Corporation Limited
-
PetroChina Company Limited
-
Alimentation Couche-Tard Inc. (Circle K)
- *Disclaimer: Major Players sorted in no particular order
Retail Fuel Market Companies Covered in this Report
- 7-Eleven, Inc.
- Alimentation Couche-Tard Inc. (Circle K)
- Bharat Petroleum Corporation Limited (BPCL)
- BP p.l.c.
- Chevron Corporation
- China Petroleum & Chemical Corporation (Sinopec)
- Eni S.p.A.
- Exxon Mobil Corporation
- Hindustan Petroleum Corporation Limited (HPCL)
- Indian Oil Corporation Limited
- Marathon Petroleum Corporation
- PetroChina Company Limited
- Petronas
- Phillips 66
- PTT Public Company Limited
- Repsol S.A.
- Saudi Aramco
- Shell plc
- TotalEnergies SE
- Valero Energy Corporation
Recent Industry Developments in Retail Fuel Market
- March 2026: Sinopec expanded its branded service station count to 31,195 by end-2025, while automotive natural gas sales surged 37.1% year over year, confirming CNG as its fastest-growing fuel retail category despite a 4% overall decline in retail gasoline volumes.
- March 2026: PetroChina established 1,525 integrated energy stations and 450 LNG refueling stations in 2025, adding 37,600 EV charging guns, representing one of the largest single-year multi-fuel infrastructure expansions globally.
- March 2026: Shell plc sold or closed approximately 800 underperforming branded retail fuel and convenience sites during 2025 as part of its portfolio optimization strategy, aimed at improving cash flow and long-term profitability. These divestments were aligned with Shell's previously announced plan to dispose of 1,000 retail sites globally by 2026 and included transactions involving approximately 200 sites in Indonesia and 217 sites in Mexico.
- March 2026: BP exited 5% of its company-owned retail sites in 2025, with a target of 10% by 2027. The company also agreed to sell a 65% stake in Castrol, completed the sale of its Netherlands mobility and convenience business, and concentrated its EV charging investment in Germany, the UK, China, and the United States.
Global Retail Fuel Market Report Scope
Retail fuel refers to the commercial sale of refined petroleum products such as gasoline, diesel, and alternative fuels directly to individual consumers and commercial fleets for immediate vehicular use. This distribution network operates primarily through public service stations, convenience stores, and dedicated commercial cardlock locations. Unlike wholesale transactions that involve bulk terminal distribution, the retail market is characterized by smaller-volume sales priced on a per-gallon or per-liter basis.
The global retail fuel market is segmented by fuel type, station type, end user, and geography. By fuel type, the market is segmented into petrol/gasoline, diesel, compressed natural gas (CNG), liquefied petroleum gas (LPG), biofuels and ethanol blends, renewable diesel, hydrogen, and other alternative fuels. By station type, the market is segmented into expressway fuel stations, highway fuel stations, independent fuel stations, rural fuel stations, and urban fuel stations. By end user, the market is segmented into commercial vehicle operators, fleet operators, individual consumers, industrial and institutional customers, logistics and transportation companies, and public transportation operators. The report also covers the market size and forecasts for the global retail fuel market across 25 countries in key regions. For each segment, the market sizing and forecasts are provided on the basis of value (USD).
Segmentation Overview
| Petrol/Gasoline |
| Diesel |
| Compressed Natural Gas (CNG) |
| Liquefied Petroleum Gas (LPG) |
| Biofuels and Ethanol Blends |
| Renewable Diesel |
| Hydrogen |
| Other Alternative Fuels |
| Expressway Fuel Stations |
| Highway Fuel Stations |
| Independent Fuel Stations |
| Rural Fuel Stations |
| Urban Fuel Stations |
| Commercial Vehicle Operators |
| Fleet Operators |
| Individual Consumers |
| Industrial and Institutional Customers |
| Logistics and Transportation Companies |
| Public Transportation Operators |
| North America | United States |
| Canada | |
| Mexico | |
| Europe | Germany |
| France | |
| Italy | |
| Spain | |
| United Kingdom | |
| Norway | |
| Netherlands | |
| Russia | |
| Rest of Europe | |
| Asia-Pacific | China |
| India | |
| Australia | |
| Indonesia | |
| Vietnam | |
| Thailand | |
| Rest of Asia-Pacific | |
| South America | Brazil |
| Argentina | |
| Chile | |
| Rest of South America | |
| Middle East and Africa | Saudi Arabia |
| United Arab Emirates | |
| Egypt | |
| Nigeria | |
| Oman | |
| Rest of Middle East and Africa |
| By Fuel Type | Petrol/Gasoline | |
| Diesel | ||
| Compressed Natural Gas (CNG) | ||
| Liquefied Petroleum Gas (LPG) | ||
| Biofuels and Ethanol Blends | ||
| Renewable Diesel | ||
| Hydrogen | ||
| Other Alternative Fuels | ||
| By Station Type | Expressway Fuel Stations | |
| Highway Fuel Stations | ||
| Independent Fuel Stations | ||
| Rural Fuel Stations | ||
| Urban Fuel Stations | ||
| By End User | Commercial Vehicle Operators | |
| Fleet Operators | ||
| Individual Consumers | ||
| Industrial and Institutional Customers | ||
| Logistics and Transportation Companies | ||
| Public Transportation Operators | ||
| By Geography | North America | United States |
| Canada | ||
| Mexico | ||
| Europe | Germany | |
| France | ||
| Italy | ||
| Spain | ||
| United Kingdom | ||
| Norway | ||
| Netherlands | ||
| Russia | ||
| Rest of Europe | ||
| Asia-Pacific | China | |
| India | ||
| Australia | ||
| Indonesia | ||
| Vietnam | ||
| Thailand | ||
| Rest of Asia-Pacific | ||
| South America | Brazil | |
| Argentina | ||
| Chile | ||
| Rest of South America | ||
| Middle East and Africa | Saudi Arabia | |
| United Arab Emirates | ||
| Egypt | ||
| Nigeria | ||
| Oman | ||
| Rest of Middle East and Africa | ||
Key Questions Answered in the Report
What is the projected value of the retail fuel market by 2032?
The retail fuel market is projected to reach USD 2.88 trillion by 2032, growing at a CAGR of 3.17% from 2027.
Which fuel type is growing fastest in retail fuel networks?
Compressed natural gas (CNG) is projected to grow at a CAGR of 5.3% through 2032, supported by logistics economics and network expansion.
Why are urban fuel stations growing faster than other station formats?
Urban stations are forecast to grow at a CAGR of 3.8%, driven by dense traffic, convenience retail, foodservice, and digital loyalty programs.
How do electric vehicles affect fuel retailers?
Electric vehicles reduce conventional fuel demand; however, charging infrastructure can generate longer customer visits and support food and convenience sales.
Which region will grow fastest through 2032?
Asia-Pacific is projected to grow at a CAGR of 3.7%, supported by increasing motorization, freight demand, compressed natural gas network expansion, and large national fuel networks.
How are fuel retailers improving margins beyond fuel sales?
Operators are expanding into foodservice, convenience retail, loyalty programs, fleet cards, charging infrastructure, and alternative fuels to increase revenue per visit.