
Oil and Gas Pipeline Services Market Size and Share
Market Overview
| Study Period | 2022 - 2032 |
|---|---|
| Market Size (2027) | USD 29.92 Billion |
| Market Size (2032) | USD 41.78 Billion |
| Growth Rate (2027 - 2032) | 6.91 % |
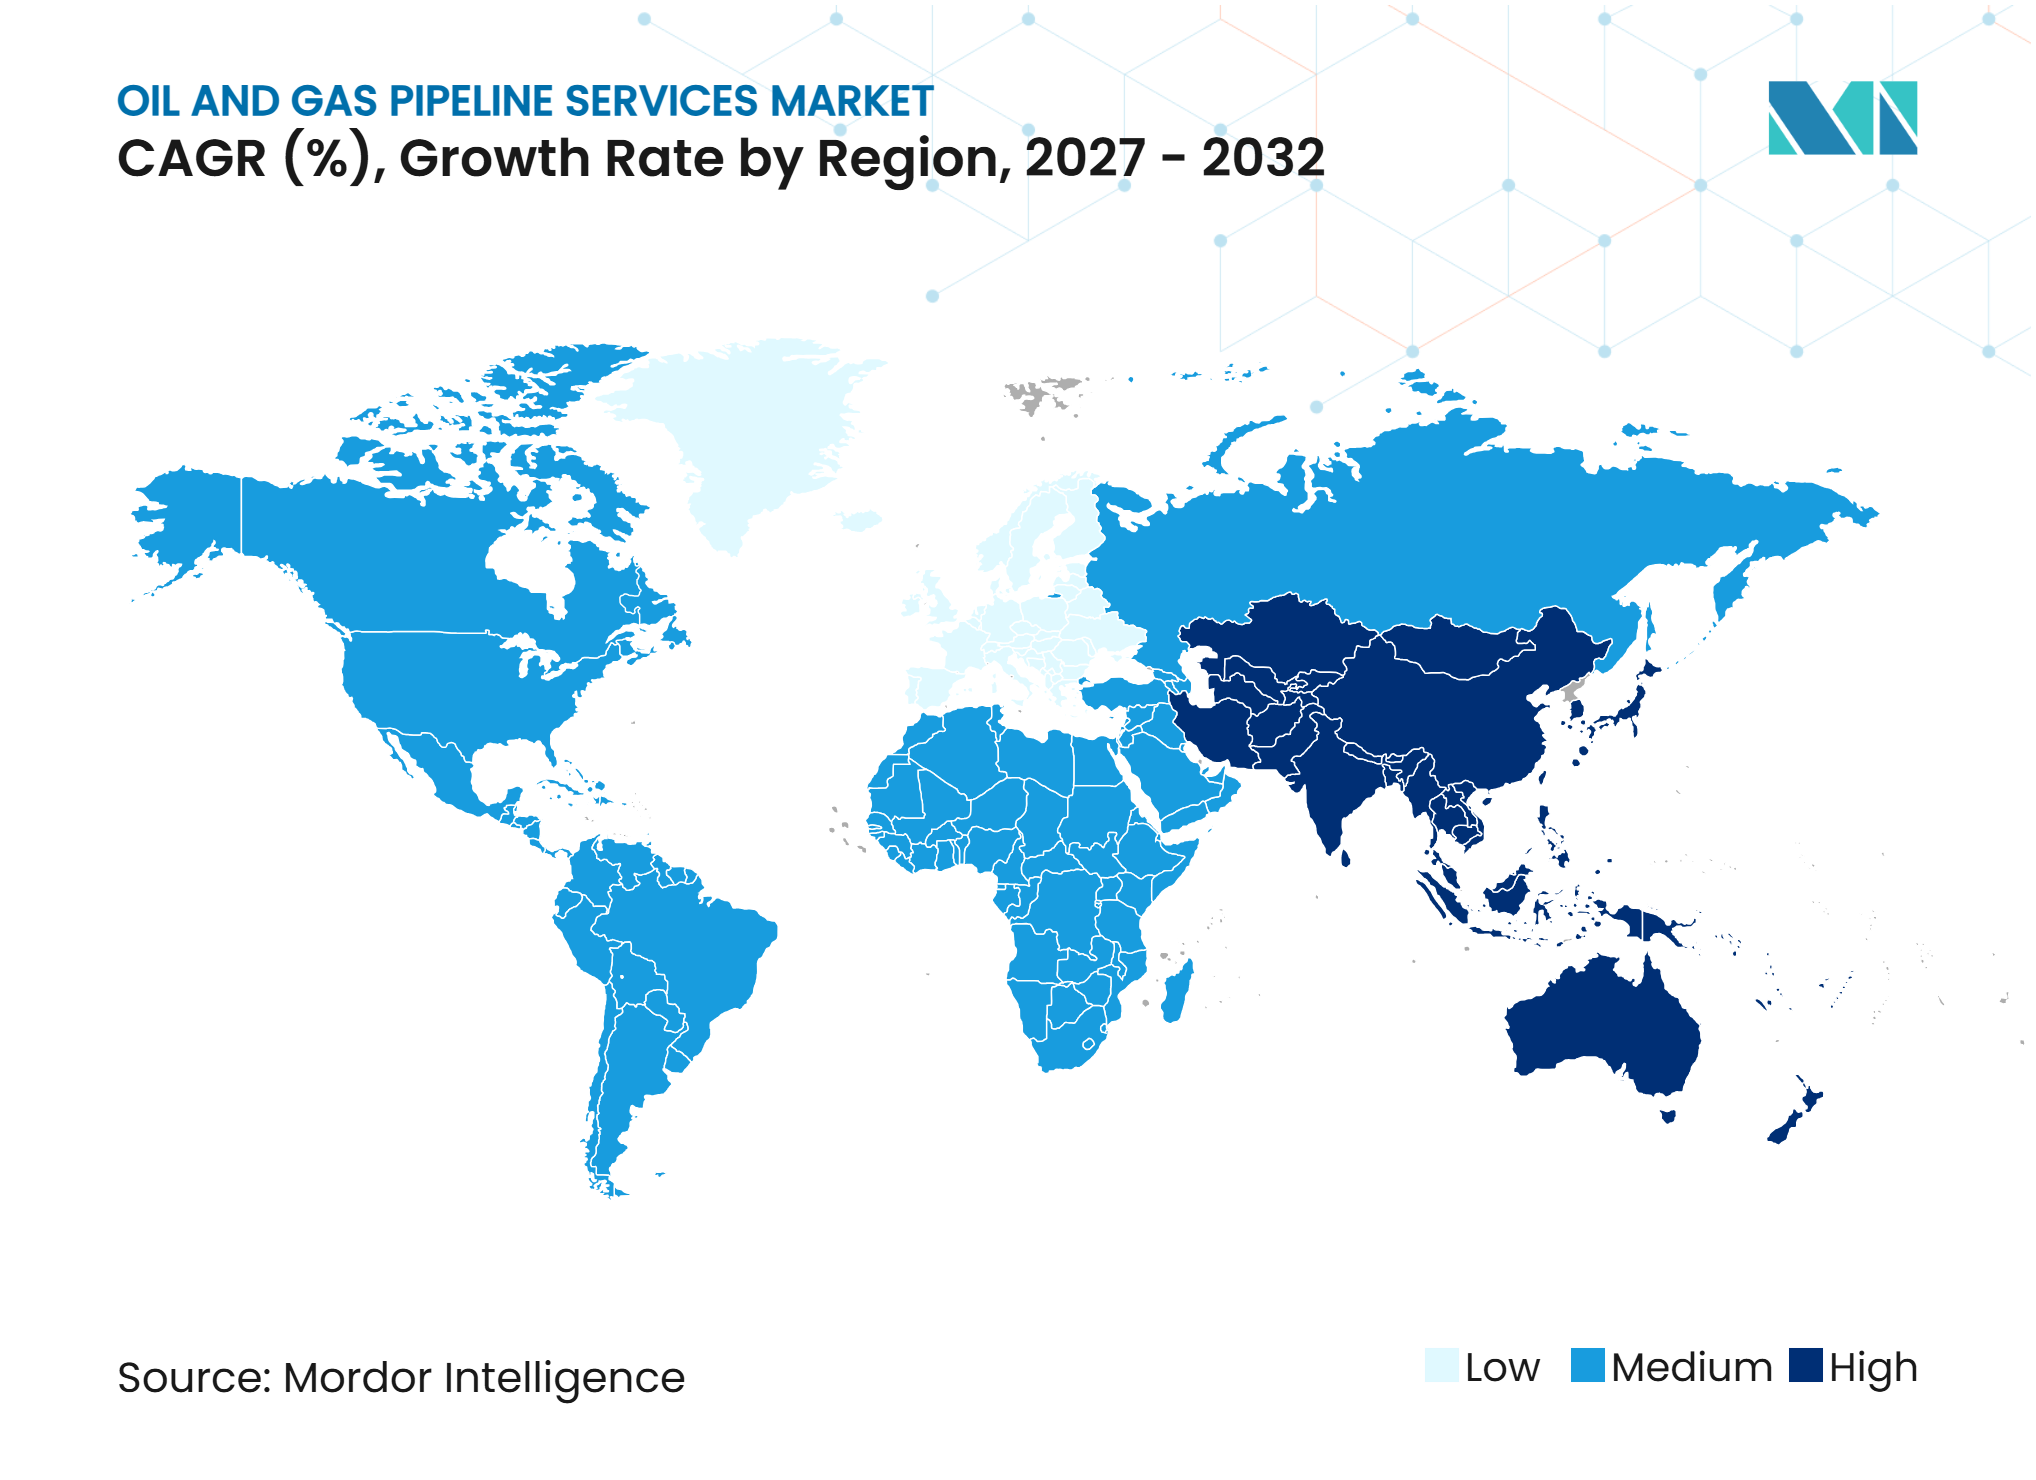
| Fastest Growing Market | Asia-Pacific |
| Largest Market | North America |
| Market Concentration | Low |
Major Players *Disclaimer: Major Players sorted in no particular order Image © Mordor Intelligence. Reuse requires attribution under CC BY 4.0. | |
Oil and Gas Pipeline Services Market Analysis by Mordor Intelligence
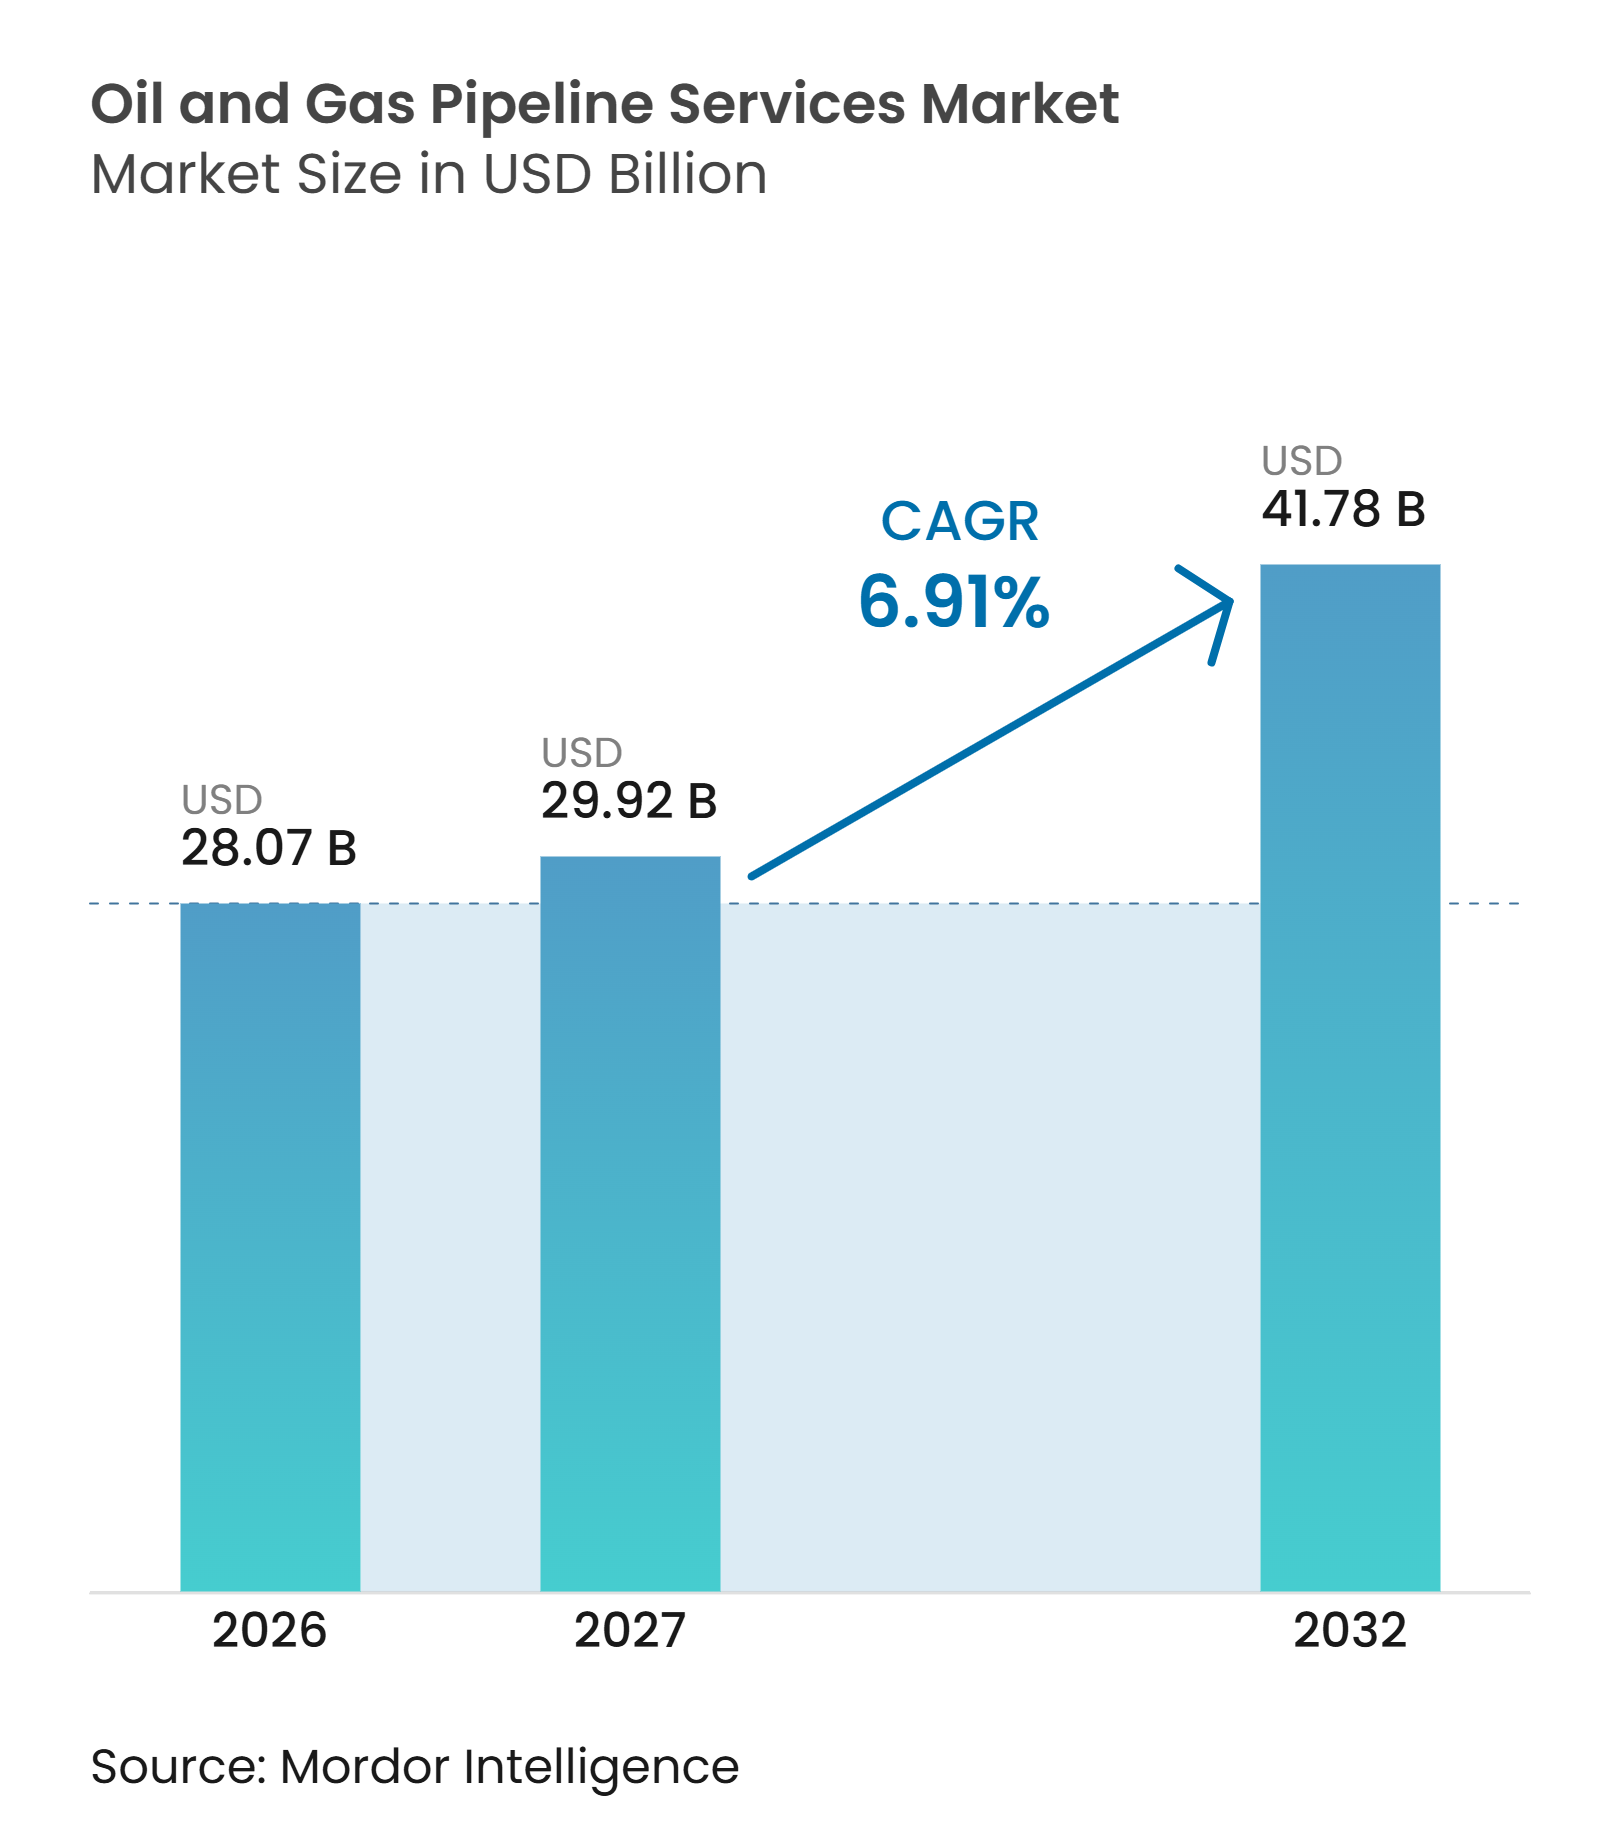
The oil and gas pipeline services market was valued at USD 28.07 billion in 2026 and is estimated to grow from USD 29.92 billion in 2027 to USD 41.78 billion by 2032, at a CAGR of 6.91% during the forecast period (2027-2032). The market is supported by maintenance requirements on aging pipeline networks and the expansion of gas transmission capacity linked to LNG facilities. Operators are directing spending toward integrity programs that extend asset life while meeting inspection and leak detection requirements. This creates opportunities for service providers that can combine inspection, repairs, data management, and commissioning work under longer-term contracts. New transmission projects also generate demand prior to operations, including cleaning, testing, drying, and baseline inspection. The market remains exposed to delayed maintenance budgets when commodity prices weaken, although safety and integrity obligations limit the scope for long-term deferrals.
Key Report Takeaways
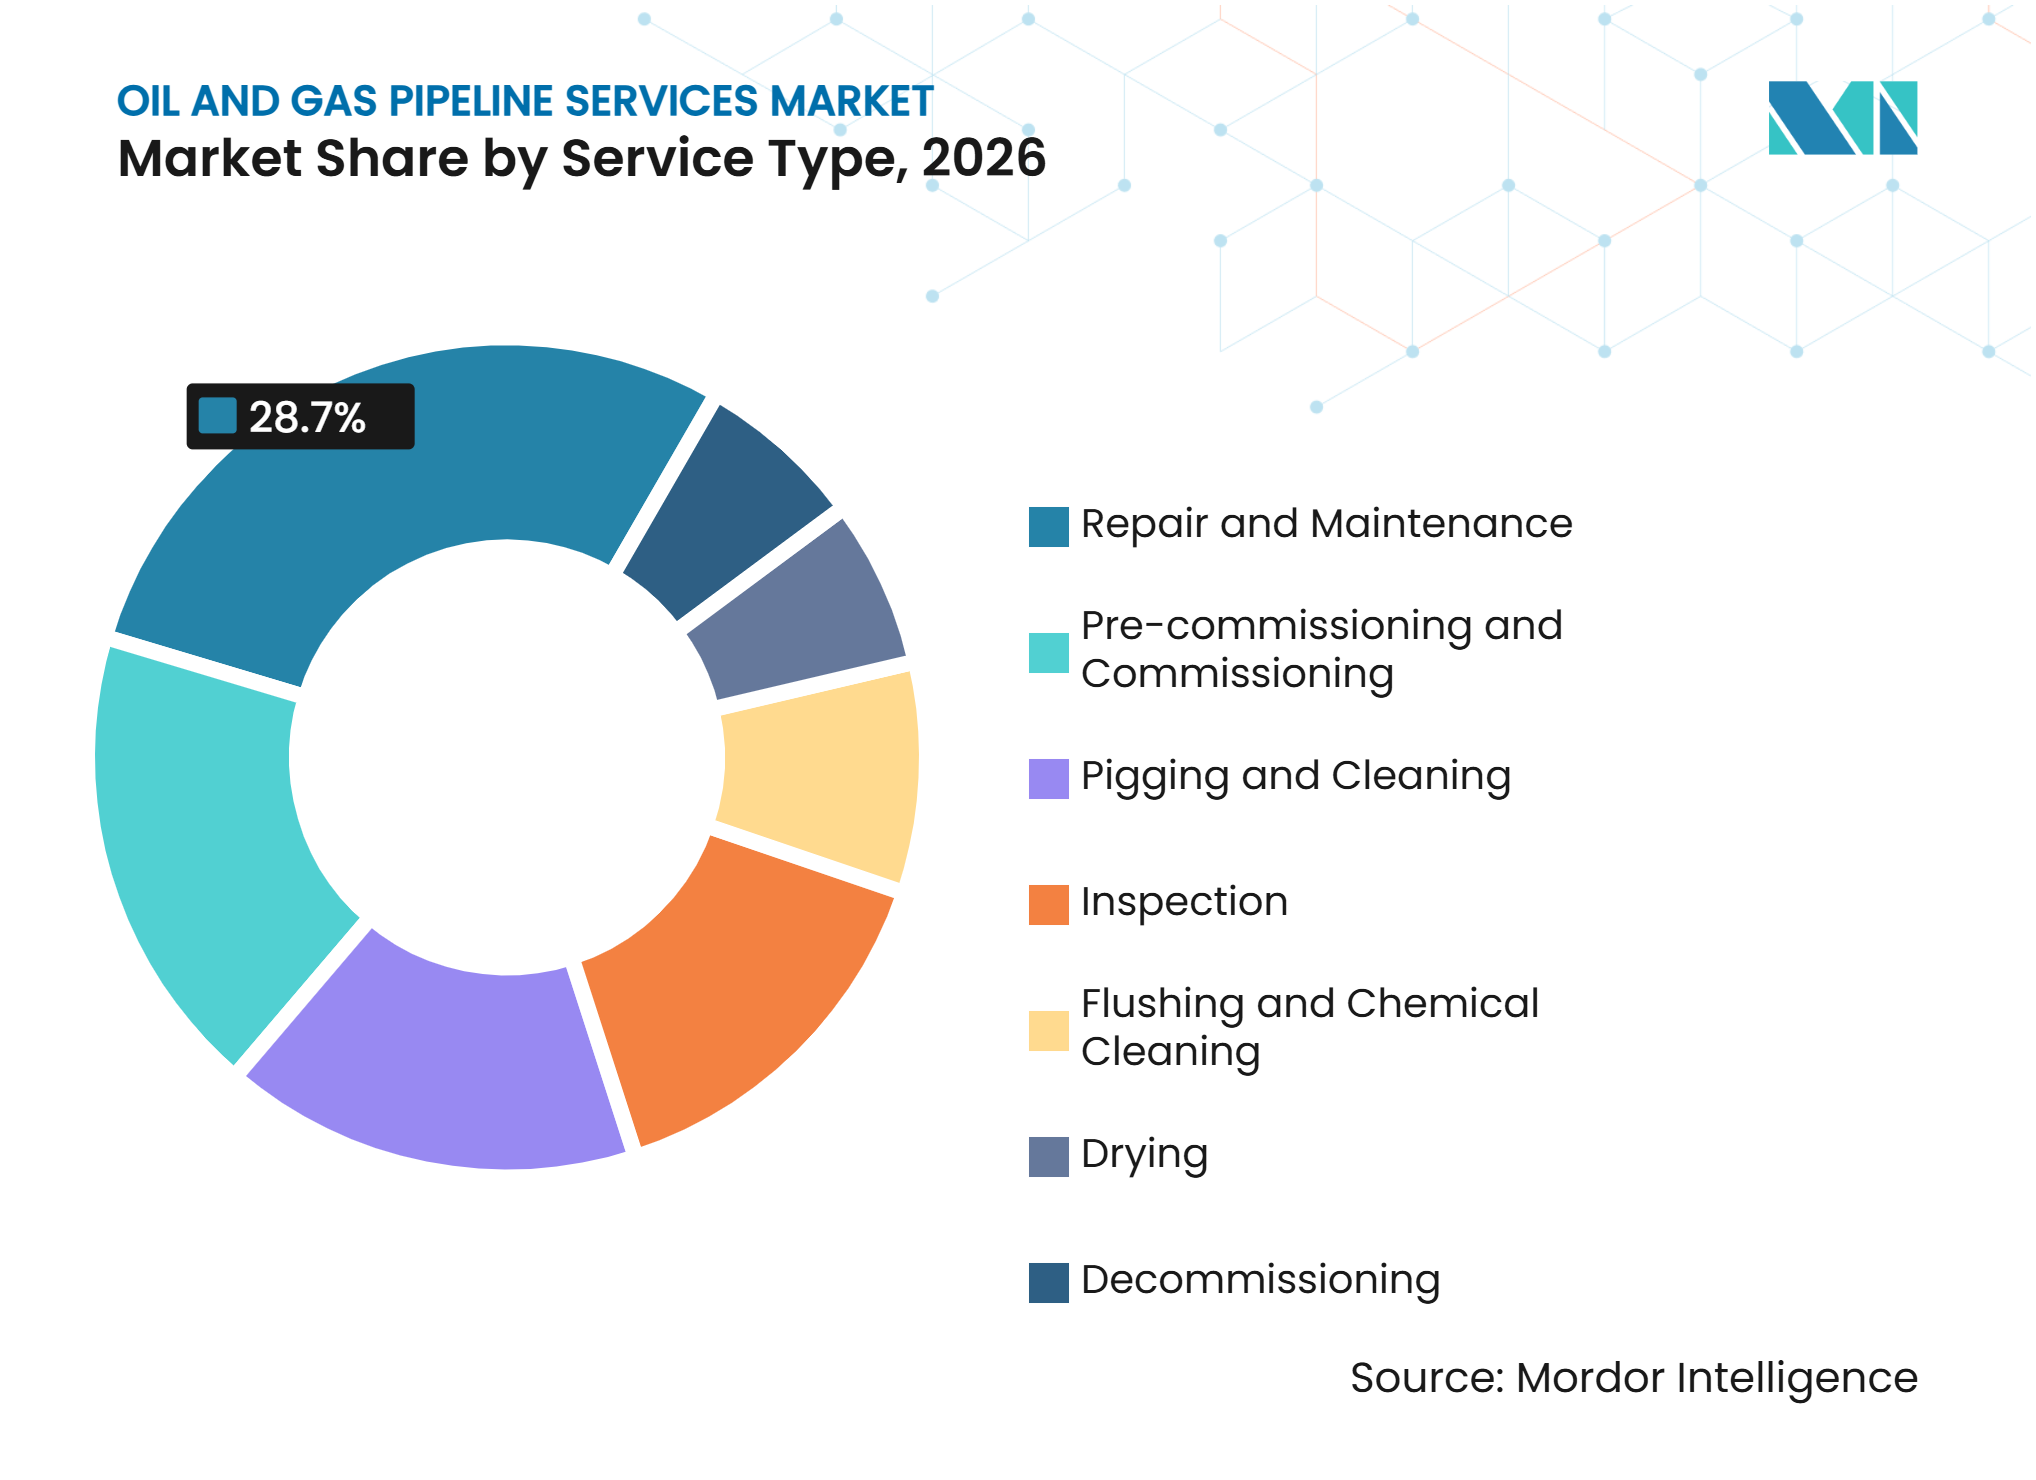
- By service type, repair and maintenance held 28.7% of revenue in 2026, while pre-commissioning and commissioning is forecast to grow at a 7.6% CAGR through 2032.
- By pipeline type, crude oil pipelines held 32.3% of revenue in 2026, while natural gas pipelines is forecast to grow at a 7.2% CAGR through 2032.
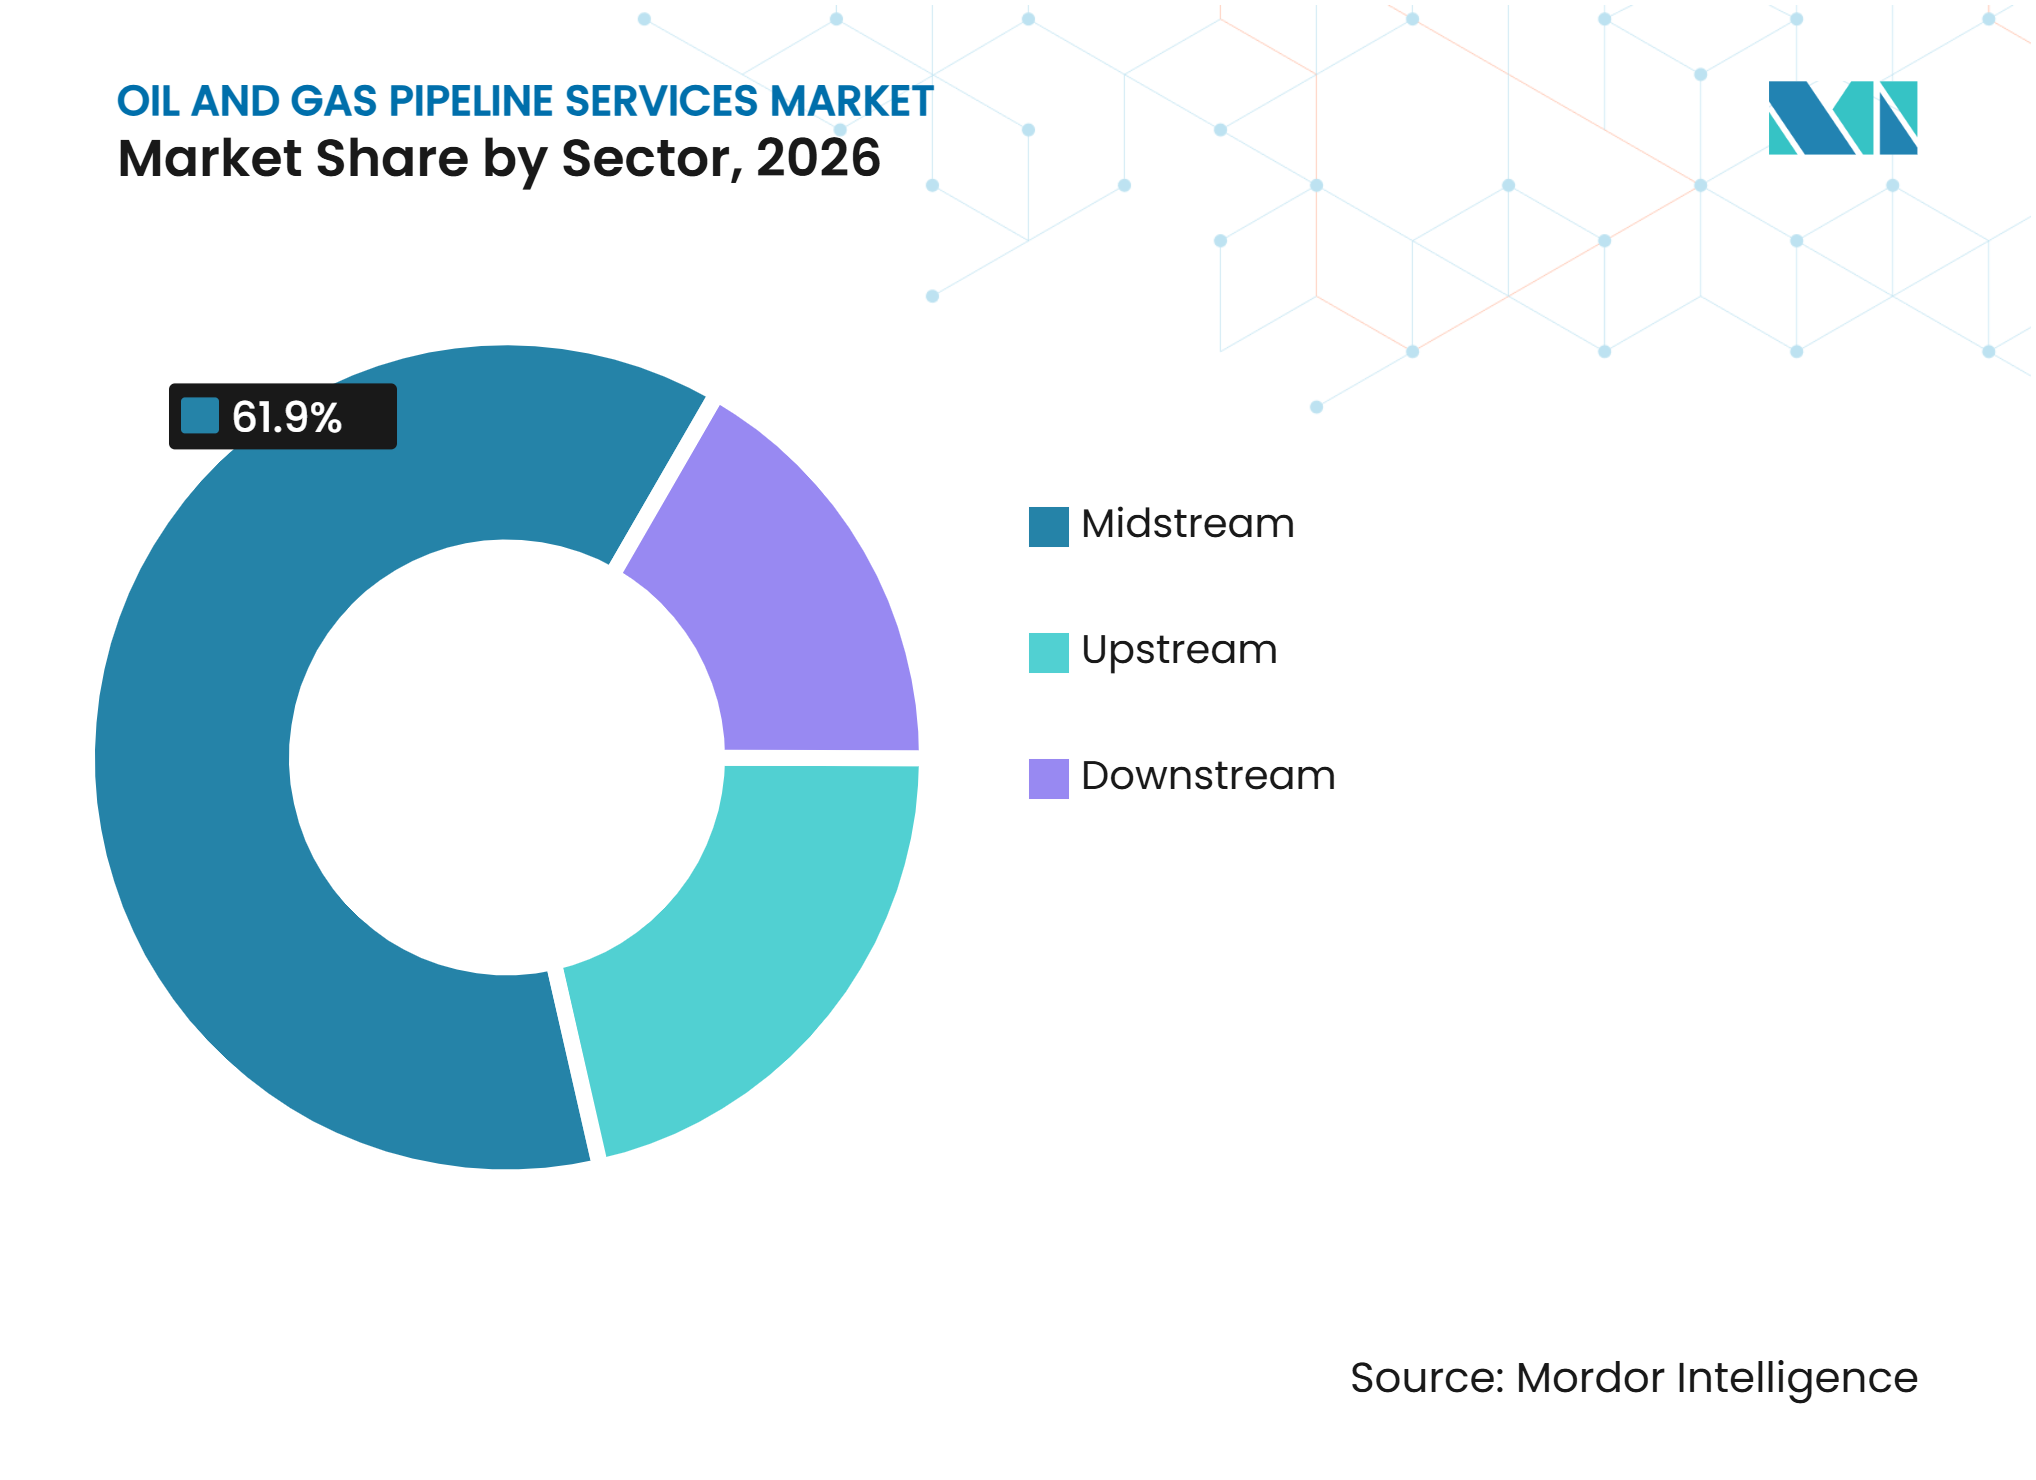
- By sector, midstream held 61.9% of revenue in 2026 and is forecast to grow at a 7.3% CAGR through 2032.
- By geography, North America held 37.7% of revenue in 2026, while Asia-Pacific is forecast to grow at a 7.8% CAGR through 2032.
Note: Market numbers in this report are based on Mordor Intelligence's proprietary estimation framework, which combines nine months of actuals with Q4 projections for base year 2026.
Market Trends and Insights
Drivers Impact Analysis of Oil and Gas Pipeline Services Market*
| Driver | (~) % Impact on CAGR Forecast | Geographic Relevance | Impact Timeline |
|---|---|---|---|
| Aging Pipeline Networks and Life-Extension Services | +2.5% | Global, strongest in North America and Europe | Medium term (2-4 years) |
| Pipeline Integrity and Methane-Emissions Regulations | +1.2% | North America and Europe | Short term (≤ 2 years) |
| Cross-Border Pipeline Expansion and Midstream Investment | +1.5% | Asia-Pacific, Middle East and Africa, and North America | Medium term (2-4 years) |
| Digital Twins, AI Analytics, and Predictive Maintenance | +0.8% | Global, with early gains in North America and Asia-Pacific | Medium term (2-4 years) |
| Hydrogen and Carbon Dioxide Pipeline Readiness | +0.7% | Europe, the United Kingdom, and North America | Long term (≥ 4 years) |
| Autonomous Inspection for Non-Piggable and Offshore Assets | +0.6% | North Sea, Gulf of Mexico, and Asia-Pacific offshore areas | Medium term (2-4 years) |
| Source: Mordor Intelligence | |||
Aging Pipeline Networks Requiring Life-Extension Services
Aging infrastructure remains a central source of demand for integrity management work in the oil and gas pipeline services market. Many U.S. transmission systems entered service between the 1950s and 1970s, creating ongoing need for corrosion control, repairs, isolation, and fitness-for-service reviews. The available skilled construction workforce fell from 44,682 in 2000 to 35,431 in 2025, according to APCA research, while the network requiring maintenance continued to expand. Operators are responding by placing more work under multiyear integrity contracts that provide clearer maintenance schedules and steadier access to specialized crews. This approach favors providers that can diagnose defects, carry out repairs, and document compliance within a single program. It also supports work on hard-to-access and offshore lines where autonomous inspection can reduce personnel exposure.
Stricter Pipeline Integrity and Methane-Emissions Regulations
The January 2025 Pipeline and Hazardous Materials Safety Administration rule established leak detection, repair, and blowdown requirements for covered gas pipeline facilities in the United States.[1] The Pipeline and Hazardous Materials Safety Administration also issued Periodic Standards Update II in August 2025, incorporating 19 updated industry standards into federal safety regulations effective January 2026. These requirements increase the need for inspection planning, data collection, and repair execution across transmission and distribution assets. EU Regulation 2024/1789 established rules for renewable gas, natural gas, and hydrogen networks, including planning provisions that affect future network development.[2] The oil and gas pipeline services market benefits where compliance programs shift inspection from a periodic task to a documented and managed process. The revocation of the U.S. Waste Emissions Charge in 2025 removed one cost layer, but did not alter the Pipeline and Hazardous Materials Safety Administration's underlying pipeline safety requirements.
Cross-Border Pipeline Expansion and Midstream Investment
New transmission lines generate work before startup and during their initial operating years. The International Energy Agency reported that more than 90 billion cubic meters per year of LNG liquefaction capacity reached final investment decision in 2025. This construction pipeline supports demand for hydrostatic testing, gauging, dewatering, nitrogen drying, and baseline inline inspection in the oil and gas pipeline services market. Abu Dhabi National Oil Company Gas awarded USD 2.1 billion in contracts in January 2025 for Ruwais LNG supply infrastructure, including transmission pipeline and compression work. Large programs in the Middle East and LNG-linked systems in North America concentrate opportunities among contractors that can mobilize equipment and qualified staff at scale. Cross-border systems also require more consistent records and procedures, as they involve multiple operators, contractors, and regulatory regimes.
Digital Twins, AI Analytics, and Predictive Maintenance Adoption
Digital tools are changing how operators use inspection results in the oil and gas pipeline services market. A 2025 peer-reviewed study described a digital twin approach that combines physical modeling and data assimilation to identify leaks, corrosion, and blockages with greater precision. Integrating inline inspection data with asset records can help operators prioritize repairs based on risk rather than a fixed schedule alone. This favors suppliers that can provide transparent data governance, defect classification, and risk models alongside field services. Pre-commissioning data has greater value when it becomes the first record in a long-term predictive maintenance program. Providers that lack a digital offering may remain active in individual inspection assignments, but face difficulty competing for longer programs. The same capability may also support evaluation of legacy assets for hydrogen or carbon dioxide (CO2) service.
Restraints Impact Analysis of Oil and Gas Pipeline Services Market*
| Restraint | (~) % Impact on CAGR Forecast | Geographic Relevance | Impact Timeline |
|---|---|---|---|
| Capital-Expenditure Cyclicality and Delayed Maintenance Budgets | -0.9% | Global, strongest in oil-revenue-concentrated economies | Short term (≤ 2 years) |
| High Upfront Cost of Advanced Inspection and Monitoring Systems | -0.5% | Global, with a larger effect on smaller independent operators | Medium term (2-4 years) |
| Legacy Pipeline Geometries Limiting Standard Inspection Tools | -0.3% | North America and the Middle East | Long term (≥ 4 years) |
| Shortage of Certified ILI Interpreters and Integrity Specialists | -0.4% | Global, acute in North America and Northwest Europe | Medium term (2-4 years) |
| Source: Mordor Intelligence | |||
Capital-Expenditure Cyclicality and Delayed O&M Budgets
Capital discipline can postpone discretionary repair and monitoring work in the oil and gas pipeline services market. The IEA reported that upstream oil investment fell in 2025, placing pressure on spending linked to oil-weighted systems. Operators may defer noncritical maintenance during lower-price periods, then seek specialist crews quickly as operating conditions improve. This creates fuller inspection schedules, higher day rates, and more limited access to qualified labor. Primoris Services Corporation reported a pipeline opportunity funnel exceeding USD 3 billion in early 2026 after a difficult cycle, indicating that recovery activity can return rapidly. Safety-related work is less flexible than discretionary work, so cyclicality affects the timing and mix of demand more than it reduces the overall need for services.
High Upfront Cost of Advanced Inspection and Monitoring Systems
High-resolution magnetic flux leakage, ultrasonic testing, and acoustic tools can cost more than conventional cleaning or basic inspection runs. Smaller operators may find it difficult to secure smart-pig capacity, particularly where line geometry is unsuitable for standard tools. The workforce challenge adds to this constraint, as experienced personnel command higher wages and require continuing certification. The oil and gas pipeline services market also faces a shortage of NDT personnel, with a large share of certified workers approaching retirement.[3] Older systems may require custom inspection approaches, further increasing planning time and cost. These conditions favor providers with their own tool fleets, training systems, and the ability to offer alternatives for non-piggable lines.
*Our forecasts treat driver/restraint impacts as directional, not additive. The impact forecasts reflect baseline growth, mix effects, and variable interactions.
Oil and Gas Pipeline Services Market Segment Analysis
By Service Type:
Repair Work Provides the Largest Base While Commissioning ExpandsRepair and maintenance held 28.7% of the oil and gas pipeline services market in 2024. This share reflects ongoing life-extension requirements across midstream and gathering networks, particularly where systems have operated for several decades. Composite repairs, hot-tap isolation, cathodic protection restoration, and corrosion management remain regular needs for operators managing active assets. Pigging and cleaning services maintain a stable role in periodic maintenance programs. Inspection services are increasingly linked with software, data interpretation, and integrity planning rather than sold as standalone field assignments. Flushing, chemical cleaning, and drying remain important before new lines enter service and where existing systems are prepared for changed service conditions.
Pre-commissioning and commissioning is forecast to expand at a 7.6% CAGR through 2032, the fastest rate within the service type segment. The International Energy Agency identified Louisiana LNG, Corpus Christi Train 8 and 9, and Port Arthur Phase 2 among U.S. projects reaching final investment decision in 2025. Such projects require cleaning, flooding, testing, dewatering, drying, and baseline inspection before commercial operation. Baseline data improves later predictive maintenance decisions by giving operators a documented starting condition. Hydrogen and carbon dioxide (CO2) applications add requirements for moisture control, purging, and material verification. Decommissioning continues to support service demand where late-life offshore and onshore assets reach the end of their useful operating lives.



By Pipeline Type:
Crude Oil Systems Hold the Largest Position While Gas Lines ExpandCrude oil pipelines held 32.3% of the oil and gas pipeline services market share in 2024. High-throughput systems in the Permian Basin, Gulf Coast, and Middle East require regular pigging, corrosion management, isolation, and repair support. Saudi Arabia's East-West Pipeline throughput increased to 7 million barrels per day in 2025, while further work under Vision 2030 supports network upgrades. Refined petroleum product and distribution pipelines provide a steady service base connected to refinery operations and urban delivery systems. Sequential batching and product-quality requirements add operational demands that favor experienced contractors. The oil and gas pipeline services market depends not only on new construction but also on the daily reliability of established crude and product networks.
Natural gas pipelines are forecast to grow at a 7.2% CAGR through 2032. Development of LNG-linked infrastructure and domestic gas networks supports demand for testing and integrity services before and after startup. China's Sichuan-Fujian gas pipeline, with 4,269 km of route length and 20 billion cubic metres of annual capacity, illustrates the scale of new network additions. The International Energy Agency also expects U.S. natural gas production to grow through 2030, with further takeaway capacity needed for LNG supply. Gathering and transmission lines therefore require both commissioning work and ongoing inspection programs. Growth in gas lines does not displace the repair needs of oil networks but shifts the project mix toward larger commissioning assignments.
By Sector:
Midstream Leads Both Current Demand and GrowthMidstream held 61.9% of revenue in 2024 and is forecast to grow at a 7.3% CAGR through 2032. This position reflects the concentration of transmission, gathering, storage, and LNG-linked assets within the sector. The oil and gas pipeline services market size for midstream work is supported by new gas capacity and mandatory integrity programs on existing lines. U.S. regulations under 49 CFR Parts 192 and 195 are increasing inspection and documentation requirements for operators. Providers with established compliance practices can compete for broader, multiyear work scopes. Midstream operators also value contractors that can coordinate field services with reliable reporting for regulators and internal asset teams.
Upstream activity supports commissioning work on gathering lines and flow assurance services around producing fields. The International Energy Agency reported that 40% of 2025 upstream oil and gas spending was directed toward slowing declines at existing fields, which maintains the relevance of upkeep on related gathering systems. Downstream facilities require regular inspection and revalidation of refinery process piping. API 510 and API 570 practices remain relevant to managing pressure equipment and piping integrity in these settings. Advanced non-destructive testing can reduce outage exposure by enabling targeted testing and more informed maintenance planning. The three sectors have different operating conditions, but all require credible evidence of asset condition and repair quality.

Geography Analysis
North America
North America held 37.7% of the oil and gas pipeline services market share in 2026. This position reflects a large installed network and a detailed pipeline safety framework led by the Pipeline and Hazardous Materials Safety Administration (PHMSA) in the United States. The Periodic Standards Update II introduced 19 updated standards into the regulatory framework from January 2026. These compliance requirements increase demand for baseline assessments, leak detection, records management, and repairs. The International Energy Agency expects US natural gas supply to rise through 2030, with additional infrastructure serving Gulf Coast LNG export corridors. Digital records and risk-based work planning are becoming more important as operators balance safety obligations with large construction programs.
Asia-Pacific
Asia-Pacific is forecast to expand at a 7.8% CAGR through 2032. New gas networks and LNG-related construction place the region at the center of future commissioning demand in the oil and gas pipeline services market. China's 2025 infrastructure measures address the planning, construction, and operation of oil and gas facilities, establishing a clearer policy framework for network development.[4] China also published GB/T 46543-2025 on integrity management of nonmetallic oil and gas transmission pipelines. These developments increase the value of providers with expertise in commissioning, inspection, and documented integrity processes. New projects generate immediate pre-startup work, followed by demand for periodic surveys and repairs. Contractors that can operate across different national standards and supply chains are better positioned as project activity expands.
Europe, Middle East and Africa, and South America
Europe's pipeline service demand is influenced by aging gas systems and the need to prepare selected corridors for new gases. Regulation 2024/1789 requires ten-year network development plans for relevant transmission system operators, supporting engineering and qualification work on future gas and hydrogen networks. National Gas Transmission has engaged the market on Project Union and SCO2T Connect, which involve hydrogen and carbon dioxide infrastructure planning. The Middle East presents large commissioning opportunities from gas expansion and LNG feedstock projects. ADNOC Gas's Ruwais awards support pipeline construction and compression requirements connected to the planned export facility. South America maintains project activity around offshore and unconventional resources, where pipeline installation must be followed by testing, startup, and integrity work. These varied geographies create demand for providers that can apply specialized skills across offshore, cross-border, and repurposed systems.
Competitive Landscape
Market Concentration
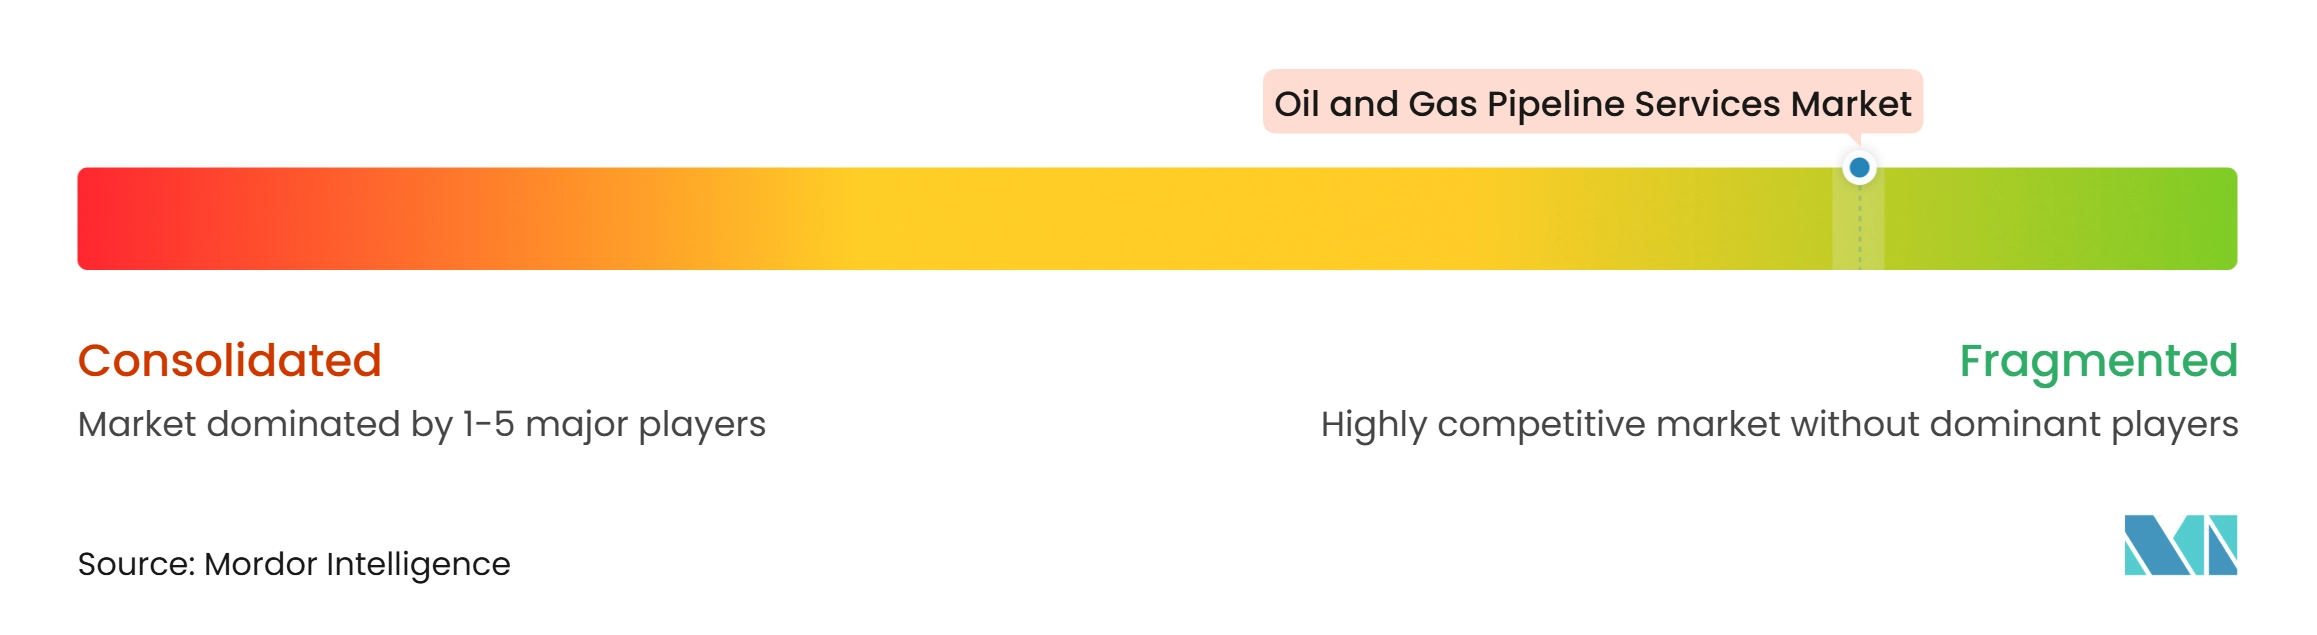
The oil and gas pipeline services market is fragmented, with integrated service companies, EPCI contractors, and specialized inspection providers addressing different parts of the value chain. Baker Hughes identifies Process and Pipeline Services as a business covering pre-commissioning, maintenance, and inline inspection within its Industrial and Energy Technology portfolio. SLB, Halliburton, TechnipFMC, Saipem, Subsea 7, McDermott, KBR, Worley, ROSEN Group, NDT Global, T.D. Williamson, MISTRAS Group, STATS Group, EnerMech, Primoris Services Corporation, Applus+, and Wood is active across relevant service areas. Competition varies by contract type, as large offshore projects require EPCI capacity while integrity programs depend on diagnostic tools, data interpretation, and field access. Larger providers can bundle services, while specialized firms compete on the performance of their inspection and isolation technologies. Buyers typically assess safety performance, technical certification, mobilization capacity, and reporting quality before making award decisions.
Digital capability is becoming an important differentiator in the oil and gas pipeline services market. T.D. Williamson published an inline inspection performance specification for circumferential stress corrosion cracking assessment in January 2025, reflecting investment in complex-threat detection. MISTRAS Group launched a platform combining digital twins, risk modeling, IoT monitoring, and condition data in 2025, supporting more integrated integrity programs. ROSEN Group offers services related to future fuels and conversion consultancy, positioning it for work on pipelines with changing duty requirements. These developments indicate that contractors increasingly compete on the quality of asset intelligence as well as their physical tool fleet. Smaller firms can remain competitive in local work, but higher equipment costs and staffing requirements may limit their ability to offer full-scope programs.
Geographic capacity also shapes competitive outcomes in the oil and gas pipeline services market. Subsea 7 received an offshore Saudi Arabia contract in September 2025 covering 106 km of infield and export pipelines under its long-term agreement with Aramco. Saipem received contracts valued at USD 720 million in April 2025 for work in the Middle East and Guyana, including repair work on damaged subsea pipelines. STATS Group secured a three-year Malaysian isolation contract in April 2025, expanding its regional service presence. These awards demonstrate the advantage of proven local execution, established client relationships, and specialized equipment. Providers that combine these strengths with digital integrity services are better positioned to win long-duration programs.
Oil and Gas Pipeline Services Industry Leaders
-
Baker Hughes Company
-
ROSEN Group
-
T.D. Williamson, Inc.
-
NDT Global GmbH & Co. KG
-
STATS Group
- *Disclaimer: Major Players sorted in no particular order
Oil and Gas Pipeline Services Market Companies Covered in this Report
- Applus+ (Applus Services, S.A.)
- Baker Hughes Company
- Bechtel Corporation
- EnerMech Ltd.
- Fluor Corporation
- Halliburton Company
- John Wood Group PLC
- KBR, Inc.
- McDermott International
- MISTRAS Group, Inc.
- NDT Global GmbH & Co. KG
- Primoris Services Corporation
- ROSEN Group
- Saipem S.p.A.
- SLB (Schlumberger Limited)
- STATS Group
- Subsea 7 S.A.
- T.D. Williamson, Inc.
- TechnipFMC plc
- Worley Limited
Recent Industry Developments in Oil and Gas Pipeline Services Market
- October 2026: Energy Transfer LP entered into a definitive agreement to acquire Vaquero Midstream LLC in a bolt-on transaction valued at approximately USD 2.625 billion, consisting of USD 1.95 billion in cash and approximately 33.3 million newly issued Energy Transfer LP common units. Vaquero Midstream LLC operates a midstream business that includes approximately 300 miles of natural gas gathering and intrabasin transportation pipelines serving key areas of the Delaware Basin, along with the Caymus Processing Complex.
- October 2026: Técnicas Reunidas SA secured a contract worth more than EUR 200 million from LNG Canada to provide Engineering, Procurement and Construction Management (EPCM) services for Phase 2 of the Coastal GasLink natural gas pipeline project in British Columbia, Canada. The project includes the construction of five additional compressor stations and modifications to existing pipeline facilities to increase natural gas transportation capacity.
- August 2026: Enbridge Inc. announced progress toward restoring service on its Line 5 crude oil and natural gas liquids pipeline following a release of approximately 31,000 barrels (1.3 million gallons) of natural gas liquids in Iron County, Wisconsin. The incident occurred when an unoccupied subcontractor flatbed truck rolled into an excavation site and struck the pipeline during a valve project.
- March 2026: Lamprell PLC was awarded a contract by Oil & Natural Gas Corporation (ONGC) for the Pipeline Replacement Project (PRP-IX) in India. The project involves the replacement and installation of approximately 285 km of subsea pipelines across Oil & Natural Gas Corporation's western offshore assets, including the Mumbai High, Neelam & Heera, Bassein, and Satellite fields.
Global Oil and Gas Pipeline Services Market Report Scope
Oil and gas pipeline services cover the engineering, construction, maintenance, and monitoring solutions required to transport energy resources safely. This industry handles pipeline design, route surveying, and welding, as well as routine structural inspections and emergency repairs. Technologies such as smart pigging and real-time data monitoring are used to prevent leaks, manage corrosion, and maintain operational efficiency. These services provide the infrastructure link that ensures a continuous, safe, and secure flow of oil, gas, and refined products from production sites to consumers.
The global oil and gas pipeline services market is segmented by service type into pre-commissioning and commissioning services, pigging and cleaning services, inspection services, flushing and chemical cleaning services, drying services, repair and maintenance services, and decommissioning services. By pipeline type, the market is segmented into crude oil pipelines, natural gas pipelines, refined petroleum product pipelines, gathering and transmission pipelines, and distribution pipelines. By sector, the market is segmented into upstream, midstream, and downstream. The report also covers the market size and forecasts for the global oil and gas pipeline services market across 25 countries in major regions. For each segment, the market sizing and forecasts are provided on the basis of value (USD).
Segmentation Overview
| Pre-commissioning and Commissioning Services |
| Pigging and Cleaning Services |
| Inspection Services |
| Flushing and Chemical Cleaning Services |
| Drying Services |
| Repair and Maintenance Services |
| Decommissioning Services |
| Crude Oil Pipelines |
| Natural Gas Pipelines |
| Refined Petroleum Product Pipelines |
| Gathering and Transmission Pipelines |
| Distribution Pipelines |
| Upstream |
| Midstream |
| Downstream |
| North America | United States |
| Canada | |
| Mexico | |
| Europe | Germany |
| France | |
| Italy | |
| Spain | |
| United Kingdom | |
| Norway | |
| Netherlands | |
| Russia | |
| Rest of Europe | |
| Asia-Pacific | China |
| India | |
| Australia | |
| Indonesia | |
| Vietnam | |
| Thailand | |
| Rest of Asia-Pacific | |
| South America | Brazil |
| Argentina | |
| Chile | |
| Rest of South America | |
| Middle East and Africa | Saudi Arabia |
| United Arab Emirates | |
| Egypt | |
| Nigeria | |
| Oman | |
| Rest of Middle East and Africa |
| By Service Type | Pre-commissioning and Commissioning Services | |
| Pigging and Cleaning Services | ||
| Inspection Services | ||
| Flushing and Chemical Cleaning Services | ||
| Drying Services | ||
| Repair and Maintenance Services | ||
| Decommissioning Services | ||
| By Pipeline Type | Crude Oil Pipelines | |
| Natural Gas Pipelines | ||
| Refined Petroleum Product Pipelines | ||
| Gathering and Transmission Pipelines | ||
| Distribution Pipelines | ||
| By Sector | Upstream | |
| Midstream | ||
| Downstream | ||
| By Geography | North America | United States |
| Canada | ||
| Mexico | ||
| Europe | Germany | |
| France | ||
| Italy | ||
| Spain | ||
| United Kingdom | ||
| Norway | ||
| Netherlands | ||
| Russia | ||
| Rest of Europe | ||
| Asia-Pacific | China | |
| India | ||
| Australia | ||
| Indonesia | ||
| Vietnam | ||
| Thailand | ||
| Rest of Asia-Pacific | ||
| South America | Brazil | |
| Argentina | ||
| Chile | ||
| Rest of South America | ||
| Middle East and Africa | Saudi Arabia | |
| United Arab Emirates | ||
| Egypt | ||
| Nigeria | ||
| Oman | ||
| Rest of Middle East and Africa | ||
Key Questions Answered in the Report
What is the projected value of oil and gas pipeline services by 2032?
The sector is forecast to reach USD 41.78 billion by 2032, growing at a 6.91% CAGR from 2027.
Which service type is growing fastest in pipeline services?
Pre-commissioning and Commissioning is forecast to grow at a 7.6% CAGR through 2032, supported by LNG-linked pipeline construction.
Why are pipeline integrity services becoming more important?
Aging systems, regulatory requirements, and leak detection rules are increasing demand for inspection, data management, repairs, and documented compliance.
Which pipeline category has the highest growth outlook?
Natural Gas Pipelines are forecast to grow at a 7.2% CAGR through 2032 as gas networks and LNG supply infrastructure expand.
Which region has the highest growth rate for pipeline services?
Asia-Pacific is forecast to grow at a 7.8% CAGR through 2032, supported by new gas infrastructure and related commissioning work.
What capabilities matter most when selecting a pipeline services provider?
Buyers typically assess safety performance, technical certifications, tool availability, field execution capacity, digital data management, and reporting quality.