
Catalysts In Petroleum Refining, Chemicals, And Polymer Synthesis Market Size and Share
Market Overview
| Study Period | 2020 - 2031 |
|---|---|
| Forecast Data Period | 2026 - 2031 |
| Historical Data Period | 2020 - 2024 |
| Growth Rate | 4.02 % |
| Fastest Growing Market | Asia Pacific |
| Largest Market | Asia Pacific |
Major Players *Disclaimer: Major Players sorted in no particular order Image © Mordor Intelligence. Reuse requires attribution under CC BY 4.0. | |

Catalysts In Petroleum Refining, Chemicals, And Polymer Synthesis Market Analysis by Mordor Intelligence
The Catalysts in Petroleum Refining, Chemicals, and Polymer Synthesis Market size is expected to register a CAGR of 4.02% during the forecast period.
- Rising demand for maintaining high octane figures is another major driver for the market studied
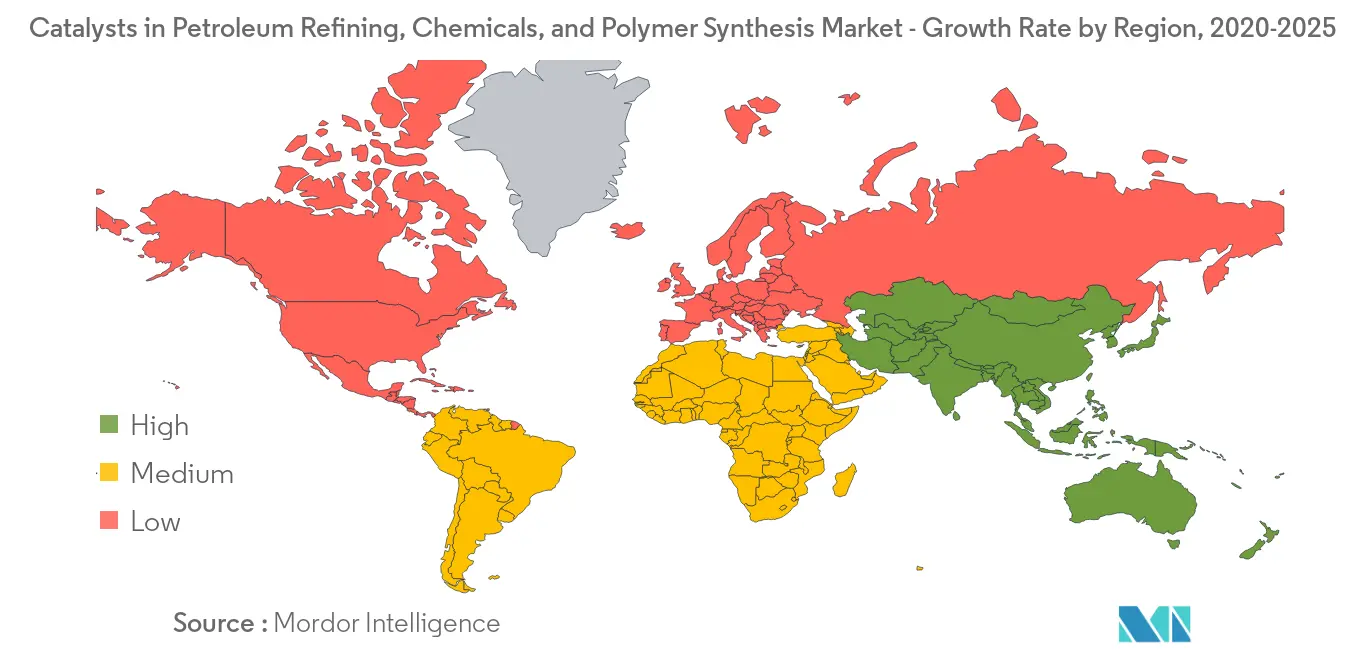
- Asia-Pacific is expected to account for the highest market share during the forecast period.
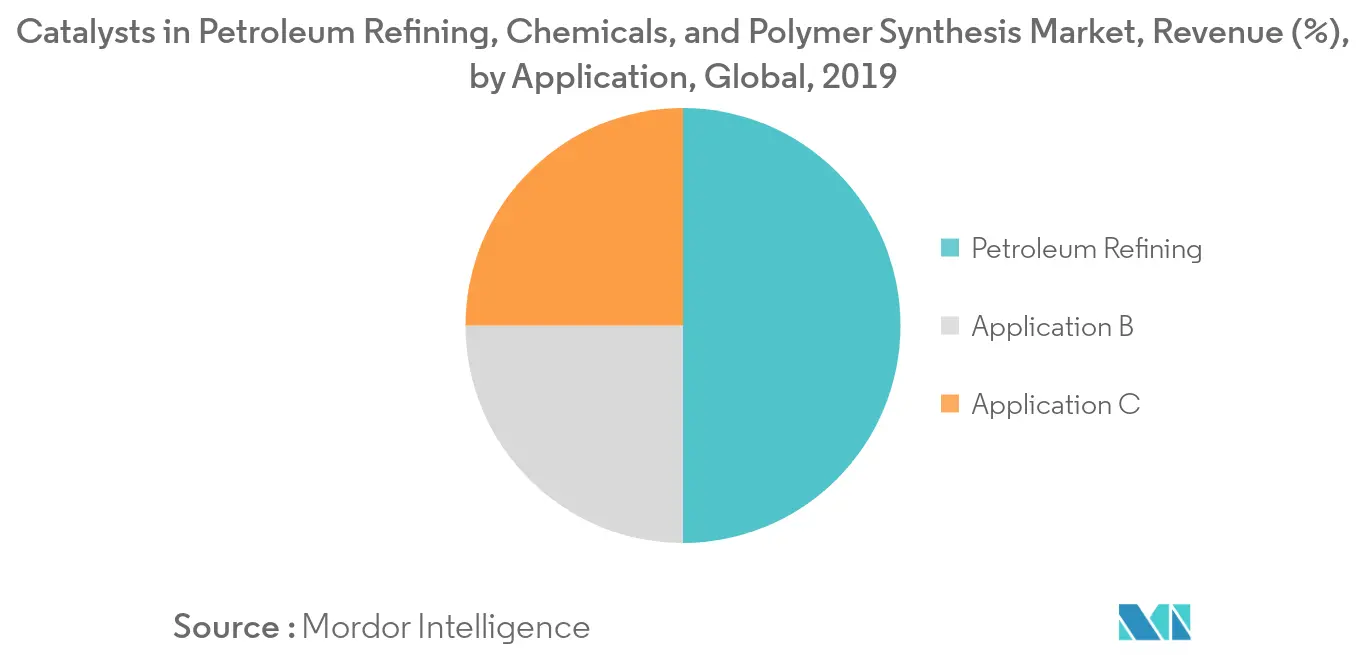
- Among the applications, Petroleum Refining is likely to account for the highest market share during the forecast period.
Note: Market size and forecast figures in this report are generated using Mordor Intelligence’s proprietary estimation framework, updated with the latest available data and insights as of 2026.
Global Catalysts In Petroleum Refining, Chemicals, And Polymer Synthesis Market Trends and Insights
Petroleum Refining Application to Dominate the Market
- The growing consumption of petroleum products, like hydrocarbons, is expected to grow, thereby, driving the market studied. The global demand for liquid hydrocarbons is growing mainly due to the growth of the population and the consumer class in developing countries.
- The growth in the demand for oil in the developing countries will be majorly encouraged by the industrial sector, in particular, the petrochemical industry.
- Stringent environmental legislations, while being a bane for industries, such as refineries, can be a boon for catalyst manufacturers, provided they introduce efficient catalysts at the right time.
- For instance, 'drop-in' catalysts that can be used with the existing refinery setup could be a preferred industry choice.
- Hence, owing to the above-mentioned reasons, the petroleum refining catalysts application is likely to dominate the Catalysts in Petroleum Refining, Chemicals, and Polymer Synthesis Market during the forecast period.


Asia-Pacific to Dominate the Market
- Asia-Pacific is likely to lead the market owing to the higher consumption of petroleum products, including transport fuels, polymers, and other life amenities. The major demand for catalysts in Asia comes from China.
- China has emerged as one of the biggest production houses in the world today and is the principal location for the manufacture and export of plastic products.
- In the recent past, there has been significant growth in the demand for catalysts from India, and Southeast Asian countries for various applications.
- Hence, owing to the above-mentioned factors, Asia-pacific is likely to dominate the Catalysts in Petroleum Refining, Chemicals, and Polymer Synthesis Market during the forecast period.

Competitive Landscape
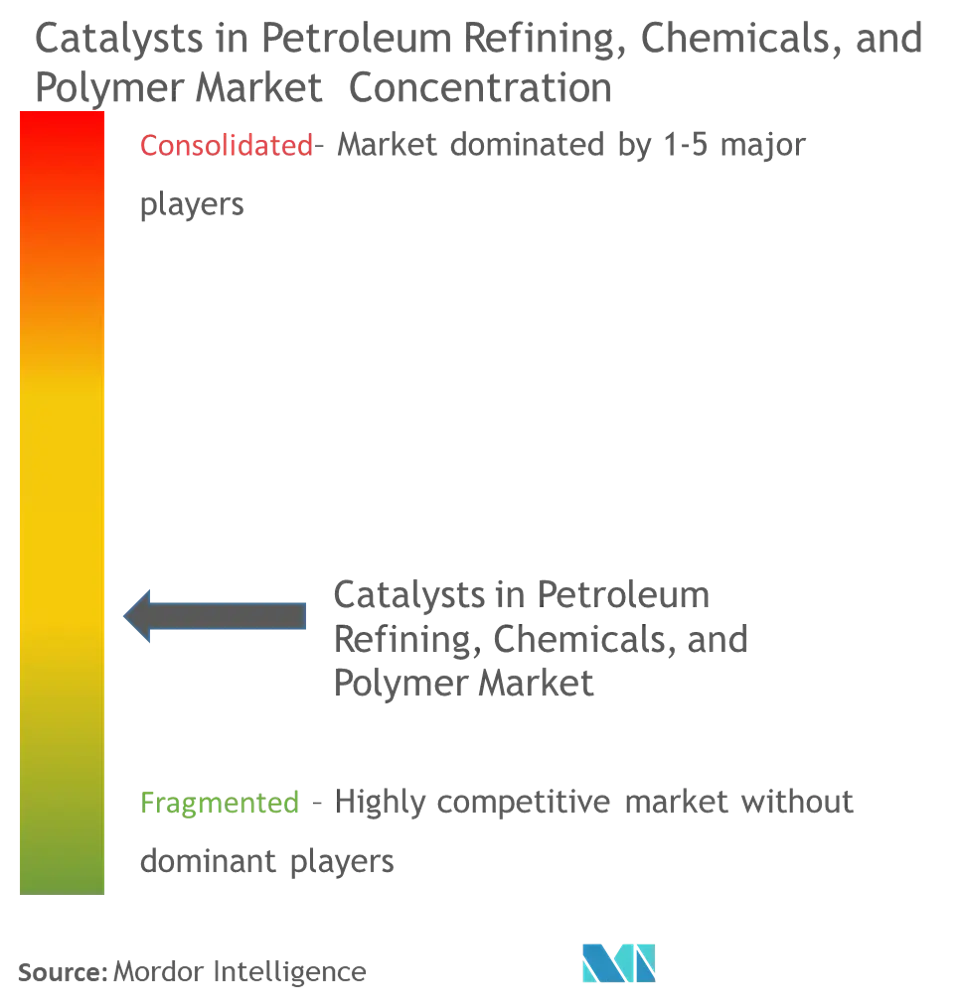
The Catalysts in Petroleum Refining, Chemicals, and Polymer Synthesis Market is moderately fragmented as the majority of the market share is divided among many players. Some of the key players in the market include BASF SE, Honeywell International Inc, Exxon Mobil Corporation, Dow, and Chevron Phillips Chemical Company, among others.
Catalysts In Petroleum Refining, Chemicals, And Polymer Synthesis Industry Leaders
BASF SE
Honeywell International Inc
Exxon Mobil Corporation
Dow
Chevron Phillips Chemical Company
- *Disclaimer: Major Players sorted in no particular order

Market Opportunities and Future Outlook
Catalyst demand is being pulled by refinery-petrochemical integration and higher-value molecules, which raises the need for tailored formulations across dehydrogenation, hydroprocessing, and FCC. Honeywell UOPs' announced supply of process technologies and catalysts for the Dangote complex to add 750,000 metric tons per year of propylene and 400,000 metric tons per year of linear alkylbenzene highlights how propylene and detergent-range intermediates can increase the focus on selective catalysts beyond conventional fuels output.
Competition is also shifting toward higher-selectivity and longer-life catalysts that reduce fouling, meet tighter product specifications, and handle more challenging feedstocks, including renewable and circular streams. In April 2026, Clariant launched CATOFIN 1000 for propane dehydrogenation with reduced tar precursor formation (up to 20%) and improved fouling resistance, and Evonik introduced high-performance isodewaxing catalysts based on mesoporized zeolite technology for fuels and lubricants. In parallel, the July 2026 INERATEC and Zeopore collaboration to apply meso-zeolite technology to hydrocracking Fischer-Tropsch waxes into drop-in fuels and chemicals points to active differentiation opportunities for catalyst suppliers through materials engineering and process integration across petroleum refining, chemical synthesis, and polymerization value chains.
Recent Industry Developments
- June 2026: Refinity (Innventure, Inc.) secured an exclusive license from Pacific Northwest National Laboratory (PNNL) for a two-step catalytic oligomerization technology that converts plastic-derived light olefins into distillate-range products. The announced licensing supports commercialization of plastic-to-fuels and plastic-to-chemicals routes and increases demand for specialized catalyst systems linked to circular feedstocks such as waste plastics.
- May 2026: BASF opened a new research and development center for refinery catalysts at its Attapulgus, Georgia production site, expanding FCC testing and catalyst product development capabilities. Co-locating R&D with manufacturing is intended to shorten iteration cycles for customer-specific formulations and support faster scale-up of performance upgrades for refinery applications.
- April 2026: Honeywell announced it will provide UOP process technologies and catalysts for the Dangote petrochemical complex expansion to support 750,000 tonnes per year of propylene and 400,000 tonnes per year of linear alkylbenzene production. The award reflects refinery-petrochemical integration needs and points to continued demand for dehydrogenation and downstream chemical catalysts that improve selectivity and onstream reliability at large integrated sites.


Research Methodology Framework and Report Scope
Market Definition and Coverage
This market covers the value of catalysts sold for use in petroleum refining units, chemical synthesis processes, and polymer synthesis, counted at the point of catalyst supply into these end uses on a global basis.
Scope exclusions: We exclude downstream fuel and chemical product values, catalyst handling services, and most in-house regenerated catalyst value unless it is sold as a commercial product.
Segmentation Overview
- Material
- Metals and Organometallic Catalysts
- Inexpensive Metals
- Precious Metals
- Metallic Compounds
- Aluminosilicates
- Zeolites
- Molecular Sieves
- Chemical Compounds
- Peroxides
- Acids
- Amines
- Other Chemical Compounds
- Other Materials
- Metals and Organometallic Catalysts
- Application
- Petroleum Refining
- Fluid Catalytic Cracking (FCC)
- Hydrocracking
- Hydrotreating
- Alkylation
- Reforming
- Isomerization
- Chemical Synthesis
- Organic Synthesis
- Oxidation
- Hydrogenation
- Dehydrogenation
- Synthesis Gas Processes
- Polymerization
- Polyolefins
- Condensation Polymers
- Thermosetting Polymers
- Additional Polymers
- Petroleum Refining
- Geography
- Asia-Pacific
- China
- India
- Japan
- South Korea
- ASEAN Countries
- Rest of Asia-Pacific
- North America
- United States
- Canada
- Mexico
- Europe
- Germany
- United Kingdom
- Italy
- France
- Rest of Europe
- South America
- Brazil
- Argentina
- Rest of South America
- Middle-East and Africa
- Saudi Arabia
- South Africa
- Rest of Middle-East and Africa
- Asia-Pacific
Data Sources, Market Sizing, and Validation
Desk Research
Desk work starts by mapping where catalysts are consumed across refining and chemical production, then linking those end uses to measurable industry activity. We used public sources such as International Energy Agency refinery throughput and product demand indicators, US Energy Information Administration refinery utilization series, and EUROSTAT industrial production signals to set regional activity baselines.
For chemicals and polymers, we also reviewed open association and regulator material, including International Council of Chemical Associations references, UN Comtrade trade flows for catalyst-related materials, and peer-reviewed chemistry and chemical engineering journals for technology shifts and typical catalyst lifetimes. Alongside this, company annual reports, investor presentations, and reliable business press were used to track capacity changes, turnaround cycles, and product mix. A paid subscription that tracks company financials and another that tracks patents were used selectively to confirm supplier exposure and new catalyst formulation focus areas. These desk research sources are illustrative, and we relied on additional public documents to collect, validate, and clarify data points.
Primary Interviews and Surveys
Primary validation was done through expert interviews and structured surveys with catalyst suppliers, refining and petrochemical plant technical teams, distributors, and independent industry consultants across APAC, EMEA, and the Americas. These discussions helped us correct assumed replacement cycles for key catalyst families, confirm which process units drive demand, and test pricing logic by catalyst family before finalizing the market model.
Distribution of primary research fieldwork respondents
| Company type | Respondent position | Region |
|---|---|---|
| Top tier: 37% | CXOs: 13% | APAC: 46% |
| Mid tier: 43% | Functional/Unit leaders: 33% | EMEA: 36% |
| Smaller Players: 20% | Managers: 54% | Americas: 18% |
Market-Sizing & Forecasting
Sizing was built using top-down and bottom-up checks, with the main build anchored on demand pools that can be observed in refining and chemical production. For petroleum refining, refinery throughput, unit utilization, and sulfur regulation intensity were used to reconstruct catalyst consumption, and then translated into value using application-level replacement cycles and typical pricing bands.
For chemical synthesis and polymer synthesis, the model used regional chemical production indicators, additions and closures of large assets, and polymer output direction as the activity spine, followed by catalyst intensity assumptions by process type (for example, hydrogenation, oxidation, FCC-related petrochemical integration, and polyolefin catalyst use). To keep the totals realistic, we corroborated outputs with selective bottom-up approximations such as supplier exposure roll-ups, channel checks on imported catalyst volumes, and sampled ASP time versus volume ranges. Where data gaps remained, we used conservative midpoints and re-tested the sensitivities with experts. Forecasts were generated using scenario analysis that ties refining runs, petrochemical margins, and new capacity timelines to adoption and replacement behavior, then adjusted when interview feedback indicated faster or slower turnarounds in specific regions.
Data Validation & Update Cycle
Outputs were cross-checked against independent signals like refinery utilization trends, regional chemical production direction, and trade movement for catalyst-related materials. Any outliers were reviewed and corrected before sign-off. If a segment moved too sharply year over year, we revisited the driver assumptions and, where needed, re-contacted experts to confirm whether the change came from pricing, volume, or a real technology shift.
Each report is refreshed annually, and interim updates are made when material events occur, such as large capacity start-ups, major regulatory changes, or extended outages. Before publication, a final analyst pass is completed so the delivered view reflects the latest data available at that time.
Mordor Intelligence's Petroleum Refining Chemicals and Polymer Synthesis Global Market for Catalysts Market Size Measured Against Other Published Estimates
Published market values for these catalysts often differ because firms do not always count the same catalyst families and end uses, and they also apply different replacement and pricing assumptions by process. Differences in refresh timing and currency conversion windows can further widen the gap, even when the growth story looks similar.
Refinery utilization signals and cross-region capacity additions were the key checks that kept Mordor Intelligence's estimate tied to catalysts consumed in refining, chemical synthesis, and polymer synthesis only, rather than folding in adjacent environmental and aftertreatment catalyst demand that can inflate totals.
Benchmark comparison
| Source | Market Size | Gaps in Research Methodology |
|---|---|---|
| Mordor Intelligence | USD 0.00 B (2025) | |
| Industry Analytics Firm A | USD 6.80 B (2025) | This figure appears to include a wider catalyst scope, with environmental and emission-control catalysts counted alongside refining, chemicals, and polymer synthesis, which increases the total addressable value. |
| Industry Report Publisher B | USD 29.96 B (2025) | This estimate likely uses a broad definition that rolls catalyst materials and related chemical inputs across a wider chemical chain, and it may apply higher average pricing without separating replacement cycles by unit and application. |
The spread in the table is mostly explained by what gets counted inside the boundary and how replacement and pricing are applied across refinery units versus chemical and polymer processes. By keeping the scope tightly linked to observable activity drivers and then confirming lifetimes and pricing logic through field feedback, the resulting number stays traceable and repeatable for planning decisions.


Key Questions Answered in the Report
What is the current Catalysts in Petroleum Refining, Chemicals, and Polymer Synthesis Market size?
The Catalysts in Petroleum Refining, Chemicals, and Polymer Synthesis Market is projected to register a CAGR of 4.02% during the forecast period (2026-2031)
Who are the key players in Catalysts in Petroleum Refining, Chemicals, and Polymer Synthesis Market?
BASF SE, Honeywell International Inc, Exxon Mobil Corporation, Dow and Chevron Phillips Chemical Company are the major companies operating in the Catalysts in Petroleum Refining, Chemicals, and Polymer Synthesis Market.
Which is the fastest growing region in Catalysts in Petroleum Refining, Chemicals, and Polymer Synthesis Market?
Asia Pacific is estimated to grow at the highest CAGR over the forecast period (2026-2031).
Which region has the biggest share in Catalysts in Petroleum Refining, Chemicals, and Polymer Synthesis Market?
In 2025, the Asia Pacific accounts for the largest market share in Catalysts in Petroleum Refining, Chemicals, and Polymer Synthesis Market.
What years does this Catalysts in Petroleum Refining, Chemicals, and Polymer Synthesis Market cover?
The report covers the Catalysts in Petroleum Refining, Chemicals, and Polymer Synthesis Market historical market size for years: 2019, 2020, 2021, 2022, 2023 and 2024. The report also forecasts the Catalysts in Petroleum Refining, Chemicals, and Polymer Synthesis Market size for years: 2026, 2027, 2028, 2029, 2030 and 2031.
Page last updated on:


 Your data is secure and never sold or shared.


