LNG Terminal Market Size and Share
Market Overview
| Study Period | 2021 - 2031 |
|---|---|
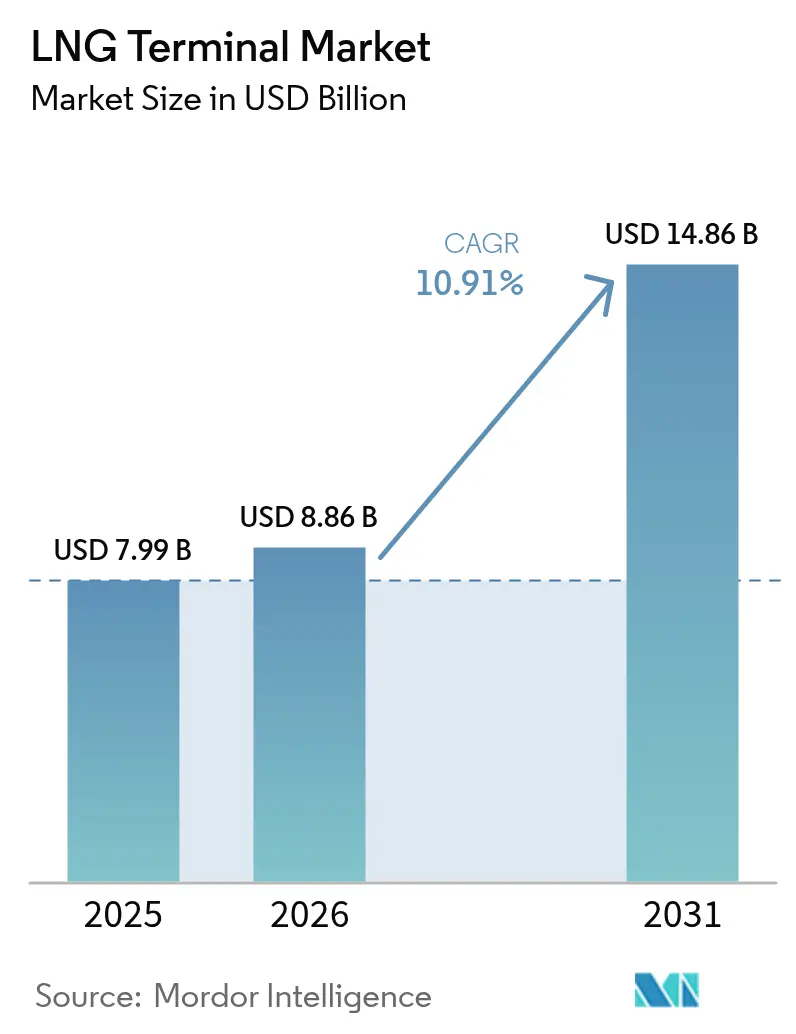
| Market Size (2026) | USD 8.86 Billion |
| Market Size (2031) | USD 14.86 Billion |
| Growth Rate (2026 - 2031) | 10.91% CAGR |
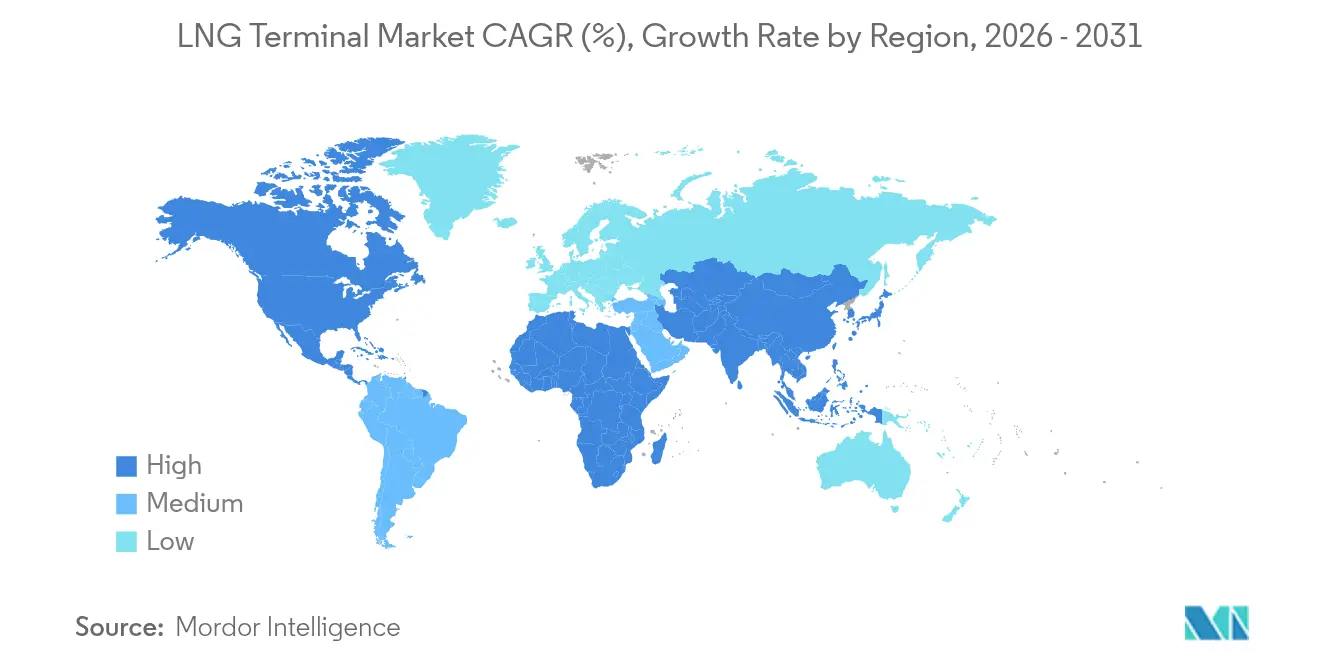
| Fastest Growing Market | Europe |
| Largest Market | Asia Pacific |
| Market Concentration | Medium |
Major Players *Disclaimer: Major Players sorted in no particular order Image © Mordor Intelligence. Reuse requires attribution under CC BY 4.0. | |
LNG Terminal Market Analysis by Mordor Intelligence
The LNG Terminal Market size was valued at USD 7.99 billion in 2025 and estimated to grow from USD 8.86 billion in 2026 to reach USD 14.86 billion by 2031, at a CAGR of 10.91% during the forecast period (2026-2031).
Europe’s accelerated infrastructure build-out to secure non-pipeline supplies and the Asia-Pacific region’s sustained demand are keeping final investment decisions brisk, establishing new hub capacity ahead of forecasted consumption.[1]Offshore Energy, “Europe’s LNG import build-out accelerates”, offshore-energy.biz Floating storage and regasification units compress construction cycles to 1–2 years, cutting upfront capital and steering governments toward rapid-deployment models. Concurrent liquefaction megaprojects in the United States and Qatar are expanding export availability, reshaping long-term supply contracts, and narrowing regional price spreads. Investors also see growing optionality in modular bunkering hubs that cater to marine decarbonisation mandates while hedging exposure to volatile spot cargo pricing.
Key Report Takeaways
- By terminal type, onshore facilities led with 68.20% of the LNG terminals market share in 2025. Floating solutions are projected to expand at a 14.18% CAGR through 2031.
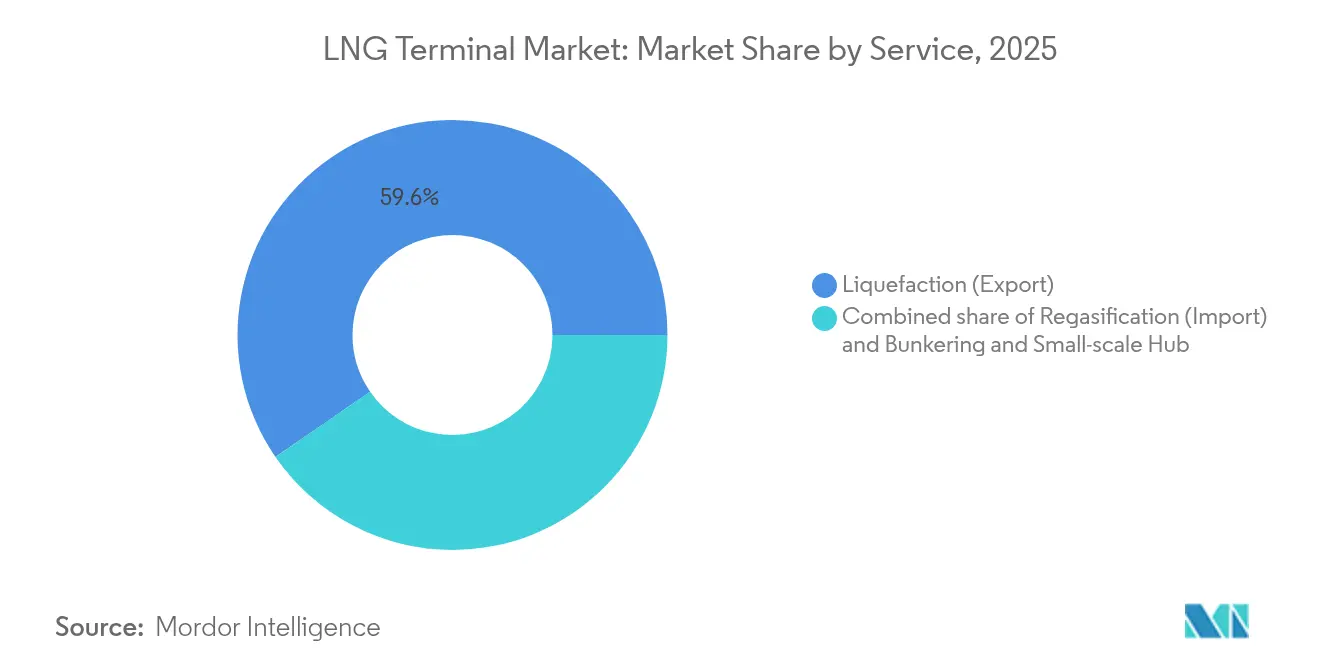
- By service, liquefaction export terminals accounted for 59.60% share of the LNG terminals market size in 2025. Bunkering and small-scale hubs are forecast to grow at a 16.35% CAGR through 2031.
- By capacity, terminals above 5 MMTPA represented a 56.90% share in 2025, while facilities below 2 MMTPA are expected to advance at a 15.42% CAGR through 2031.
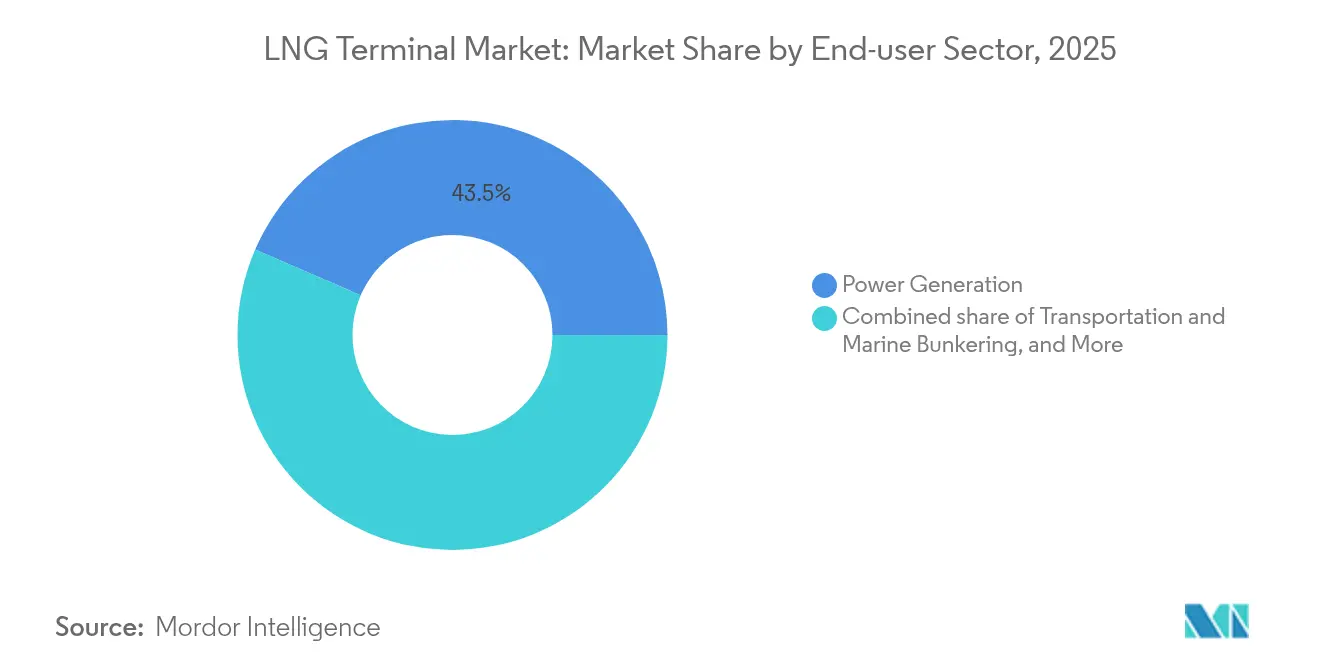
- By end-user sector, power generation captured a 43.50% share in 2025, whereas transportation and marine bunkering are projected to rise at a 14.95% CAGR through 2031.
- By geography, the Asia-Pacific region held a 48.10% share in 2025, and Europe is projected to register the highest CAGR at 12.85% through 2031.
Note: Market size and forecast figures in this report are generated using Mordor Intelligence’s proprietary estimation framework, updated with the latest available data and insights as of 2026.
Global LNG Terminal Market Trends and Insights
Drivers Impact Analysis*
| Driver | (~) % Impact on CAGR Forecast | Geographic Relevance | Impact Timeline |
|---|---|---|---|
| European energy-security driven terminal additions | +2.1% | Europe, spillover to North America | Short term (≤ 2 years) |
| Rapid uptake of FSRU solutions for near-term regas capacity | +1.9% | Global, concentrated in Europe and Asia-Pacific | Medium term (2-4 years) |
| US and Qatari liquefaction wave expanding global supply | +1.8% | Global, North America and Middle East | Long term (≥ 4 years) |
| Modular micro-LNG hubs unlocking underserved coastal demand | +1.4% | Asia-Pacific core, spillover to Latin America and Africa | Medium term (2-4 years) |
| Carbon-neutral LNG certification premiums attracting investment | +1.1% | Global, with early adoption in Europe and North America | Long term (≥ 4 years) |
| Hydrogen-ready designs boosting brownfield expansion viability | +1.0% | Europe and Asia-Pacific, with selective North America adoption | Long term (≥ 4 years) |
| Source: Mordor Intelligence | |||
Surge in European Energy-Security Driven Terminal Additions
Europe redirected its natural gas strategy after the Ukraine conflict, and governments financed multiple LNG facilities to safeguard supply continuity. Germany deployed 5 floating storage and regasification units within 18 months, while the Netherlands integrated carbon capture at the EemsEnergy hub, demonstrating a multi-energy design that supports hydrogen readiness. Poland lifted Świnoujście capacity to 8.3 billion m³, creating regional trading slack that alters pipeline flows. Southern Europe followed with parallel projects in Italy and Greece, raising aggregate European import capability beyond short-term demand. Structural overcapacity positions the continent to re-export surplus cargoes, shaping new arbitrage routes for the LNG terminals market.
Rapid Uptake of FSRU Solutions for Near-Term Regas Capacity
Floating storage and regasification units shorten construction to 1-2 years and average USD 330 million, compared with USD 1 billion for equivalent onshore plants. More than 50 operational units confirm commercial maturity, enabling states such as Estonia to secure energy while permanent sites are being built. Singapore adopted a second LNG berth with a floating design to bypass land scarcity, while LNG Canada integrated digital twins that track real-time thermodynamics across hull systems. Enhanced cryogenic CO₂ capture modules further reduce lifecycle emissions, driving investor preference for floating assets that now serve as enduring fixtures rather than stop-gaps. These advances propel the LNG terminals market toward faster project payback and broader geographic reach.
US and Qatari Liquefaction Wave Expanding Global Supply
Qatar’s North Field expansion adds 49 million tons annual nameplate by 2030, lifting national capacity to 142 MTPA. In parallel, the United States accelerates the development of new trains: Cheniere achieved its first LNG from Corpus Christi Stage 3 in December 2024, and Venture Global reached initial cargo at Plaquemines the same month. Modular construction at New Fortress Energy’s Fast LNG delivered production on a compressed timeline, validating an assembly-line approach that trims capital hours. Surplus volumes are contracted on hybrid indices that temper buyer exposure to spot volatility, expanding the buyer pool for the LNG terminals market. Increased ship-to-ship trade narrows regional price gaps and heightens utilisation prospects for destination terminals worldwide.
Modular Micro-LNG Hubs Unlocking Underserved Coastal Demand
Terminals below 2 MMTPA are projected to grow at a 15.7% CAGR to 2030, supported by factory-built modules sized for remote harbors. Brazil’s TAG-Eneva link transports 14 million m³ of gas daily through private pipeline infrastructure, opening up new fuel options for northern industrial clusters. Vietnam commissioned the Cai Mep terminal under the same model, proving viability in emerging markets with limited capital bandwidth. Marine bunkering is the key pull factor; Sohar Port invested USD 1.6 billion in LNG refuelling to serve ocean traffic on the east-west corridor. Low unit cost and incremental scalability encourage stakeholders to deploy micro hubs that collectively reshape regional flows in the LNG terminals market.
Restraints Impact Analysis*
| Restraint | (~) % Impact on CAGR Forecast | Geographic Relevance | Impact Timeline |
|---|---|---|---|
| High capex and opex intensity of large-scale LNG terminals | -1.7% | Global, heavier on developing markets | Long term (≥ 4 years) |
| Volatile spot LNG prices depressing terminal utilisation | -1.5% | Global, acute in Asia-Pacific and Europe | Short term (≤ 2 years) |
| Methane-emission scrutiny delaying project approvals | -0.9% | North America and Europe, expanding to Asia-Pacific | Medium term (2-4 years) |
| Pipeline reversals & biomethane blending eroding LNG demand | -0.8% | Europe and North America, limited Asia-Pacific impact | Medium term (2-4 years) |
| Source: Mordor Intelligence | |||
High Capex and Opex Intensity of Large-Scale LNG Terminals
Greenfield export facilities demand USD 1–3 billion and yearly operating budgets beyond USD 100 million, stretching balance sheets even for integrated majors. Carrier newbuilds climbed to USD 269 million for 174 000 m³ hulls, tacking shipping premiums onto delivered gas costs.[2]VesselsLink, “LNG carrier newbuild price survey”, vesselslink.com Inflation in steel and skilled labour erodes margins, forcing US developers to renegotiate engineering procurement contracts. South Korea’s KOMIPO cancelled a planned import quay, citing capital stress and weaker demand projections, underscoring financing risk for the LNG terminals industry. Developing economies face heightened currency-translation risk, which amplifies the debt service load, curbing final investment decisions even when demand fundamentals remain strong.
Volatile Spot LNG Prices Depressing Terminal Utilisation
Large capacity additions coincide with a buyer’s market from 2024 to 2028, pushing utilisation rates below bankability thresholds at new European import jetties. Henry Hub futures signal wider amplitude swings once US supply peaks in 2026, complicating cash-flow modelling for terminal operators tied to tolling fees.[3]Natural Gas Intelligence, “US Henry Hub price outlook”, naturalgasintelligence.com Venture Global’s lower-than-expected liquefaction revenues illustrate how contractual flex keeps offtakers nimble during weak cycles. Developers diversify with storage and trans-shipment services, yet ancillary earnings rarely bridge the shortfall from under-loaded send-out arms. Persistent volatility, therefore, caps throughput recovery and dampens the growth slope of the LNG terminals market.
*Our forecasts treat driver/restraint impacts as directional, not additive. The impact forecasts reflect baseline growth, mix effects, and variable interactions.
Segment Analysis
By Terminal Type: Floating Solutions Drive Innovation
Floating terminals delivered a 14.18% CAGR through 2031, while onshore plants retained 68.20% of the LNG terminal market share in 2025. The LNG terminals market size for floating assets is projected to increase by USD 2.74 billion between 2026 and 2031, reflecting the advantages of quick mobilization. Construction windows of 24 months underpin national security agendas in the Baltic and Mediterranean. Golar’s 2008 FSRU conversion and 2018 FLNG refit validated seaworthy liquefaction and regasification at commercial scale. Digital twin analytics now track boil-off gas and pump cycling, raising uptime above 98%. Onshore counterparts still dominate volume corridors from the US Gulf Coast and Qatar, due to their higher nameplate capacities and direct pipe tie-ins. Yet policymakers prefer floating starter capacity that later migrates to petrochemical or hydrogen service, sustaining demand for novel hull orders within the LNG terminal market.
Estonia’s Paldiski case highlights a dual-track deployment approach; a chartered FSRU secures immediate imports while civil works progress for land-based tanks. Similar blueprints in the Philippines and Colombia showcase floating-to-shore migration pathways. Competitive tendering tilts toward turnkey leasing, allowing treasury-light entry into gas monetisation. Consequently, vessel owners and yards that master modular topsides and low-pressure reliquefaction gain advantage as floating uptake spreads deeper into Asia and Africa.
By Service: Export Dominance Faces Bunkering Disruption
Liquefaction plants retained a 59.60% share of the LNG terminals market size in 2025, supported by US and Qatari mega-projects. Train additions across Louisiana, Texas, and Ras Laffan push aggregate export availability beyond 200 MTPA by 2030. Portfolio players secure long-term tenure agreements that lock in tolling cash flows. Conversely, bunkering and small-scale hubs are expected to widen at a 16.35% CAGR as the IMO’s sulfur cap and carbon index steer fleets toward LNG propulsion. Sohar’s USD 1.6 billion facility targets container lines on the Strait of Hormuz, and Singapore prepares a second jetty optimised for fueled barges.
Regasification remains relevant where consumption outpaces domestic supply, notably in China, where 39 projects are currently under construction. Service stratification, therefore, reflects energy transition vectors: exporters monetize stranded gas, importers diversify their procurement, and bunkering nodes feed maritime decarbonization. Integrated developers that co-locate these modes will capture synergies and defend margins in an increasingly competitive LNG terminal market.


By Capacity Range: Scale Economics Versus Modular Flexibility
Terminals above 5 MMTPA held a 56.90% share in 2025, leveraging throughput economies across the US Gulf and the Australian north coast. The LNG terminals market share for this bracket aligns with traditional commodity corridors, which demand low unit liquefaction costs. Mid-scale 2-5 MMTPA projects supply regional pipes in Europe, offering price arbitrage thanks to pipeline interconnectivity. Below 2 MMTPA, growth reaches a 15.42% CAGR as prefab skids reduce erection times. Vietnam’s Cai Mep and Brazil’s Barcarena clusters demonstrate that sub-5 MMTPA can deliver grid resilience without requiring heavy sovereign guarantees.
ABB’s control systems at Texas LNG demonstrate how automation reduces opex for small trains and increases availability to above 96%. Scalable battery storage integration further lowers spinning reserve demand and curbs flaring. As distributed renewables spread, planners use micro-LNG to back up intermittent solar, thereby maintaining high aggregate utilization across the LNG terminals market.
By End-user Sector: Power Generation Leadership Faces Marine Challenge
Power producers commanded a 43.50% market share of the LNG terminals in 2025, as gas-fired turbines balanced variable wind and solar fleets. The LNG terminals market size for power use is forecast to post a 5.82% CAGR, driven by the retirement of coal-fired power plants in South and Southeast Asia. Industrial demand follows as steel and chemicals operators pivot from fuel oil to gas for CO₂ compliance in export markets.
Marine bunkering, however, charts a 14.95% CAGR, propelled by dual-fuel container ships on Asia-Europe lanes. Honeywell’s tie-up with Argent LNG in Louisiana aims to co-serve ocean vessels and trucking corridors, blending retail and wholesale offtake. By spanning end-user classes, multi-service sites smooth throughput swings and enhance debt service coverage ratios -a strategy increasingly favored across the LNG terminals industry.
Geography Analysis
The Asia-Pacific region retained a 48.10% share of the LNG terminals market in 2025, underpinned by China’s 29 active docks and 39 additions that will significantly increase regas capacity to well past 200 MTPA. India doubles Ennore to 10 MTPA and accelerates east-coast pipe links that extend LNG penetration inland. Japan scales trading desks to 5 MTPA by 2030, reinforcing its role as a liquidity hub, while Singapore builds a second berth to recycle cargoes in the Straits. These projects maintain regional send-out stability even as renewables increase, preserving a baseload role for imported gas across the LNG terminals market.
Europe is projected to post the fastest 12.85% CAGR to 2031, following a pivot from pipeline supply. Germany’s 5 FSRU fleet raises short-term gate capacity to 25 billion m³. Stade’s hydrogen-ready design, combined with CCS integration, signals a future-proof approach that attracts low-carbon investors. Poland and the Netherlands add carbon-capture modules that may slash Scope 1 emissions, reshaping sustainability benchmarks. France’s Dunkerque, at 13 billion m³, bridges French and Belgian grids, highlighting cross-border optimisation inside the LNG terminals market.
North America remains supply-centric, as Calcasieu Pass, Plaquemines, and CP2 push the US export plateau toward 190 MTPA. Brazil pioneers private pipe links with TAG-Eneva, while ADNOC advances Ruwais to 9.6 MTPA in the UAE, and Vopak leads South Africa’s Richards Bay import quay. These diverse projects demonstrate tailored architectures that cater to local policy, financing, and demand drivers.

Competitive Landscape
The LNG terminals market exhibits moderate fragmentation, with the five largest operators controlling roughly 55% of the cumulative throughput capacity, placing market concentration at a mid-range level. Legacy majors, such as Shell, QatarEnergy, and Cheniere, leverage integrated trading desks and long-term SPAs to secure volumes. Venture Global’s IPO in January 2025 and a BBB- rating upgrade for Calcasieu Pass signal capital-market appetite for independent growth stories.[5]CNBC, “Venture Global IPO details”, cnbc.com FSRU owners, such as Höegh and Excelerate, capture rent on accelerated European deployments, challenging fixed-site developers.
Technology is a differentiator. LNG Canada’s digital-twin environment predicts pump wear and optimises compressor loads, while ABB’s automation at Texas LNG applies model predictive control to minimise flaring. Strategic moves include Honeywell’s collaboration with Argent LNG to embed carbon capture readiness in Louisiana and Kongsberg’s rollout of integrated asset-performance suites on floating units. Players focusing on micro-terminal rollouts in Southeast Asia gain first-mover advantage in emerging coastal demand pockets, reinforcing the LNG terminals market’s competitive churn.
Regulatory pressure tightens approval windows yet simultaneously fast-tracks energy-security projects in Europe and India. Companies that align their Environmental Social Governance (ESG) reporting with the new EU taxonomy rules can capture concessional finance, a factor that tilts their competitive positioning. Overall, accelerated permitting, digital optimization, and flexible business models shape the intensity of rivalry across the LNG terminals industry.
LNG Terminal Industry Leaders
Cheniere Energy Inc.
QatarEnergy
CNOOC Gas & Power
Shell plc
Tokyo Gas Co., Ltd.
- *Disclaimer: Major Players sorted in no particular order


Recent Industry Developments
- July 2025: S&P Global upgraded Venture Global’s Calcasieu Pass export facility to BBB- following commercial start-up and refinancing of USD 4.75 billion notes.
- April 2025: Honeywell partnered with Argent LNG on a 12 MTPA Louisiana export project that can expand to 25 MTPA.
- March 2025: The US Department of Energy cleared CP2 LNG to export 20 MTPA to non-FTA nations, underpinning a USD 28 billion capital expenditure program.
- December 2024: Venture Global's Plaquemines LNG facility successfully dispatched its maiden liquefied natural gas (LNG) cargo, marking the company's second operational plant. The first shipment, loaded onto the Venture Global Bayou, is en route to EnBW in Germany.


Global LNG Terminal Market Report Scope
The LNG terminal market report include:
| Onshore |
| Floating (FSRU/FLNG) |
| Liquefaction (Export) |
| Regasification (Import) |
| Bunkering and Small-scale Hubs |
| Below 2 MMTPA |
| 2 to 5 MMTPA |
| Above 5 MMTPA |
| Power Generation |
| Industrial and Manufacturing |
| Transportation and Marine Bunkering |
| City-Gas and Residential |
| North America | United States |
| Canada | |
| Mexico | |
| Europe | Germany |
| United Kingdom | |
| France | |
| Italy | |
| NORDIC Countries | |
| Russia | |
| Rest of Europe | |
| Asia-Pacific | China |
| India | |
| Japan | |
| South Korea | |
| ASEAN Countries | |
| Rest of Asia-Pacific | |
| South America | Brazil |
| Argentina | |
| Rest of South America | |
| Middle East and Africa | Saudi Arabia |
| United Arab Emirates | |
| Qatar | |
| South Africa | |
| Nigeria | |
| Rest of Middle East and Africa |
| By Terminal Type | Onshore | |
| Floating (FSRU/FLNG) | ||
| By Service | Liquefaction (Export) | |
| Regasification (Import) | ||
| Bunkering and Small-scale Hubs | ||
| By Capacity Range | Below 2 MMTPA | |
| 2 to 5 MMTPA | ||
| Above 5 MMTPA | ||
| By End-user Sector | Power Generation | |
| Industrial and Manufacturing | ||
| Transportation and Marine Bunkering | ||
| City-Gas and Residential | ||
| By Geography | North America | United States |
| Canada | ||
| Mexico | ||
| Europe | Germany | |
| United Kingdom | ||
| France | ||
| Italy | ||
| NORDIC Countries | ||
| Russia | ||
| Rest of Europe | ||
| Asia-Pacific | China | |
| India | ||
| Japan | ||
| South Korea | ||
| ASEAN Countries | ||
| Rest of Asia-Pacific | ||
| South America | Brazil | |
| Argentina | ||
| Rest of South America | ||
| Middle East and Africa | Saudi Arabia | |
| United Arab Emirates | ||
| Qatar | ||
| South Africa | ||
| Nigeria | ||
| Rest of Middle East and Africa | ||


Key Questions Answered in the Report
What is the projected growth rate for the LNG terminals market to 2031?
The market is set to advance at an 10.91% CAGR, rising from USD 8.86 billion in 2026 to USD 14.86 billion in 2031.
Which region will add capacity fastest between 2026 and 2031?
Europe shows the highest regional CAGR at 12.85% as countries replace pipeline gas with import terminals .
Why are floating storage and regasification units gaining traction?
FSRUs can be delivered in 1-2 years at about one-third the capital cost of onshore plants, giving governments rapid energy-security options.
How are volatile LNG spot prices affecting terminal economics?
Price swings lower utilisation, leading operators to add storage and trans-shipment income streams, though these seldom fully offset reduced throughput.
What makes bunkering infrastructure a growth segment?
IMO sulfur and carbon rules push ship owners toward LNG fuel, driving a 16.35% CAGR in bunkering hubs that supply new dual-fuel vessels
Which capacity range is growing most quickly?
Terminals below 2 MMTPA lead with 15.42% CAGR thanks to modular construction that enables entry into underserved coastal markets.
Page last updated on:


