
K-12 EdTech Market Size and Share
Market Overview
| Study Period | 2022 - 2032 |
|---|---|
| Market Size (2027) | USD 101.22 Billion |
| Market Size (2032) | USD 173.67 Billion |
| Growth Rate (2027 - 2032) | 11.40 % |
| Fastest Growing Market | Asia-Pacific |
| Largest Market | North America |
| Market Concentration | Low |
Major Players *Disclaimer: Major Players sorted in no particular order Image © Mordor Intelligence. Reuse requires attribution under CC BY 4.0. | |
K-12 EdTech Market Analysis by Mordor Intelligence
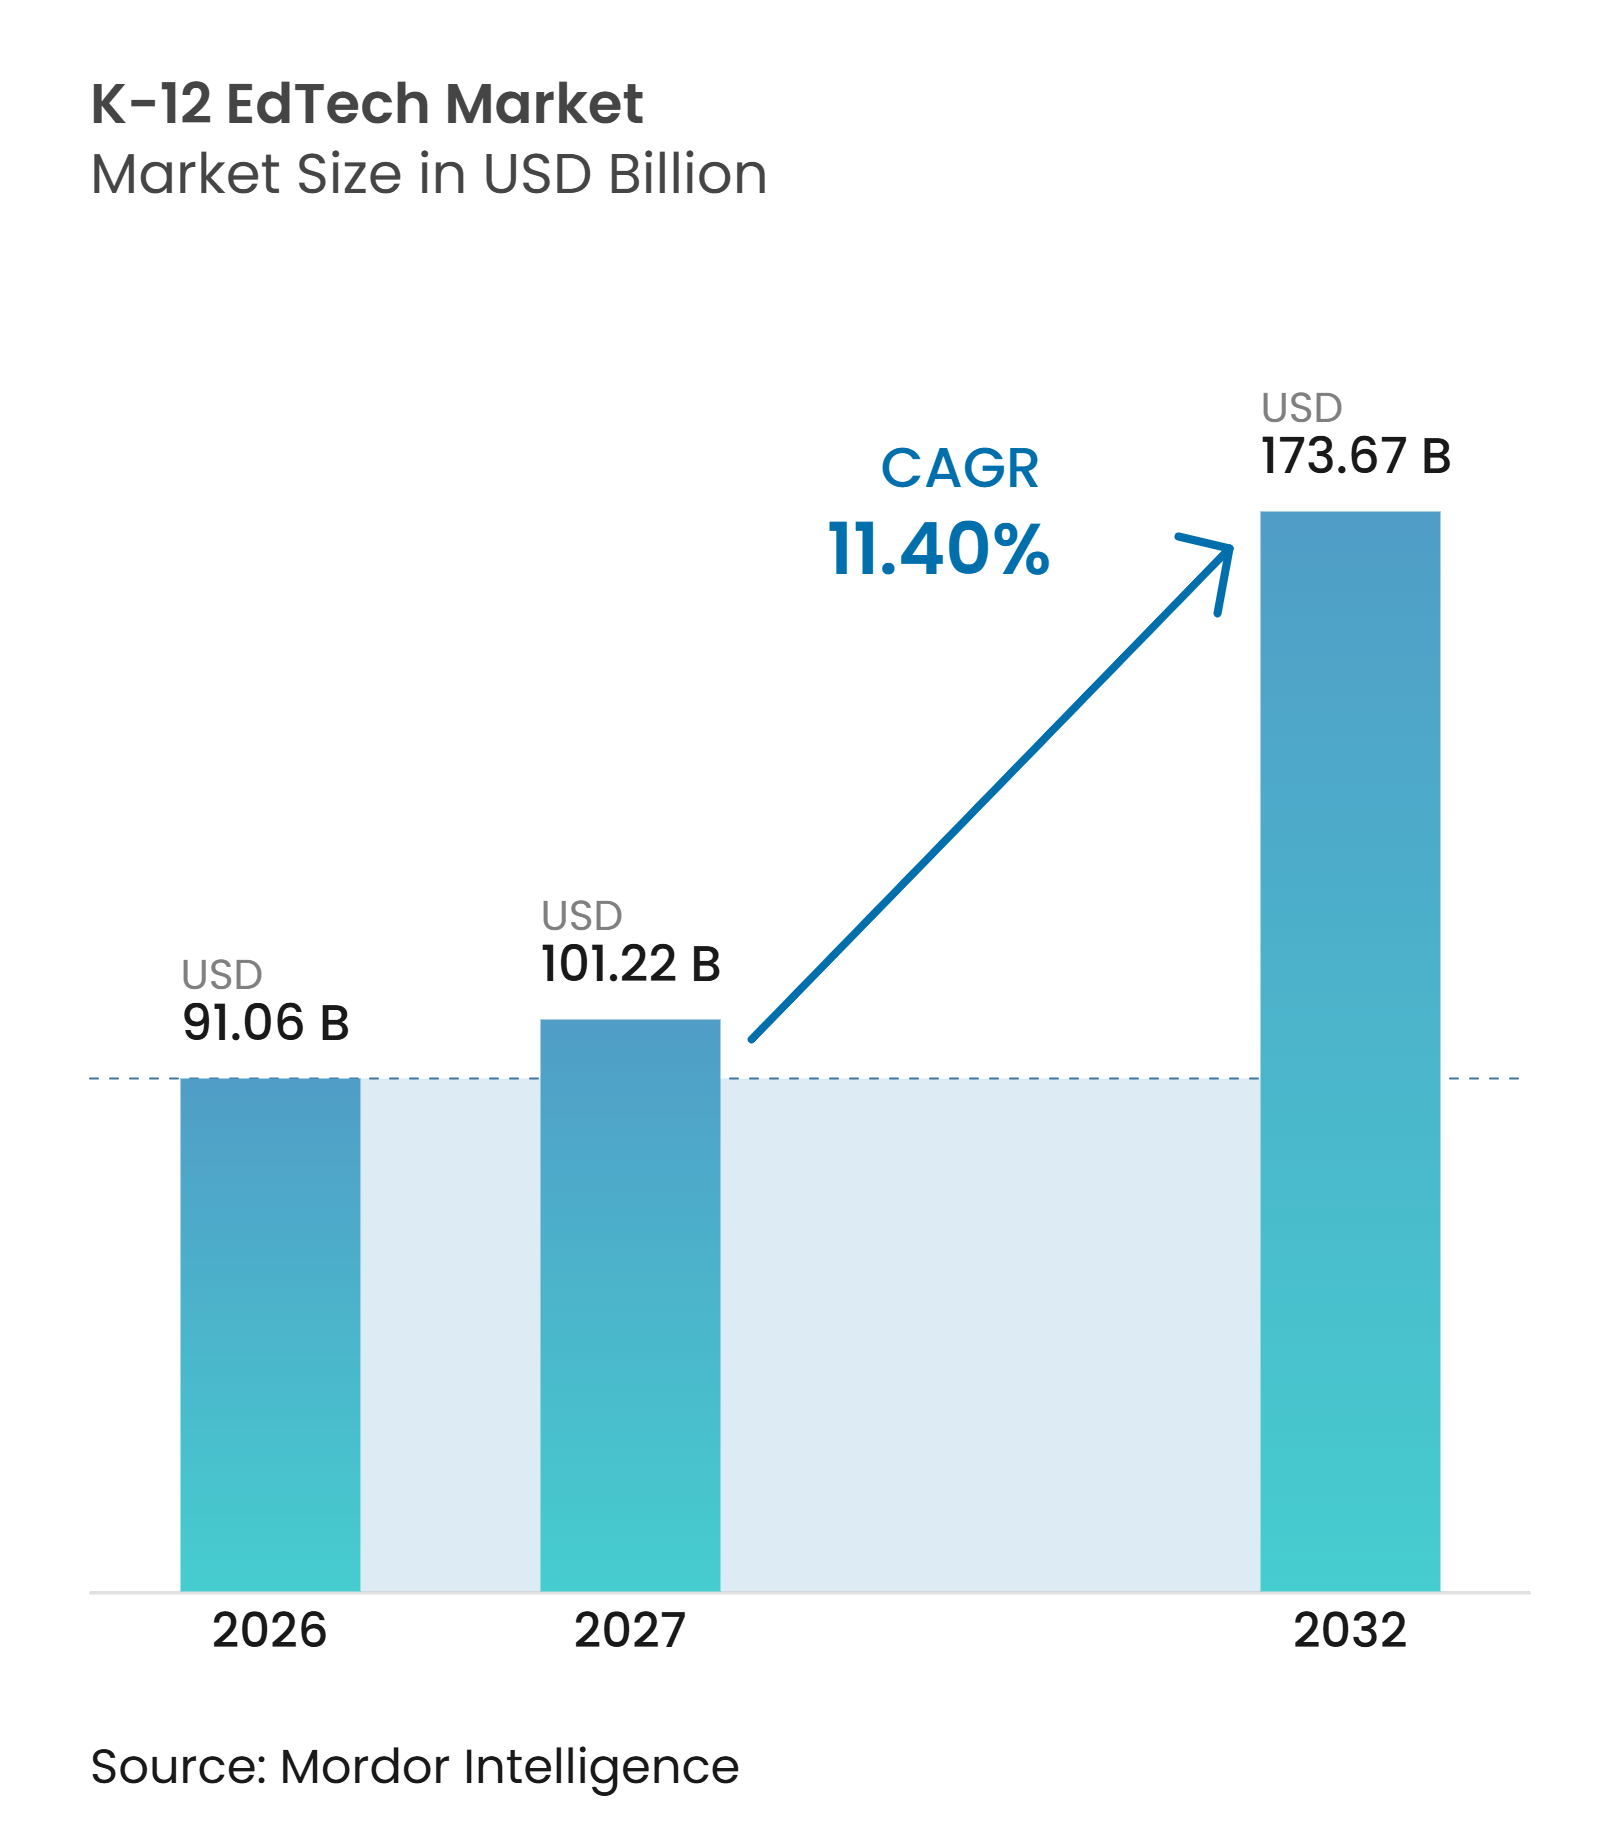
The global K-12 EdTech market size was valued at USD 91.06 billion in 2026 and is estimated to grow from USD 101.22 billion in 2027 to reach USD 173.67 billion by 2032, at a CAGR of 11.40% during the forecast period (2027-2032). The global K-12 EdTech market is moving from stand-alone classroom tools toward technology that supports curriculum, assessment, school administration, and teacher workflows. Government device programs and school connectivity funding remain important because they create the basic conditions for wider use of digital learning services. Cloud-based platforms and artificial intelligence tools are becoming more central to public education policy across the 37 jurisdictions covered by the OECD survey[1]. The opportunity is uneven across regions because established school systems are shifting spending toward software and personalized learning, while many lower-income systems still need devices and reliable connectivity. Data privacy, cybersecurity, teacher capacity, and lengthy public procurement processes continue to limit the speed at which the global K-12 EdTech market can grow.
Key Report Takeaways
- By type, hardware accounted for 39.20% of the global K-12 EdTech market share in 2026, while software is projected to grow at a 13.20% CAGR through 2032.
- By deployment model, cloud accounted for 67.30% of the global K-12 EdTech market share in 2026 and is projected to grow at a 14.23% CAGR through 2032.
- By learning mode, in-person technology-enabled learning accounted for 35.90% of the global K-12 EdTech market share in 2026, while self-paced learning is projected to grow at 14.44% CAGR through 2032.
- By end user, business customers accounted for 70.30% of the global K-12 EdTech market share in 2026, while consumer purchases are projected to grow at a 13.12% CAGR through 2032.
- By geography, North America accounted for 37.70% of the global K-12 EdTech market share in 2026, while Asia-Pacific is projected to grow at a 14.07% CAGR through 2032.
Note: Market numbers in this report are based on Mordor Intelligence's proprietary estimation framework, which combines nine months of actuals with Q4 projections for base year 2026.
Market Trends and Insights
Drivers Impact Analysis of K-12 EdTech Market*
| Driver | % Impact on CAGR Forecast | Geographic Relevance | Impact Timeline |
|---|---|---|---|
| Expansion of Cloud-Based and Digital Learning Infrastructure | +2.3% | Global, North America, Europe, and Asia-Pacific core | Medium term (2–4 years) |
| Government-Led School Digitization and Device Programs | +2.1% | Asia-Pacific, South America, the Middle East and Africa with spillover to North America and Europe | Short to medium term (1–4 years) |
| Demand for Personalized and Adaptive Learning | +1.8% | Global, early gains in North America, South Korea, Singapore | Medium term (2–4 years) |
| Growth of Online, Hybrid, and Blended Learning Models | +1.5% | North America, Europe, and Asia-Pacific | Short to medium term (1–4 years) |
| AI-Assisted Teacher Workflows and Administrative Automation | +1.2% | North America, Europe, South Korea, and Australia | Medium term (2–4 years) |
| Localized and Multilingual Content Creation Through Generative AI | +0.9% | The Middle East and Africa, South Asia, Southeast Asia, and South America | Long term (≥ 4 years) |
| Source: Mordor Intelligence | |||
Expansion of Cloud-Based and Digital Learning Infrastructure
Cloud infrastructure is increasingly becoming the operational foundation for procurement decisions in the global K-12 EdTech market. Cloud-based platform deployment was a central policy priority across the 37 jurisdictions participating in the OECD’s 2025 Policy Survey on School Education in the Digital Age. Cloud services provide schools with software updates, data backup, and storage without requiring districts to maintain local servers. This shifts budgets from large, periodic hardware purchases to recurring software subscriptions. Faria Education Group joined the Amazon Web Services Partner Network in August 2025 to strengthen the delivery of its education technology services across 155 countries and five regions[2]. Providers that meet privacy and security requirements through their cloud architecture can reduce the workload of school technology teams during vendor evaluations.
Government-Led School Digitization and Device Programs
Government procurement remains a major demand driver for hardware and enabling infrastructure in the global K-12 EdTech market. In 2025, the Philippines planned to distribute 64,816 laptop and smart TV packages worth PHP 1.913 billion (USD 0.032 billion) across 16 regions, alongside Google Workspace for Education Plus licenses[3]. India targeted 32,000 schools for Information and Communications Technology (ICT) and digital initiatives under Samagra Shiksha in FY 2025-26. The United Kingdom’s Connect the Classroom program reached nearly 1.5 million pupils across more than 3,700 schools. Guatemala introduced its Digital Transformation Policy for Education in June 2025, prioritizing connectivity, equipment, and teacher training. These initiatives often influence subsequent purchases of software, learning management systems, and educational content, as device procurements frequently include selected platforms or service licenses.
Demand for Personalized and Adaptive Learning
Personalized learning and teacher support tools are increasing the value schools expect from the global K-12 EdTech market. Singapore has integrated an Adaptive Learning System into its Student Learning Space platform to adjust mathematics and geography learning pathways based on student mastery. Microsoft’s 2025 survey found that 80% of educators used AI tools for school-related work, primarily for lesson planning, assessment creation, and administrative tasks. These applications position artificial intelligence as a teacher productivity tool, rather than solely a student-facing solution. Vendors that integrate assessment, grading, instructional content, and student data into school workflows can strengthen the case for institutional adoption.
Growth of Online, Hybrid, and Blended Learning Models
The global K-12 EdTech market continues to benefit from online, hybrid, and blended learning formats, although their use varies across school systems. During the 2024-25 school year, 389,891 students in Canada, representing 6.8% of the country’s 5.7 million K-12 students, participated in distance or online learning. Localized and multilingual content can expand access where standardized global content does not align with local languages or curricula. By the end of 2025, UNICEF’s Learning Passport reached 12.5 million learners and educators across 51 countries, demonstrating the potential of curriculum-aligned, offline-capable learning tools. However, these tools must deliver reliable educational outcomes, as poorly structured virtual learning models may make school districts more cautious about further adoption.
Restraints Impact Analysis of K-12 EdTech Market*
| Restraint | % Impact on CAGR Forecast | Geographic Relevance | Impact Timeline |
|---|---|---|---|
| Student Data Privacy, Cybersecurity, and Regulatory Compliance Risks | -1.8% | North America and European Union primarily; spreading globally | Short term (≤ 2 years) |
| Digital Divide and Unequal Device and Connectivity Access | -1.5% | The Middle East and Africa, South Asia, Southeast Asia, and South America | Long term (≥ 4 years) |
| Fragmented School Procurement and Long Public-Sector Sales Cycles | -1.2% | Global, particularly in fragmented federal systems | Medium term (2–4 years) |
| Teacher Workload, Change Fatigue, and Low Product Utilization | -0.9% | Global | Medium term (2–4 years) |
| Source: Mordor Intelligence | |||
Student Data Privacy, Cybersecurity, and Regulatory Compliance Risks
Student data governance constrains global K-12 EdTech market expansion, particularly in highly regulated school systems. The amended United States Children’s Online Privacy Protection Rule took effect on June 23, 2025, and covered organizations were required to comply by April 22, 2026. The rule strengthened requirements for collecting personal information from children under 13 and increased the importance of consent management in education products. The Consortium for School Networking (CoSN) 2025 report identified variations in district practices for data retention, encryption, and third-party agreements. UNICEF also noted that children’s learning data may be collected without adequate consent or protection in settings with limited data governance capacity. These requirements can lengthen sales cycles, increase product development costs, and favor providers that demonstrate mature privacy controls.
Digital Divide, Procurement Friction, and School Adoption Capacity
Access gaps remain a structural constraint on the global K-12 EdTech market, which requires devices, connectivity, budgets, and staff capacity to operate together. UNESCO reported that only 40% of primary schools worldwide had internet connectivity in 2023. By 2025, the International Telecommunication Union (ITU)-UNICEF Giga initiative had mapped approximately 2.2 million schools across 40 countries, while around 2.2 billion people globally remained offline[4]. UNICEF estimated that achieving universal digital learning in low- and middle-income countries would require USD 1.4 trillion in investment from 2021 to 2030. Decentralized school procurement can delay purchasing decisions, and high teacher workloads may limit product use after deployment. Suppliers need implementation support, teacher training, and content suited to local device capabilities and connectivity conditions rather than product access alone.
*Our forecasts treat driver/restraint impacts as directional, not additive. The impact forecasts reflect baseline growth, mix effects, and variable interactions.
Student & Learner Behavior Analysis
UNICEF estimates that 273 million children worldwide are out of school, while 600 million enrolled children lack minimum proficiency in reading and mathematics. These figures highlight opportunities for access-focused learning platforms and tools that strengthen foundational skills among enrolled students. In the United States, Stride’s FY2025 average enrollment increased by 20.4% to 234,000 students, while Career Learning enrollment grew by 32.5%. This growth reflected demand for flexible, career-oriented education alongside traditional K-12 education. Providers should measure learning outcomes and sustained engagement, rather than registrations alone, to demonstrate educational value and support renewals.
Household affordability constraints and public funding gaps influence demand for supplementary K-12 EdTech solutions. In the United States, 5.2% of students aged 5-17 received homeschooling or full-time virtual instruction in 2022-2023. Hybrid schools reported mean annual tuition of USD 5,743 and median annual tuition of USD 4,928 in 2024-2025. UNESCO estimates an annual education financing gap of USD 97 billion in low- and lower-middle-income countries. These pressures create opportunities for tiered subscriptions, affordable exam preparation, and school-licensed content. Local pricing and measurable learning gains are essential to demonstrate value without excluding lower-income households.
Education Performance Intelligence
Staffing disparities create varying requirements for K-12 EdTech adoption. UNESCO reported a global primary pupil-teacher ratio of 22.8:1 in 2022, rising to 37.8:1 in low-income countries, compared with 13.5:1 in high-income countries. These differences drive demand for digital tools that help teachers manage assessments and track student progress, particularly in understaffed education systems. However, technology cannot replace qualified teachers. Procurement decisions are therefore more likely to favor solutions that complement classroom instruction and align with existing teaching practices.
Connectivity disparities also affect K-12 EdTech deployment costs and accessibility. Global urban internet usage reached 85% in 2025, compared with 58% in rural areas. The gap was particularly pronounced in Africa, where usage reached 55% in urban areas and 21% in rural areas. In low-income countries, rural internet usage was 14%, compared with 39% in urban areas. Reliable school-level connectivity, device availability, and technical support remain critical adoption factors. Providers serving underserved regions must accommodate weak network coverage and limited infrastructure budgets, while urban markets can support bandwidth-intensive, cloud-based learning platforms.
K-12 EdTech Market Segment Analysis
By Type:
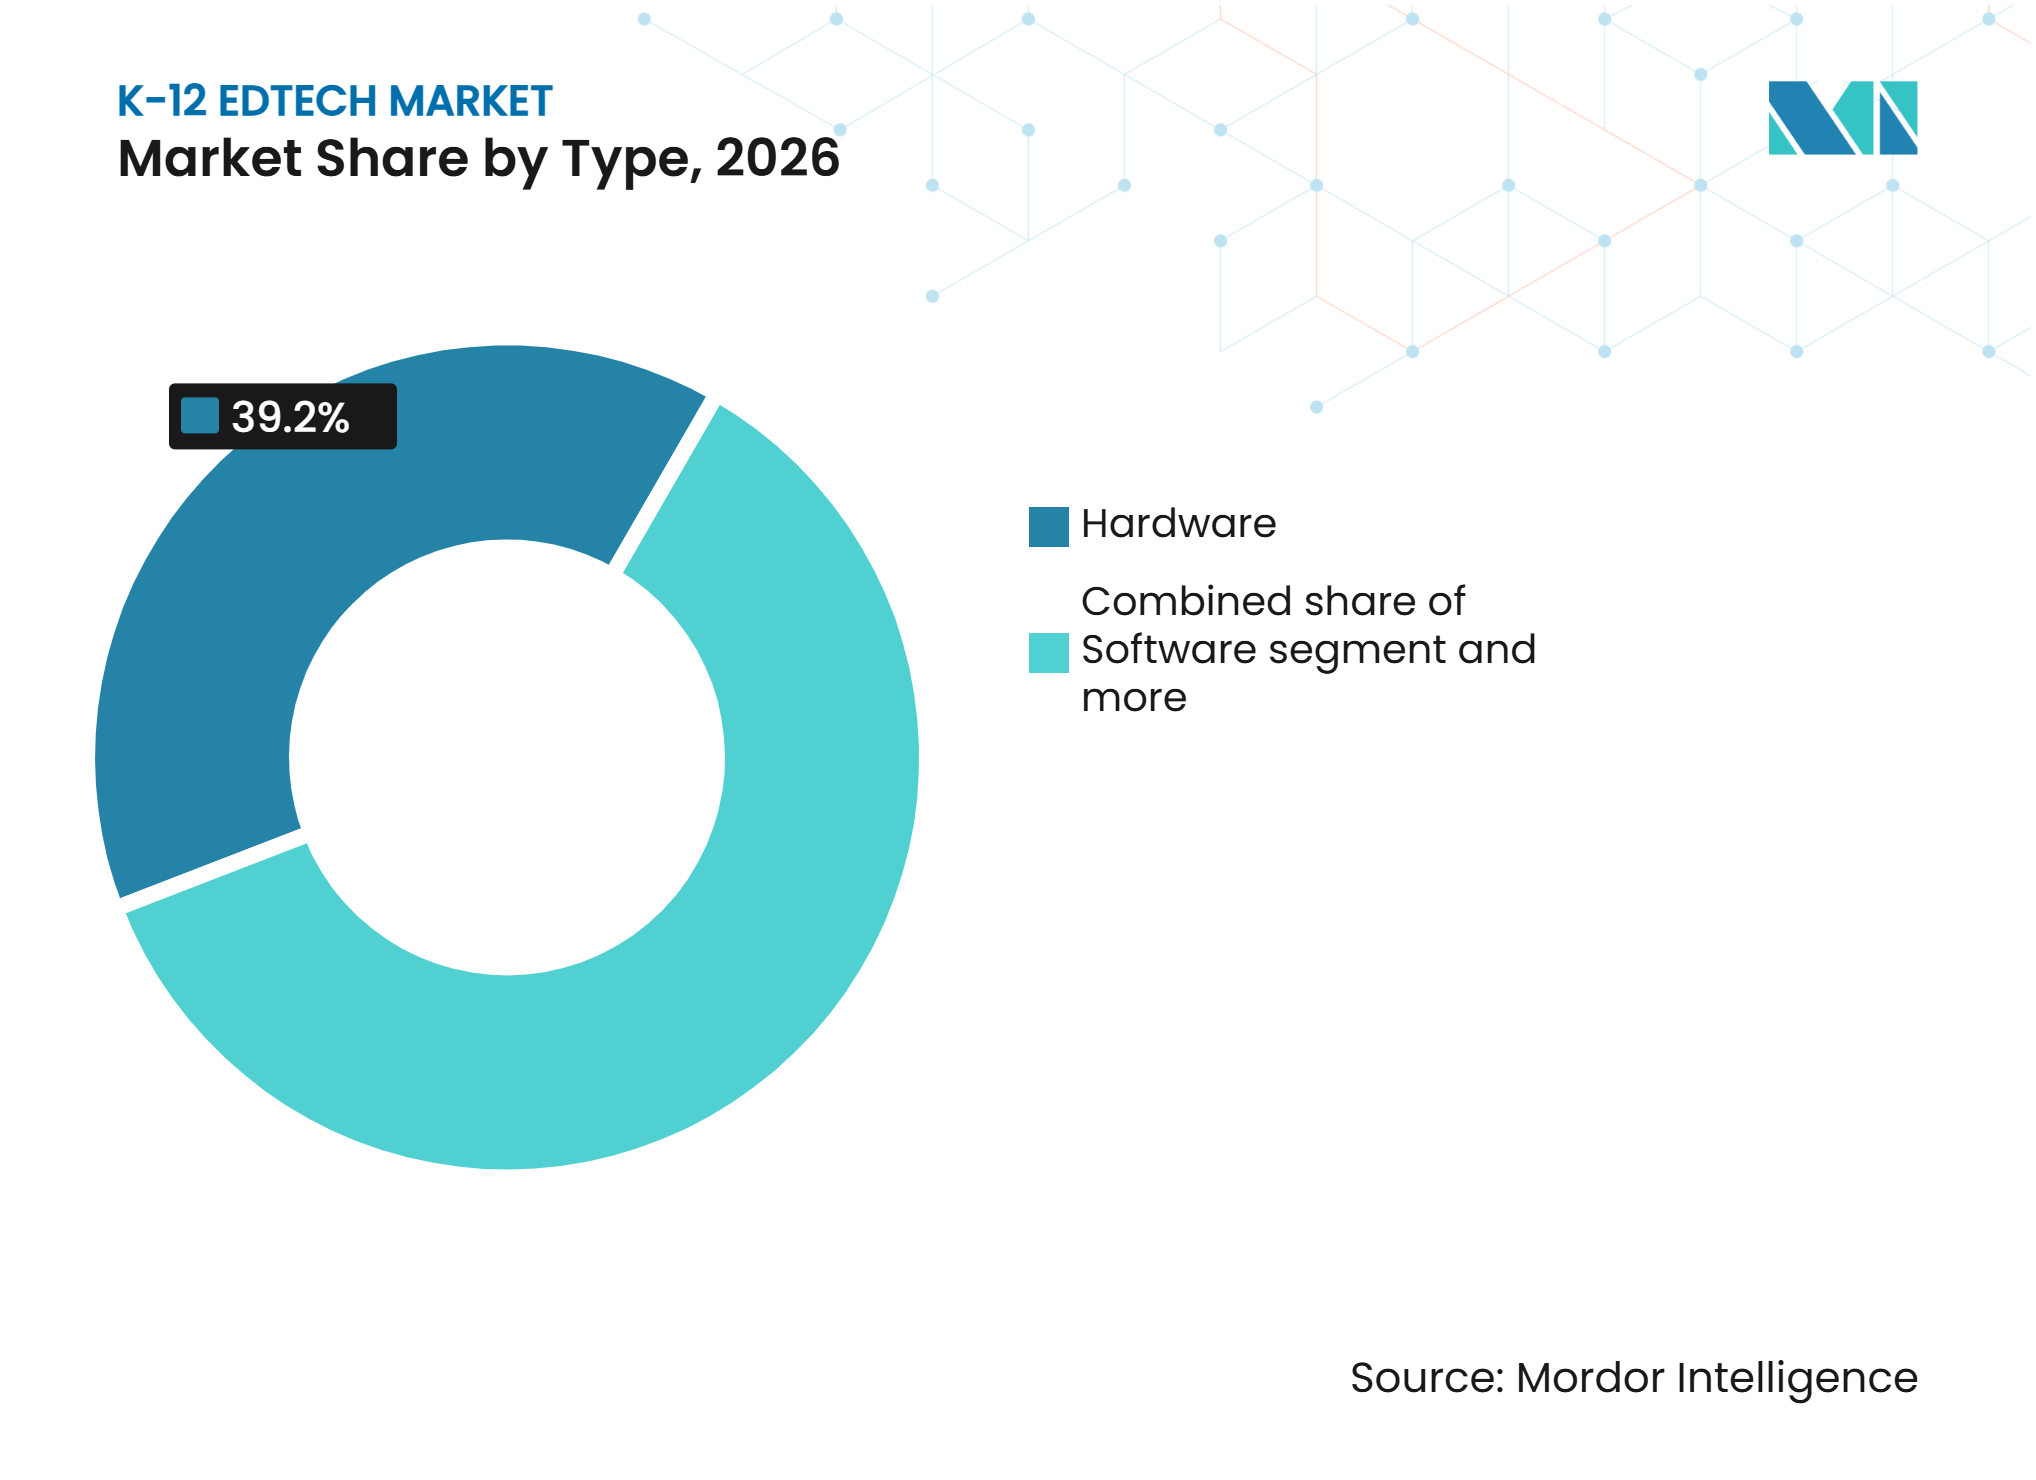
Software Expands as Hardware Remains the Largest CategoryHardware accounted for 39.20% of global K-12 EdTech market revenue in 2026, supported by government procurement across Asia-Pacific, Africa, and South America. Device programs remain essential where school-level student-to-device ratios are below target levels. The Philippines planned to distribute 64,816 laptop and smart television packages in 2025, reflecting continued institutional demand. National ICT lab and smart-classroom allocations also support equipment purchases. Hardware remains the entry point for digital instruction in many emerging systems, although its value increasingly depends on the platforms and content it supports.
Software is projected to grow at a 13.20% CAGR from 2027 to 2032, making it the fastest-growing type in the global K-12 EdTech market. Schools are increasing post-deployment spending on assessment, learning management, curriculum delivery, and administrative software. In June 2025, McGraw Hill and Pearson agreed to integrate Pearson’s PRoPL interim assessment into California Reveal Math for the 2025-2026 school year. In August 2025, Cengage expanded AI products across its K-12 portfolio and piloted an AI content leveler for educators. Publishers are combining digital textbooks, curriculum-aligned resources, and AI-supported materials, increasing switching costs by reducing separate products and disconnected teacher workflows.



By Deployment Model:
Cloud Combines Scale with Faster GrowthCloud deployment accounted for 67.30% of revenue in 2026 and is projected to grow at a CAGR of 14.23% through 2032. This indicates that cloud delivery has become core infrastructure for the global K-12 EdTech market rather than merely a deployment preference. An OECD survey identified cloud platforms as a policy priority across the education systems reviewed. Cloud architecture enables districts to deploy updates and services across multiple schools without extensive local infrastructure. It also supports storage, collaboration, and analytics in digital learning systems.
On-premises systems remain important where connectivity is unreliable, or data-localization requirements are stringent. China’s national digital education architecture operates under domestic data-governance requirements, demonstrating the continued relevance of local infrastructure in certain jurisdictions. Saudi Arabia’s Digital Government Authority identifies cloud computing as a key component of the education sector’s digital transformation framework. The choice between cloud and local deployment depends on connectivity, data regulations, and school-system capabilities. Suppliers must provide clear security, availability, and data-management practices for public procurement. Digital learning materials also increase demand for platforms accessible across classrooms, homes, and school devices.
By Learning Mode:
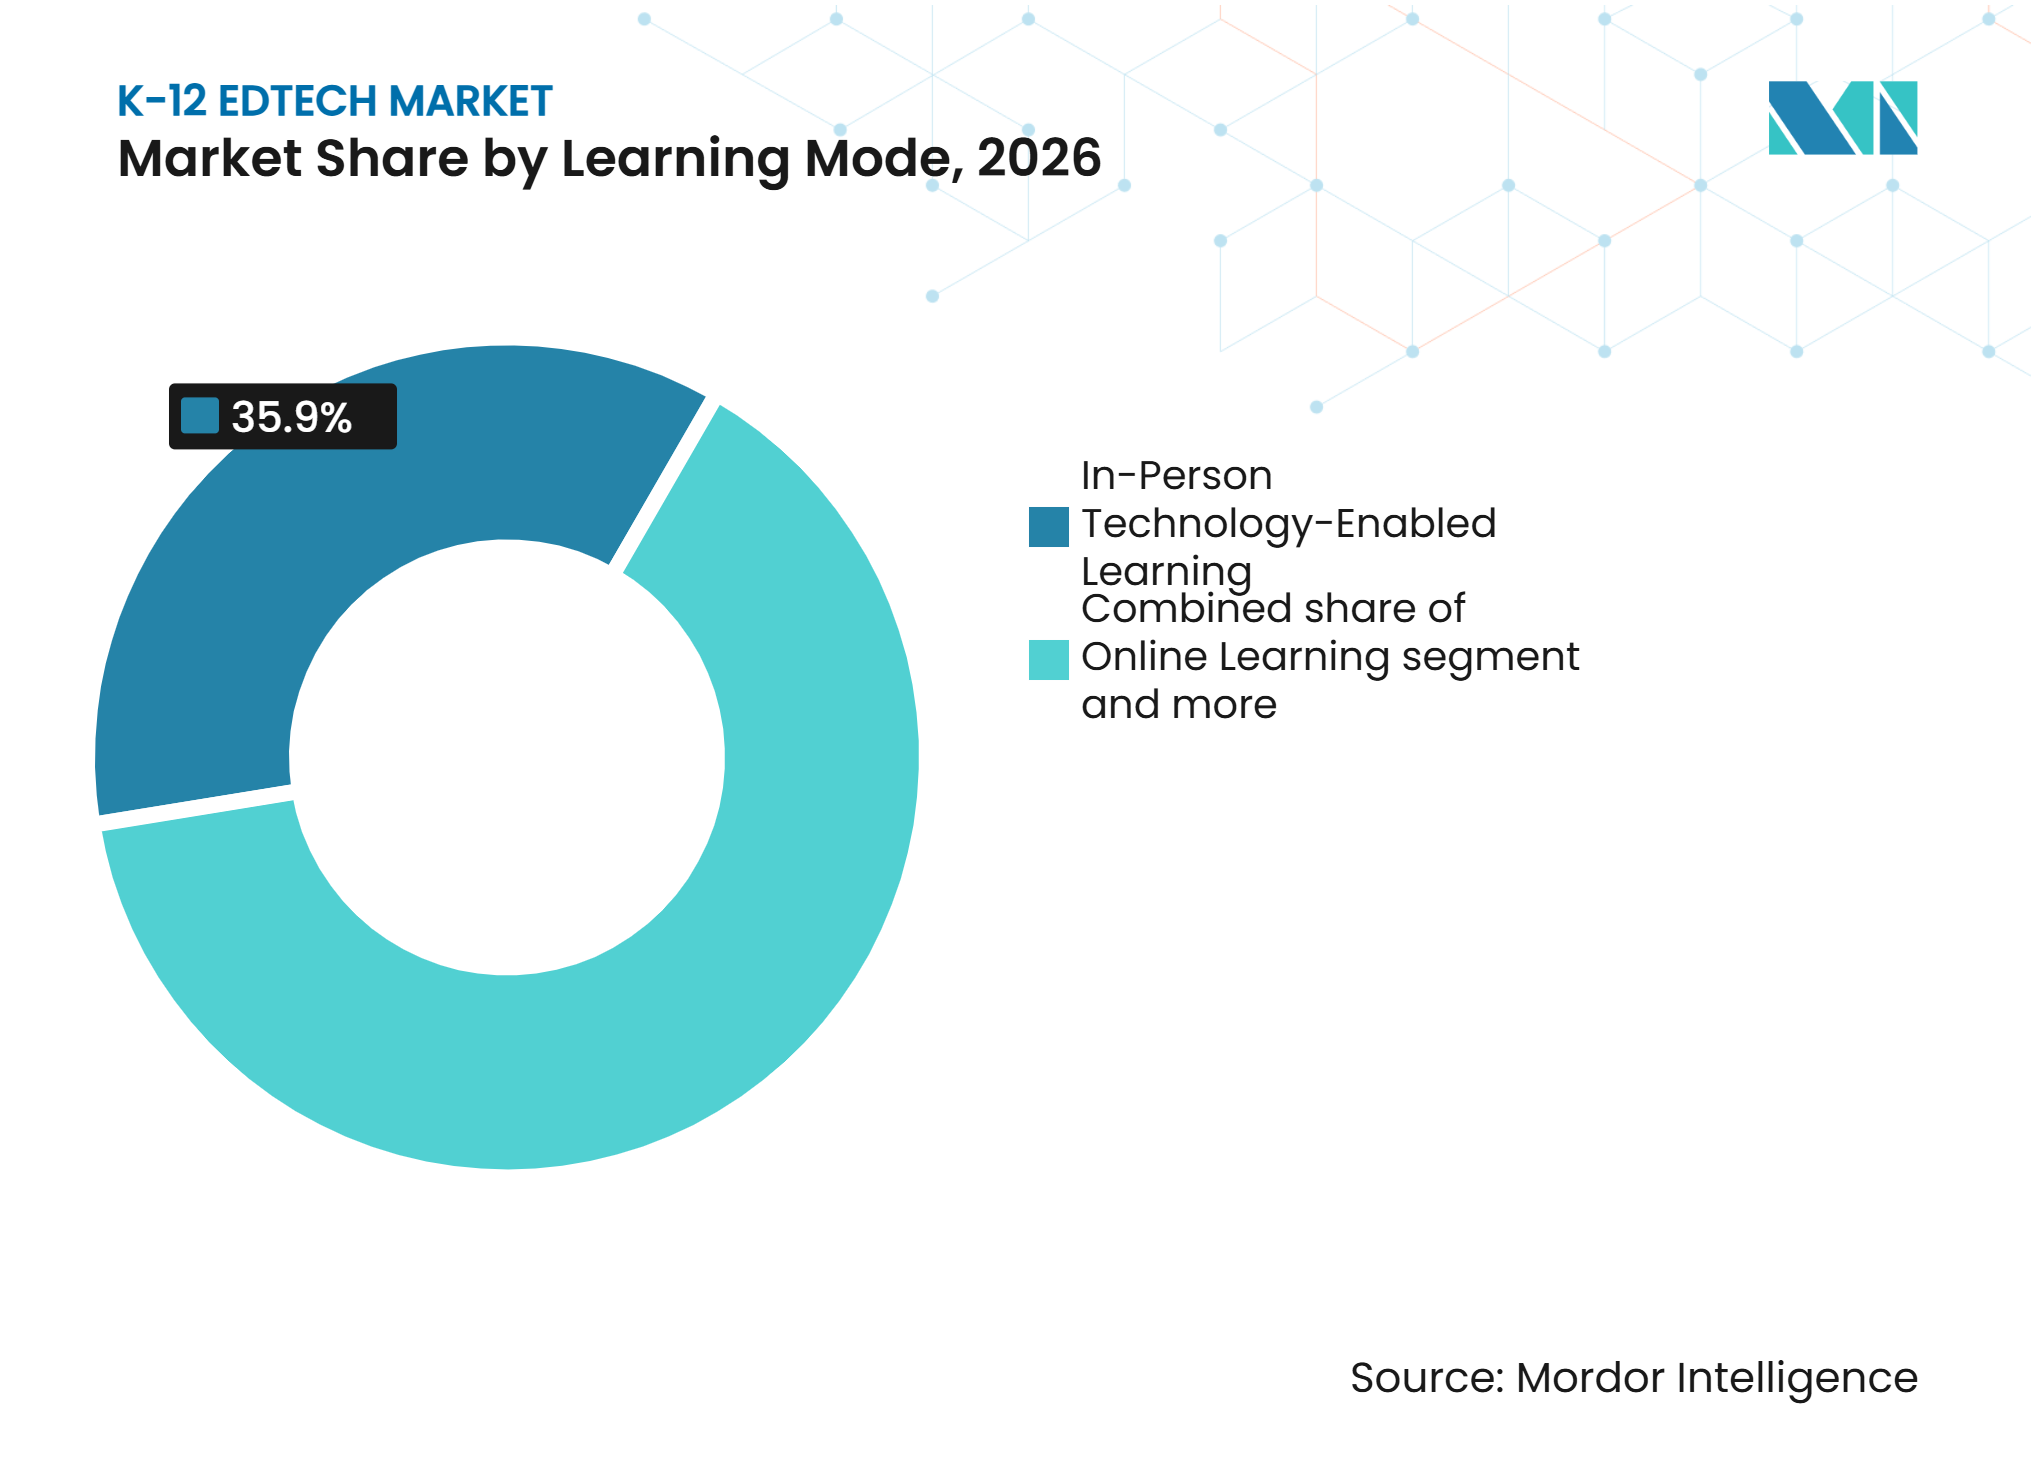
Classroom Technology Leads While Self-Paced Use GrowsIn-person technology-enabled learning accounted for 35.90% of revenue in 2026, making it the largest learning mode. The global K-12 EdTech market remains centered on physical classrooms, where teachers use digital curricula, assessments, smart classroom systems, and learning platforms. China’s AI-enabled education initiatives include 184 designated AI education base schools and seek to integrate technology into teaching and assessment. This model keeps teachers and schools central to delivery as data and learning services increasingly move to the cloud. It also helps districts oversee student data, content quality, and teacher support.
Self-paced learning is forecast to grow at a CAGR of 14.4% through 2032, driven by tools that allow students to progress at different speeds. A systematic review published in 2025 found that generative AI use in K-12 education was concentrated in STEM subjects and high school grades, where differentiated practice and content generation are relevant. Hybrid and online formats remain important for homeschooling, alternative schools, and areas with disrupted school attendance. Canada’s 2024-25 online participation rate of 6.8% indicates that distance learning retains a defined role after the emergency period. Effective offerings must balance school visibility into student progress with learner flexibility beyond scheduled lessons.

By End User:
Institutional Buyers Provide the Revenue BaseBusiness customers accounted for 70.30% of revenue in 2026, reflecting institutional procurement by schools and districts. These buyers purchase student information systems, learning platforms, digital curricula, assessment tools, connectivity, and devices. The United States E-Rate program had a fiscal year 2025 funding cap of USD 5.058 billion, supporting broadband and internal connections in schools and libraries. FCC and Universal Service Administrative Company (USAC) institutional contracts can provide stable revenue after providers meet privacy, accessibility, procurement, and technical integration requirements. However, securing these contracts can take longer because school boards, technology teams, and teaching staff may influence decisions.
Consumer purchases are projected to grow at a 13.12% CAGR through 2032. Demand includes supplemental learning, tutoring, exam preparation, learning devices, and curricula purchased by families. TAL Education Group’s fiscal year 2025 results showed continued demand in China for enrichment programs, AI learning devices, and smart study tools. Homeschooling and hybrid schooling communities also purchase digital course content and assessment services directly. Institutional and consumer channels are converging as parent-purchased tools enter schools and school platforms extend beyond classrooms. Providers serving both channels need to deliver value to teachers and parents while maintaining consistent privacy practices.
Geography Analysis
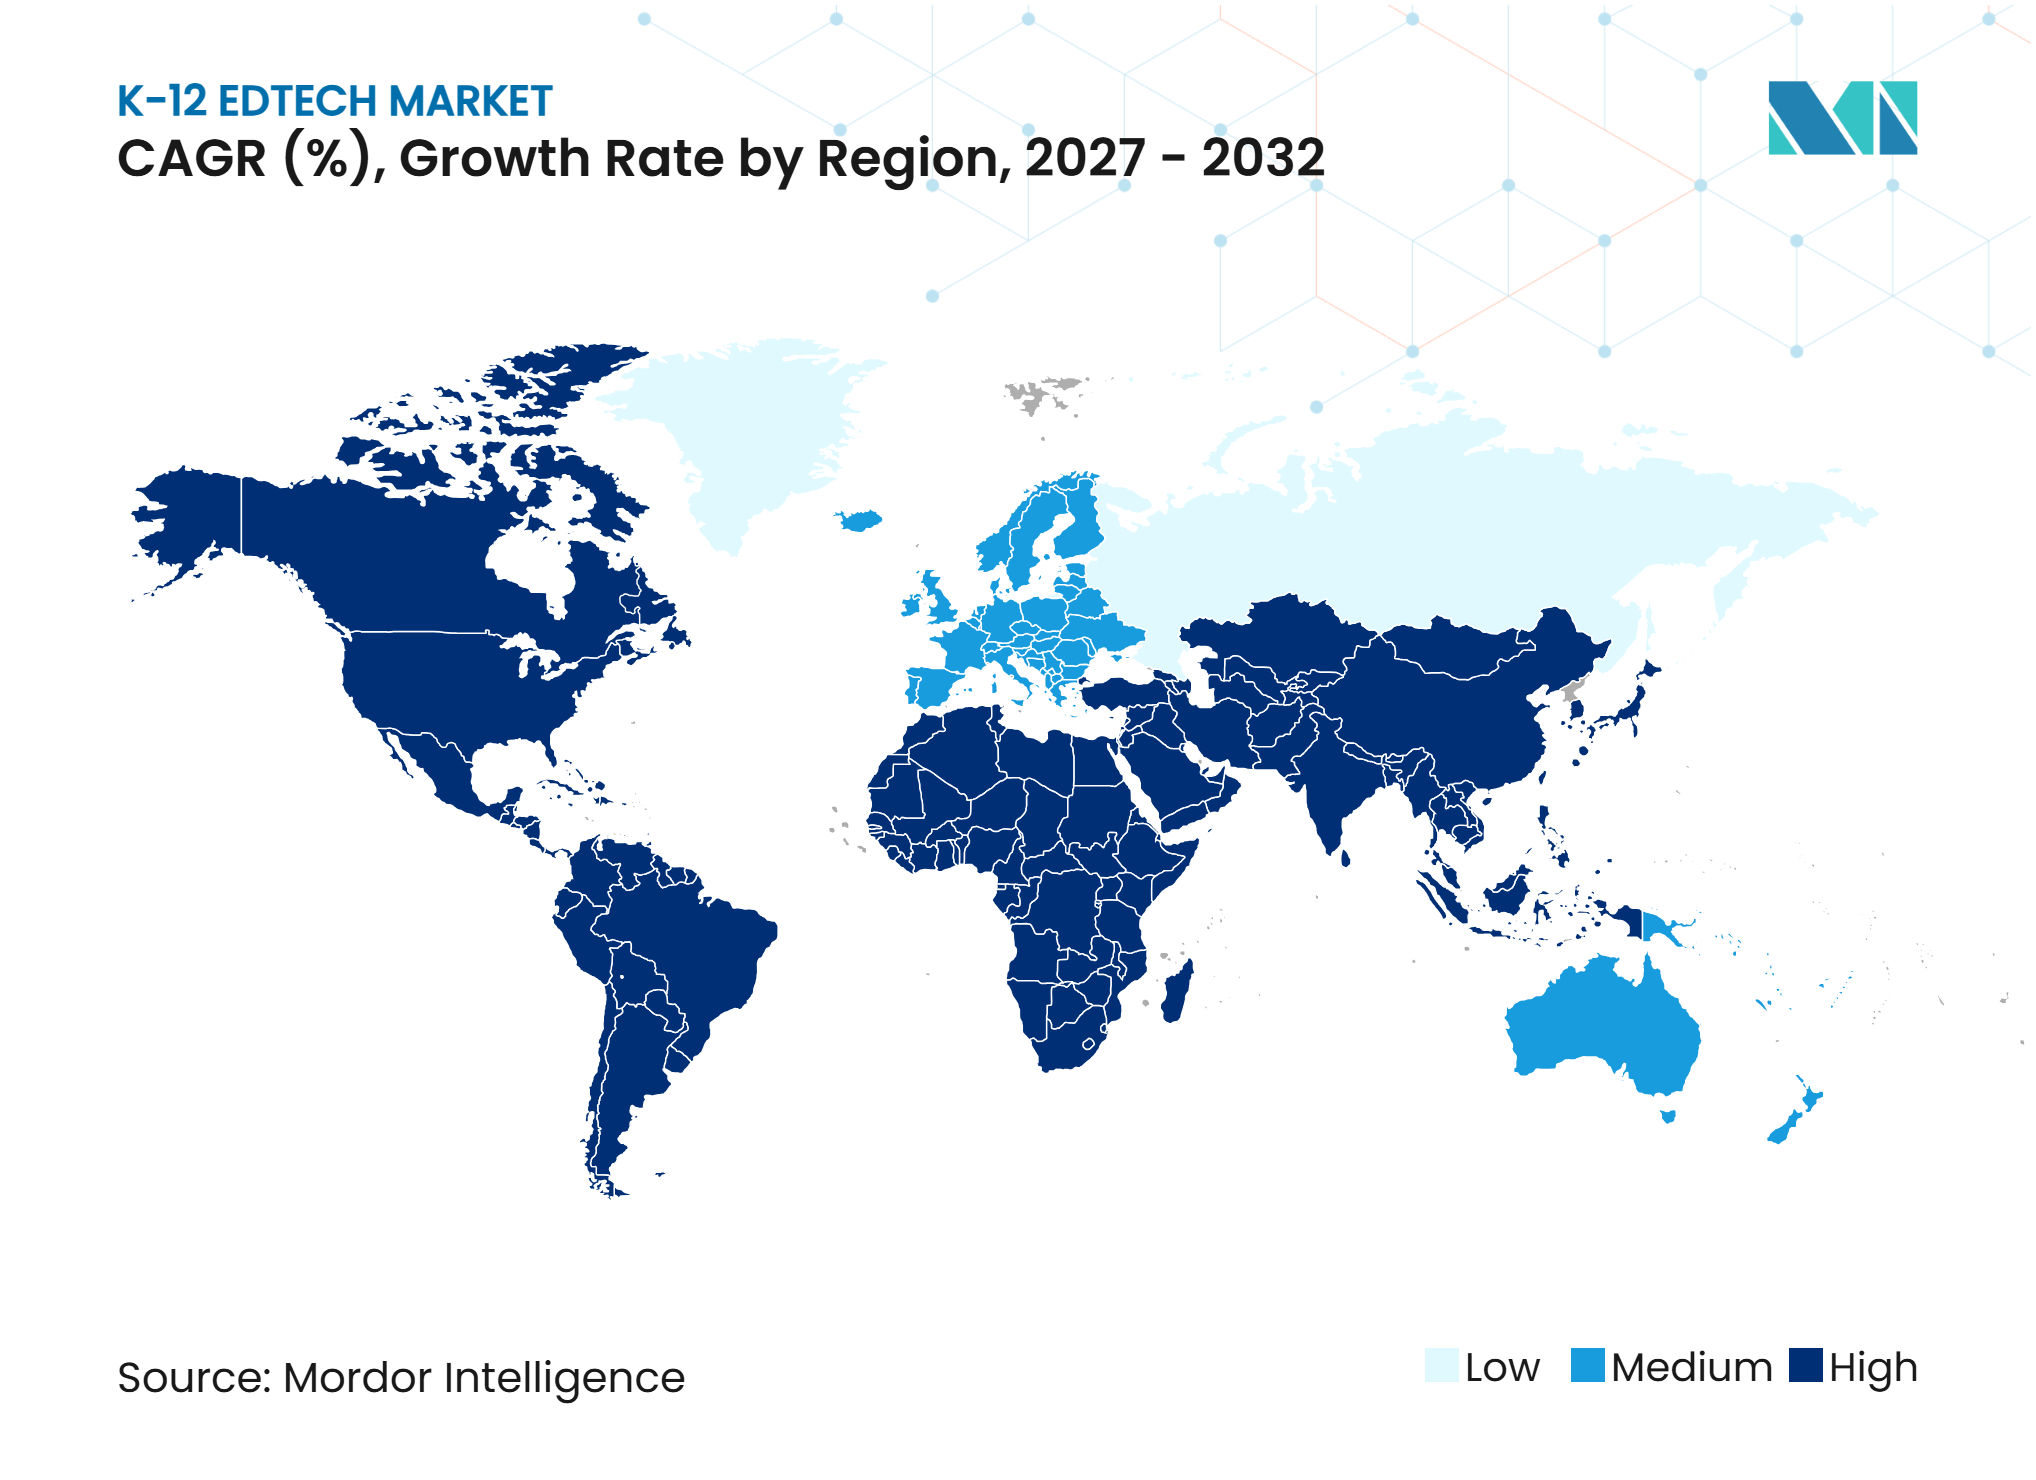
North America held 37.7% of global K-12 EdTech market revenue in 2026, supported by established digital infrastructure and institutional purchasing capacity. In the United States, E-Rate’s USD 5.058 billion fiscal 2025 funding cap supports broadband, internal connections, cloud software, and AI tools. Canada’s 2024-2025 online learning participation reached 6.8% of K-12 enrollment, led by British Columbia. The amended COPPA Rule increases data and consent obligations, favoring suppliers with strong governance controls.
Asia-Pacific is projected to grow at a 14.07% CAGR during 2027–2032, the fastest regional rate. China is expanding digital education platforms and AI education bases, while India allocated INR 32.21 billion (USD 0.36 billion) for ICT labs and smart classrooms in fiscal 2025-2026. Singapore and South Korea demonstrate mature adoption, while the Philippines combines devices, training, and connectivity programs. Europe’s GDPR raises deployment costs and data protection standards. The United Kingdom’s Connect the Classroom program reached nearly 1.5 million pupils in over 3,700 schools by 2025. Systems in Latin America, the Middle East, and Africa, such as Guatemala and Saudi Arabia, require differentiated models to varying infrastructure and policy conditions.
Education Infrastructure & Development Intelligence
Global education expenditure reached USD 5.8 trillion in 2022, while government spending per capita ranged from USD 55 in low-income countries to USD 8,532 in high-income countries. India allocated INR 32.21 billion (USD 0.36 billion) for ICT labs and smart classrooms in FY 2025-2026. Pearson acquired eDynamic Learning for USD 225 million in 2025, and Stride’s revenue increased 17.9% to USD 2.41 billion in FY2025. These developments highlighted opportunities for integrated curricula and digital learning services.
In March 2025, China upgraded its Smart Education platform to version 2.0, designated 184 schools as AI education bases, and recorded more than 50 million views for Hunan’s Smart Fun Classroom. UNICEF’s Learning Passport reached 12.5 million learners and educators across 51 countries in 2025, supporting demand for curriculum-aligned, offline-capable platforms. These initiatives favored suppliers offering AI-enabled content, localized curricula, and low-connectivity access.
Competitive Landscape
Market Concentration
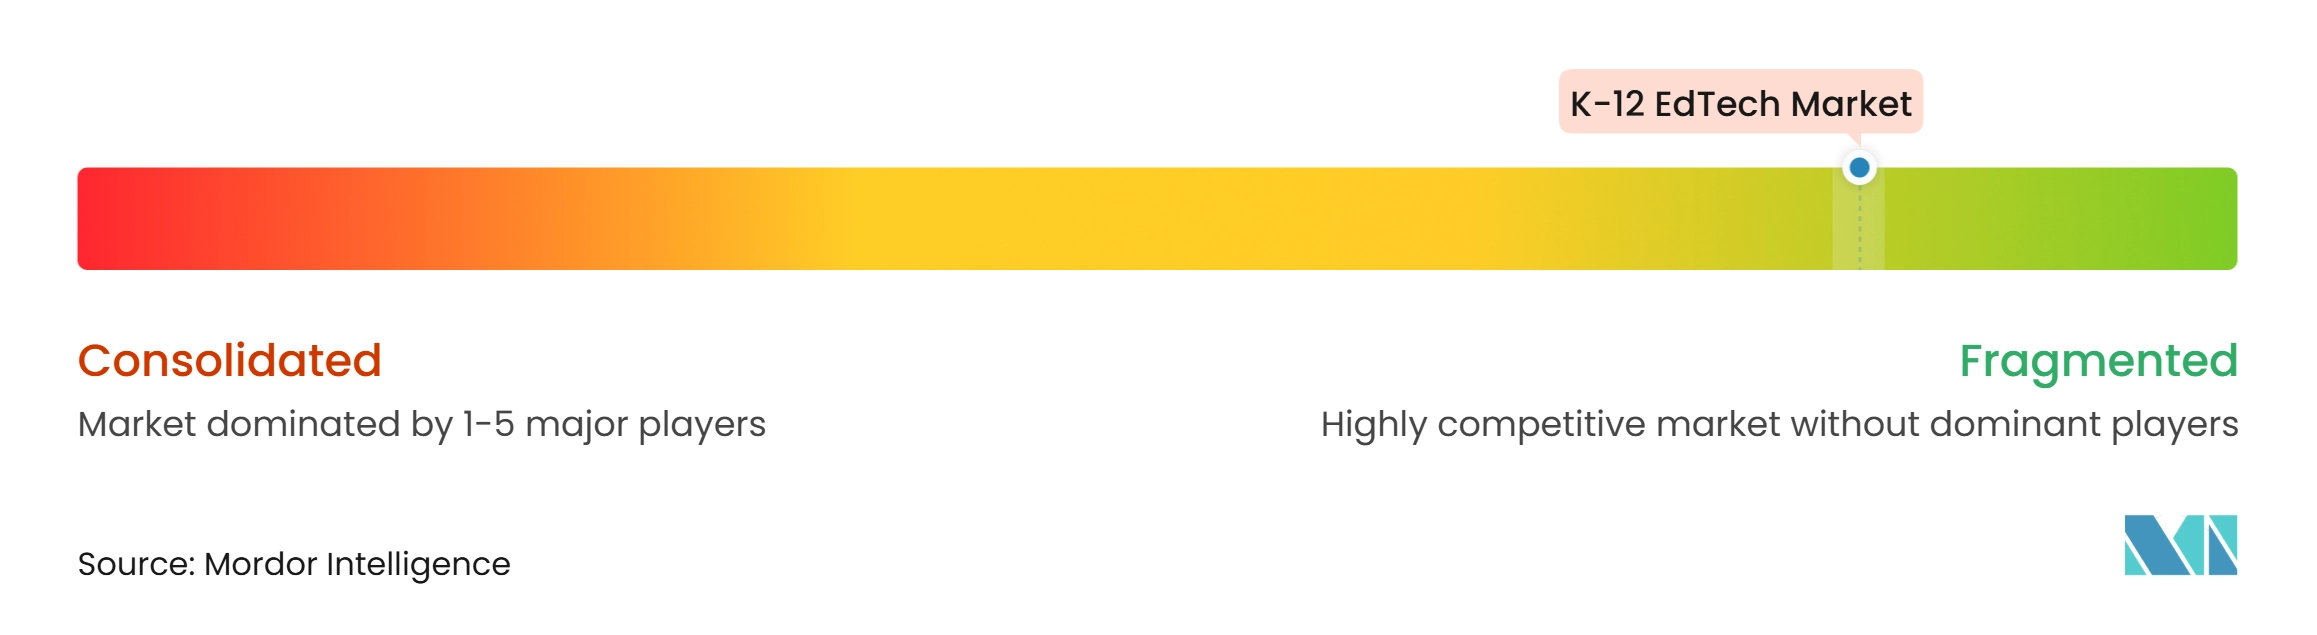
The global K-12 EdTech market includes regional, nonprofit, open-source, specialist, publisher, and technology providers. Pearson, McGraw Hill, Cengage, Stride, and TAL Education Group use content, services, and technology to meet school and family demands. Pearson and McGraw Hill announced a collaboration in June 2025 to integrate PRoPL assessment capabilities into California Reveal Math. The collaboration combines curriculum and interim assessment in a single teacher workflow, reducing disconnected products and increasing the need for interoperable data and integrated reporting.
Cengage unified seven K-12 brands under the Cengage School name in December 2025. Its portfolio includes curriculum, library resources, and professional development through a single discovery and procurement structure. McGraw Hill acquired Essaypop in March 2025, adding formative assessment and instructional tools to its digital curriculum portfolio. Pearson acquired eDynamic Learning in 2025 for USD 225 million, expanding its career and technical education capabilities. Data protection and implementation capacity differentiate providers. COPPA amendments and district data governance practices make consent, security, retention, and third-party controls important in vendor selection. The market remains competitive, without a small group of companies controlling most global demand.
K-12 EdTech Industry Leaders
-
Pearson plc
-
McGraw Hill Education
-
Cengage Group
-
Stride, Inc.
-
TAL Education Group
- *Disclaimer: Major Players sorted in no particular order
K-12 EdTech Market Companies Covered in this Report
- Pearson plc
- McGraw Hill Education
- Cengage Group
- Stride, Inc.
- TAL Education Group
- Blackboard Inc.
- PowerSchool Group LLC
- Instructure, Inc.
- Microsoft Corporation
- Google LLC
- Apple Inc.
- Amazon Web Services, Inc.
- IBM Corporation
- Discovery Education, Inc.
- D2L Corporation
- Kahoot! ASA
- Sanoma Corporation
- BYJU'S
- Duolingo, Inc.
- Quizlet, Inc.
Recent Industry Developments in K-12 EdTech Market
- September 2026: McGraw Hill acquired Teachally to expand its AI-powered K-12 curriculum development capabilities. The acquisition supports faster curriculum production, localization, and translation, enabling teachers to customize standards-aligned lessons and assessments.
- December 2025: Cengage Group unified its K-12 portfolio under the Cengage School brand, bringing 7 brands, including National Geographic Learning, Big Ideas Learning, Gale, Qubits Learning, and Visible Body, under a single discovery and procurement portal.
- September 2025: Pearson and Cognizant announced a global multiyear strategic partnership to enhance Pearson learner platforms with generative and agentic AI, cloud-native microservices, and AI-driven business process automation.
- March 2025: McGraw Hill acquired EssayPop, a cloud-based K-12 writing platform that adds AI-enhanced formative writing assessment, guided instructional tools, and K-12 writing resources to its digital curriculum portfolio.
Global K-12 EdTech Market Report Scope
The global K-12 EdTech market report examines digital education technologies and services supporting teaching, learning, assessment, and school administration across K-12 education systems worldwide. The market is segmented by type (Hardware, Software, and Content), deployment model (Cloud and On-Premises), learning mode (Online Learning, In-Person Technology-Enabled Learning, Blended and Hybrid Learning, Self-Paced Learning, and Other Learning Modes), end user (Business and Consumer), and geography.
The study analyzes key drivers, including cloud-based learning infrastructure, government-led school digitization, personalized and adaptive learning, blended education, AI-assisted teaching workflows, and generative AI-enabled multilingual content creation. It also assesses restraints such as student data privacy and cybersecurity risks, unequal device and connectivity access, fragmented school procurement, long public-sector sales cycles, and low product utilization after implementation. The report evaluates education infrastructure and development, government spending, private-sector investment, student-teacher ratios, institutional density, student enrollment, education spending, regulatory requirements, technological developments, and competitive forces. It provides market size and growth forecasts, regional and country-level analysis, competitive landscape, market concentration, market share, strategic developments, and company profiles. It also explores opportunities in low-bandwidth, offline-first multilingual learning platforms and trusted AI solutions for personalized learning, assessment, and teacher productivity. Market estimates and forecasts are presented in value (USD) across all covered segments.
Segmentation Overview
Key Questions Answered in the Report
What is the projected value of the global K-12 EdTech sector by 2032?
The sector is forecast to reach USD 173.67 billion by 2032, growing at an 11.40% CAGR from 2027.
Which K-12 EdTech type is growing fastest?
Software is projected to grow at a 13.20% CAGR through 2032 as schools increase spending on digital curriculum, assessment, and administrative platforms.
Why is cloud delivery important for schools?
Cloud accounted for 67.30% of revenue in 2026 and is projected to grow at a 14.23% CAGR because it supports scalable deployment, updates, storage, and collaboration.
Which region has the strongest growth outlook for K-12 digital learning?
Asia-Pacific is projected to grow at a 14.07% CAGR through 2032, supported by China’s AI education program and India’s ICT investment.
What limits adoption of education technology in schools?
Key constraints include data privacy and cybersecurity requirements, unequal connectivity and device access, procurement delays, and teacher workload.
How are major providers changing their K-12 offerings?
Providers are combining curriculum, assessment, AI tools, teacher support, and cloud delivery through acquisitions, product launches, and platform integrations.