
Grid Connected PV Systems Market Size and Share
Market Overview
| Study Period | 2022 - 2032 |
|---|---|
| Market Volume (2027) | 4.05 terawatt |
| Market Volume (2032) | 14.62 terawatt |
| Growth Rate (2026 - 2031) | 29.27 % |
| Fastest Growing Market | Europe |
| Largest Market | Asia-Pacific |
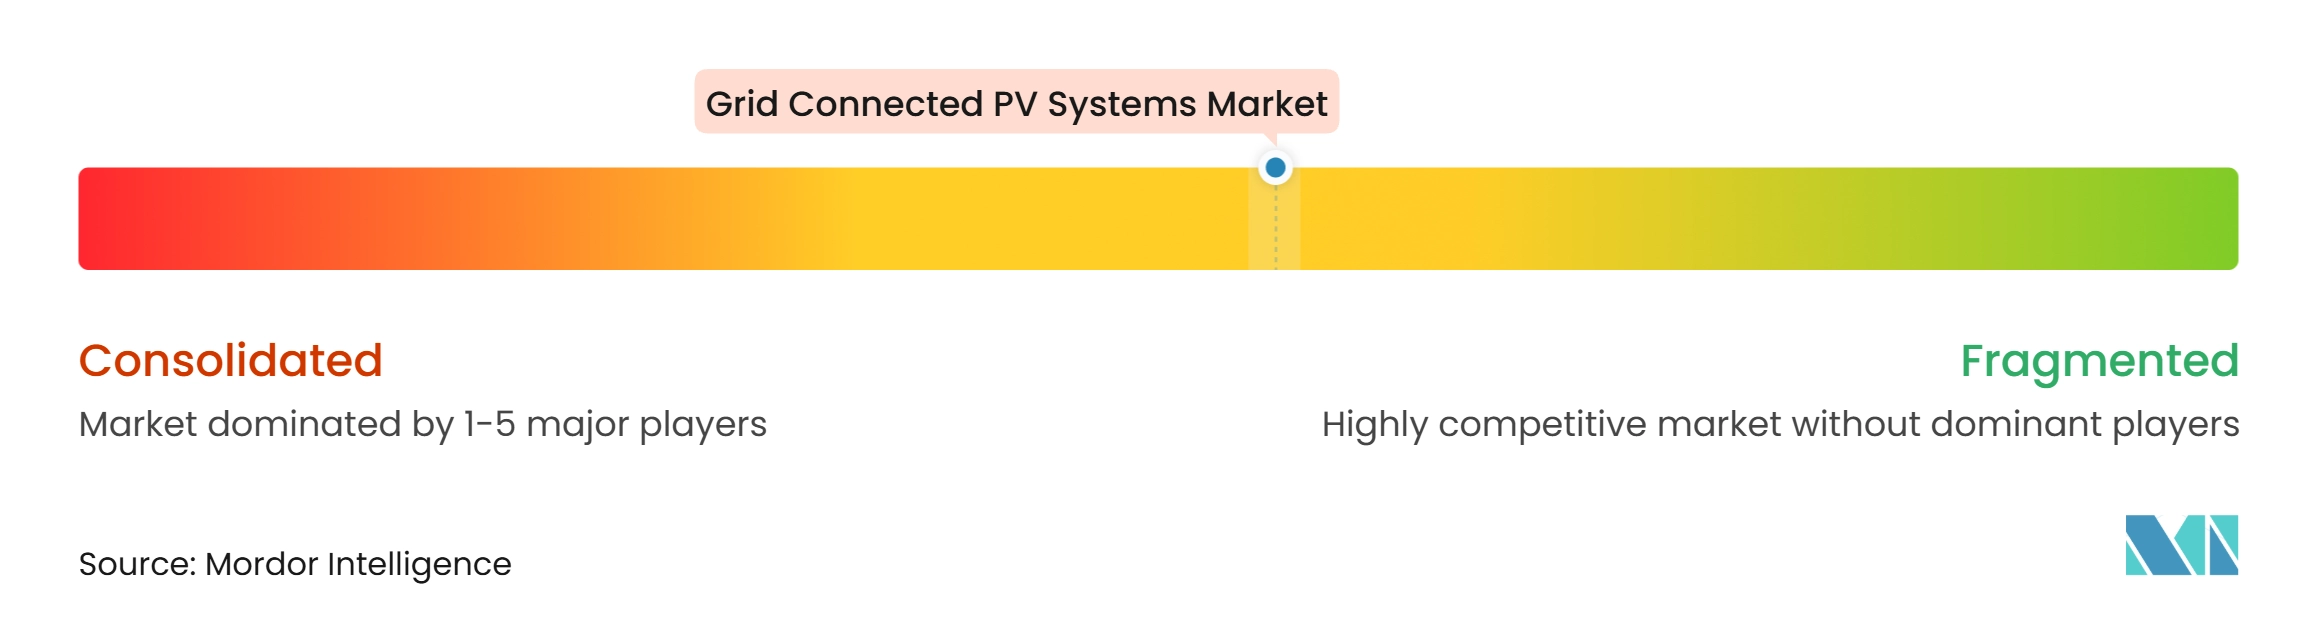
| Market Concentration | Medium |
Major Players *Disclaimer: Major Players sorted in no particular order Image © Mordor Intelligence. Reuse requires attribution under CC BY 4.0. | |
Grid Connected PV Systems Market Analysis by Mordor Intelligence
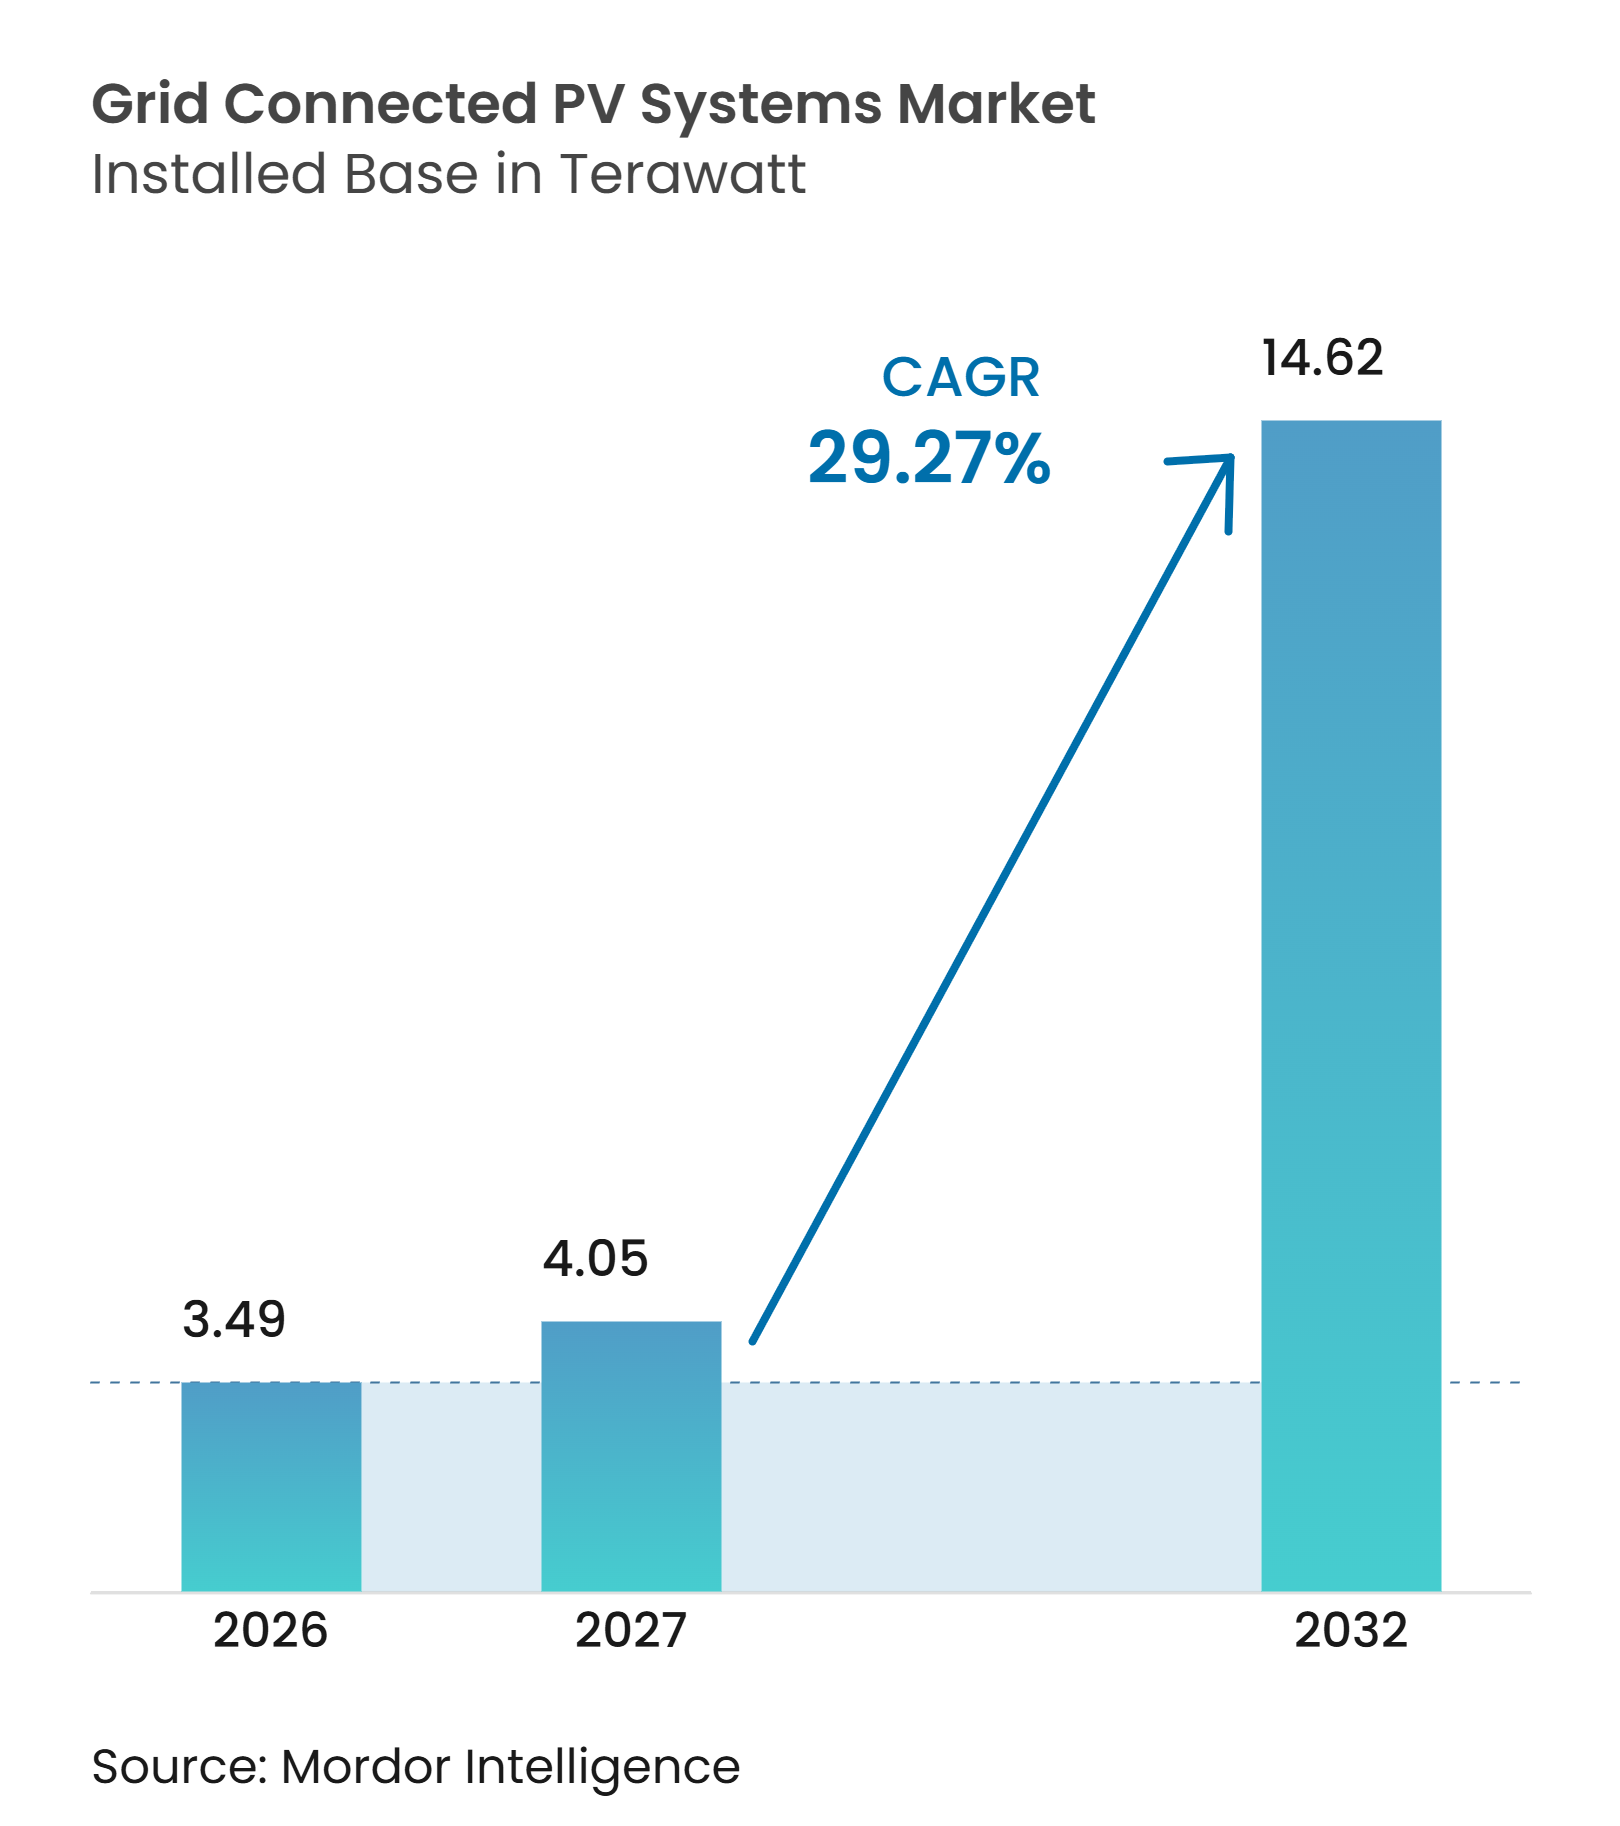
The Grid Connected PV Systems Market size in terms of installed base was valued at 3.49 terawatt in 2026 and is estimated to grow from 4.05 terawatt in 2027 to reach 14.62 terawatt by 2032, at a CAGR of 29.27% during the forecast period (2027-2032). Lower generation costs continue to support the market, although the cost advantage now depends as much on financing, grid access, and storage as on module pricing. Global solar additions remained high in 2025, and cumulative solar capacity approached 3 TW, widening the base of operating assets that must be integrated into power systems.[1] Procurement is increasingly shaped by the ability to secure connection capacity, manage output, and meet performance requirements. This shifts the competitive focus from module cost alone toward inverters, trackers, storage integration, and operating software. The market therefore offers opportunities for suppliers and developers that can address generation, interconnection, and grid-service needs together.
Key Report Takeaways
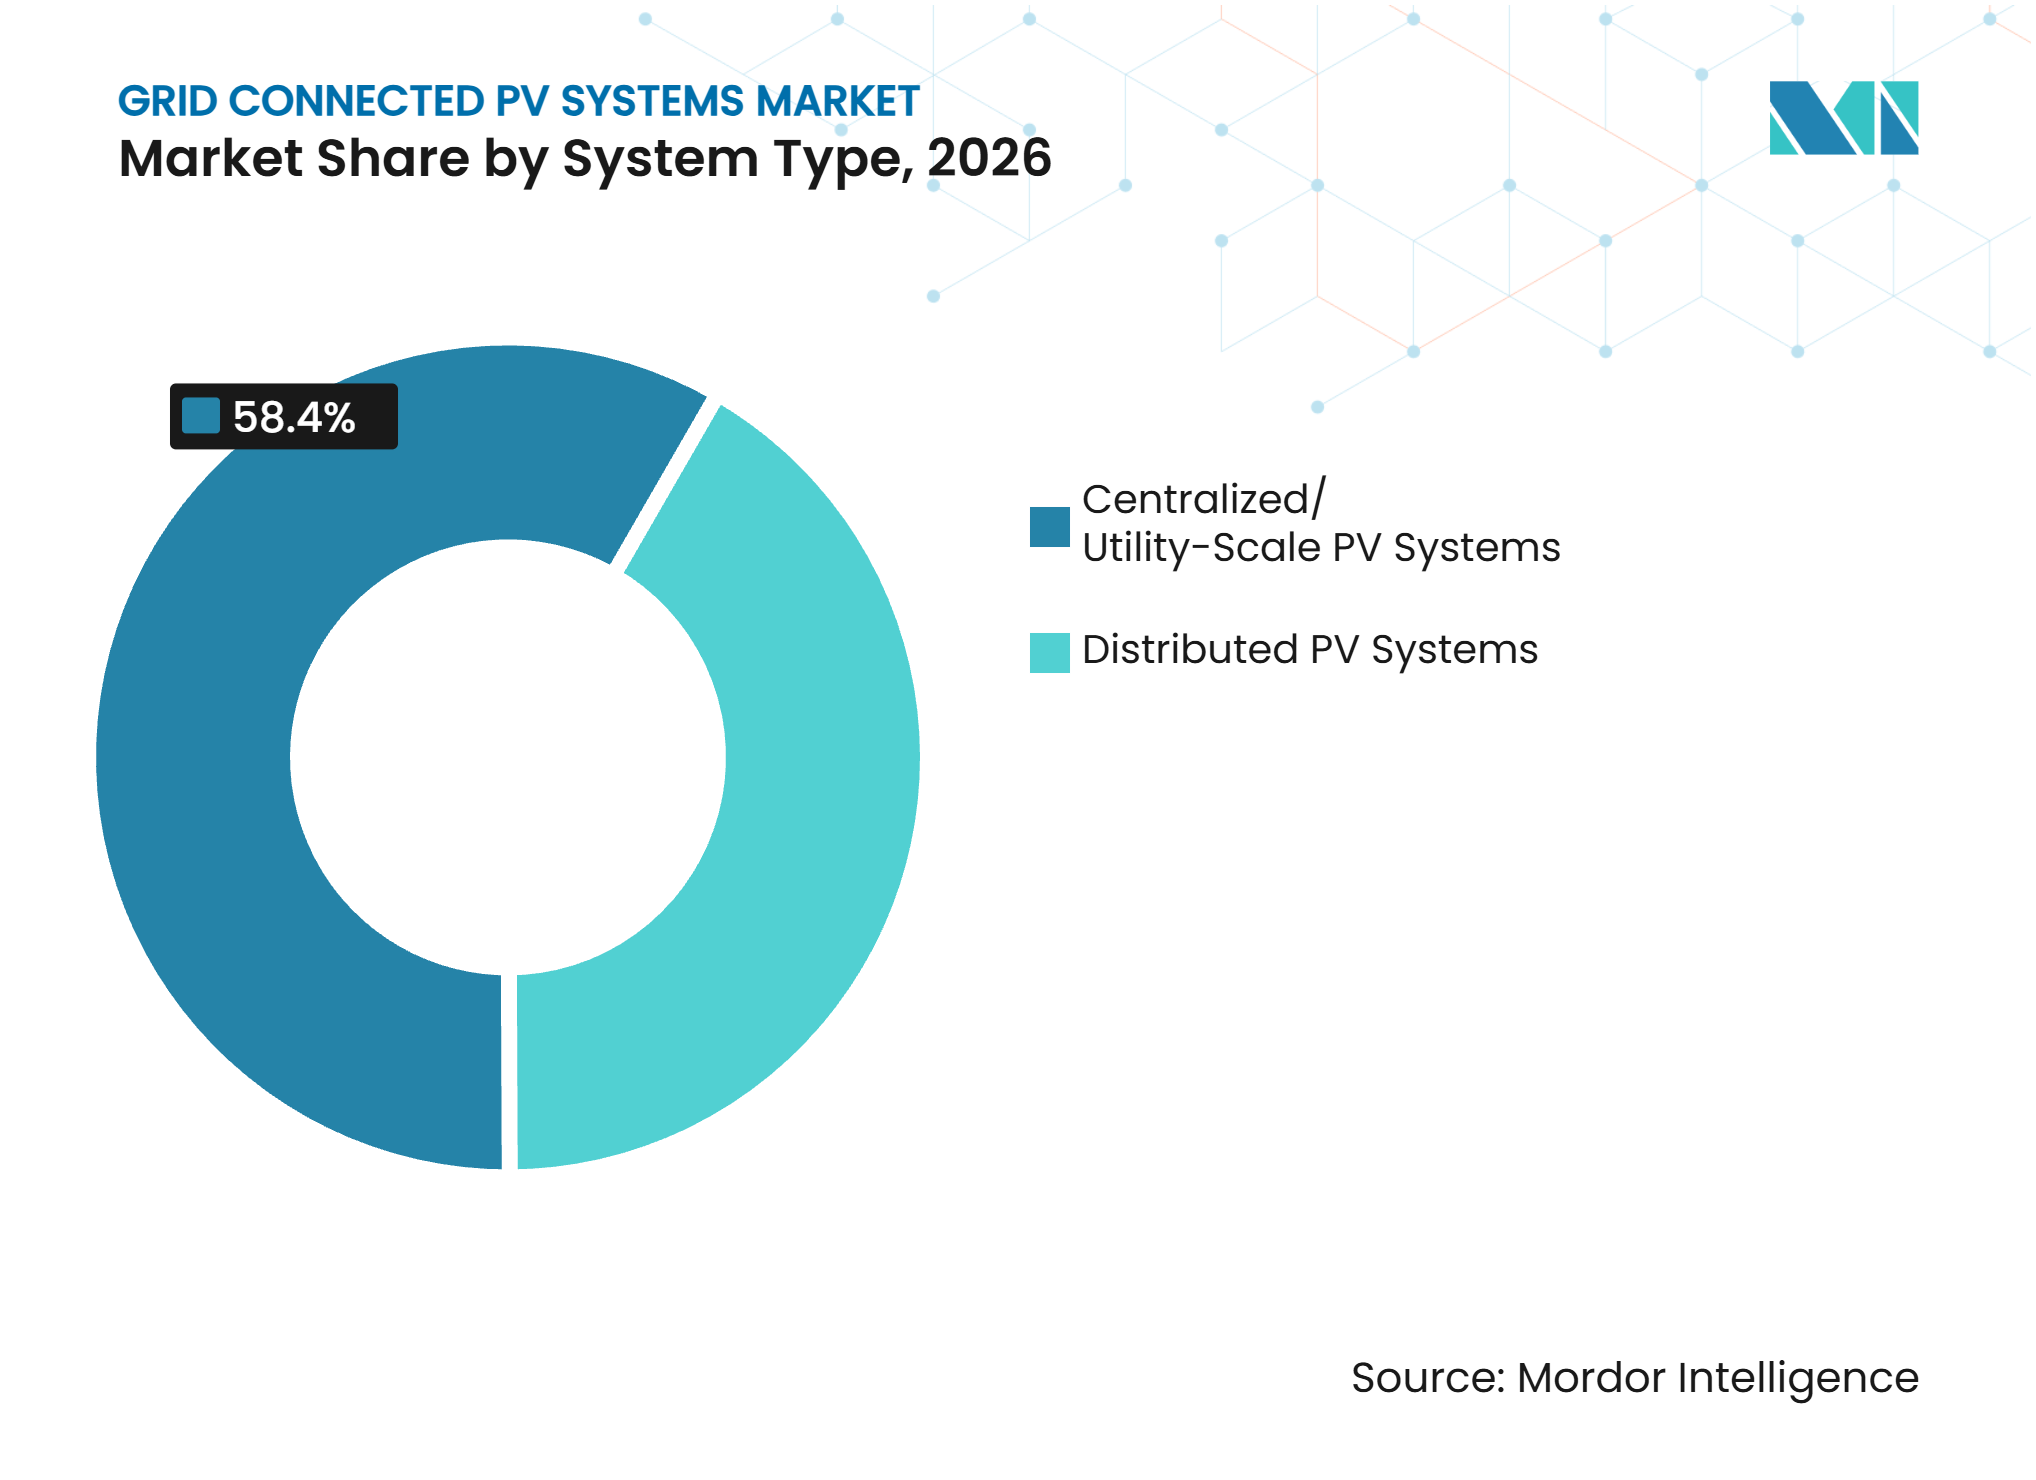
- By system type, centralized and utility-scale PV held 58.4% of revenue in 2026, while distributed PV is forecast to grow at a 29.8% CAGR through 2032.
- By component, solar PV modules accounted for 49.2% of revenue in 2026 and are forecast to expand at a 29.5% CAGR through 2032.
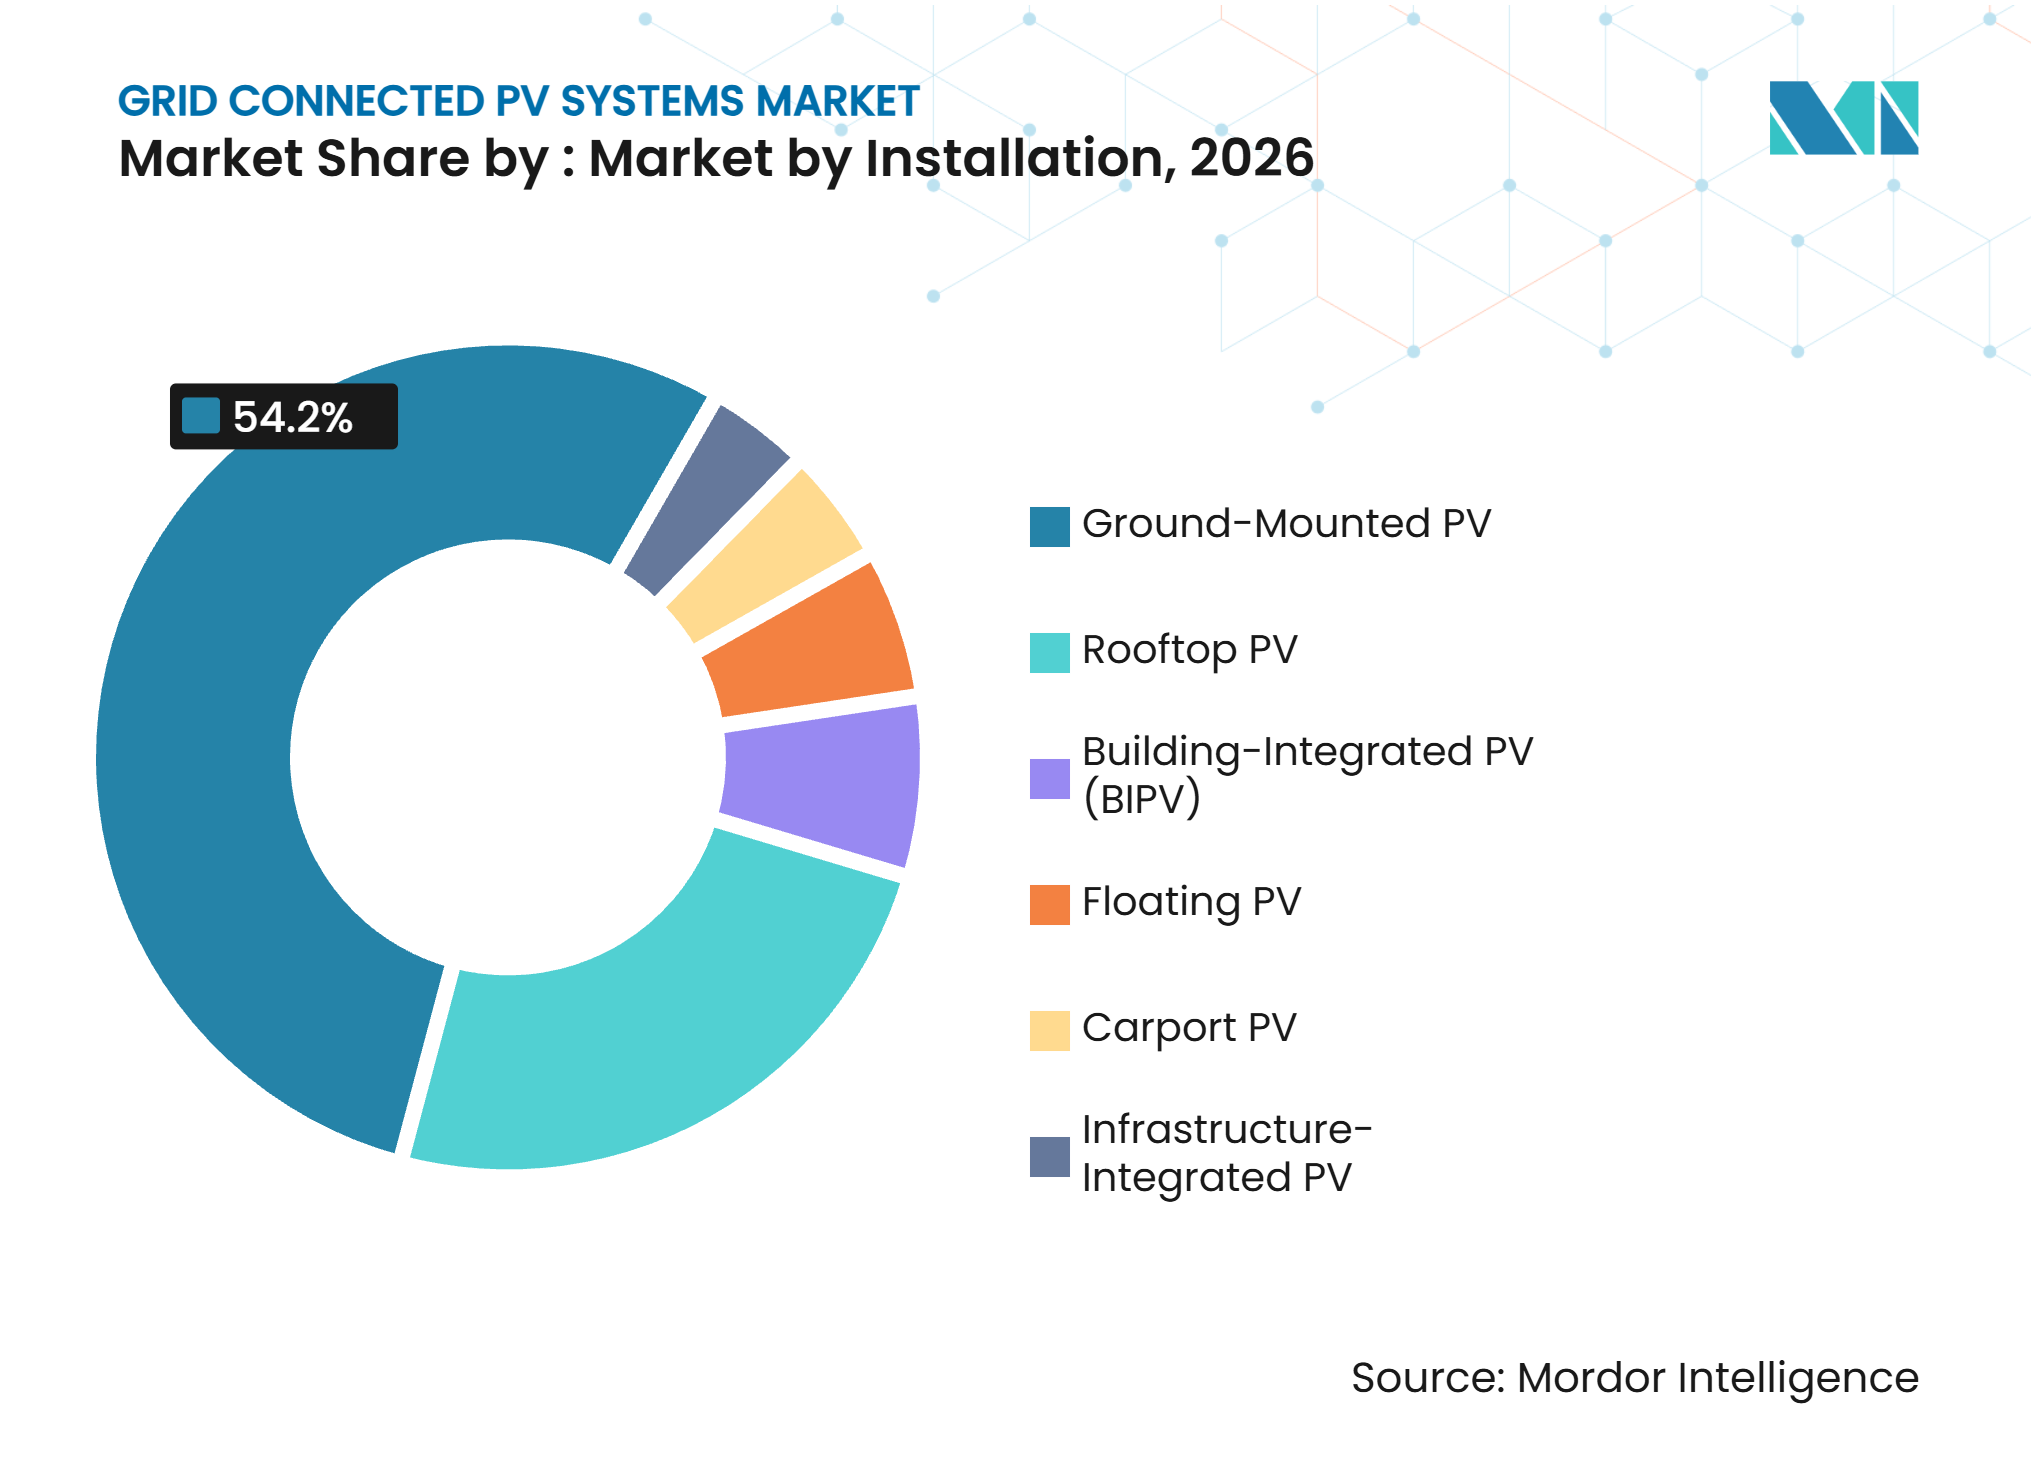
- By installation, ground-mounted systems held 54.2% of revenue in 2026, while rooftop PV is forecast to grow at a 30.3% CAGR through 2032.
- By end use, utilities accounted for 56.5% of revenue in 2026, while residential systems are forecast to grow at a 29.6% CAGR through 2032.
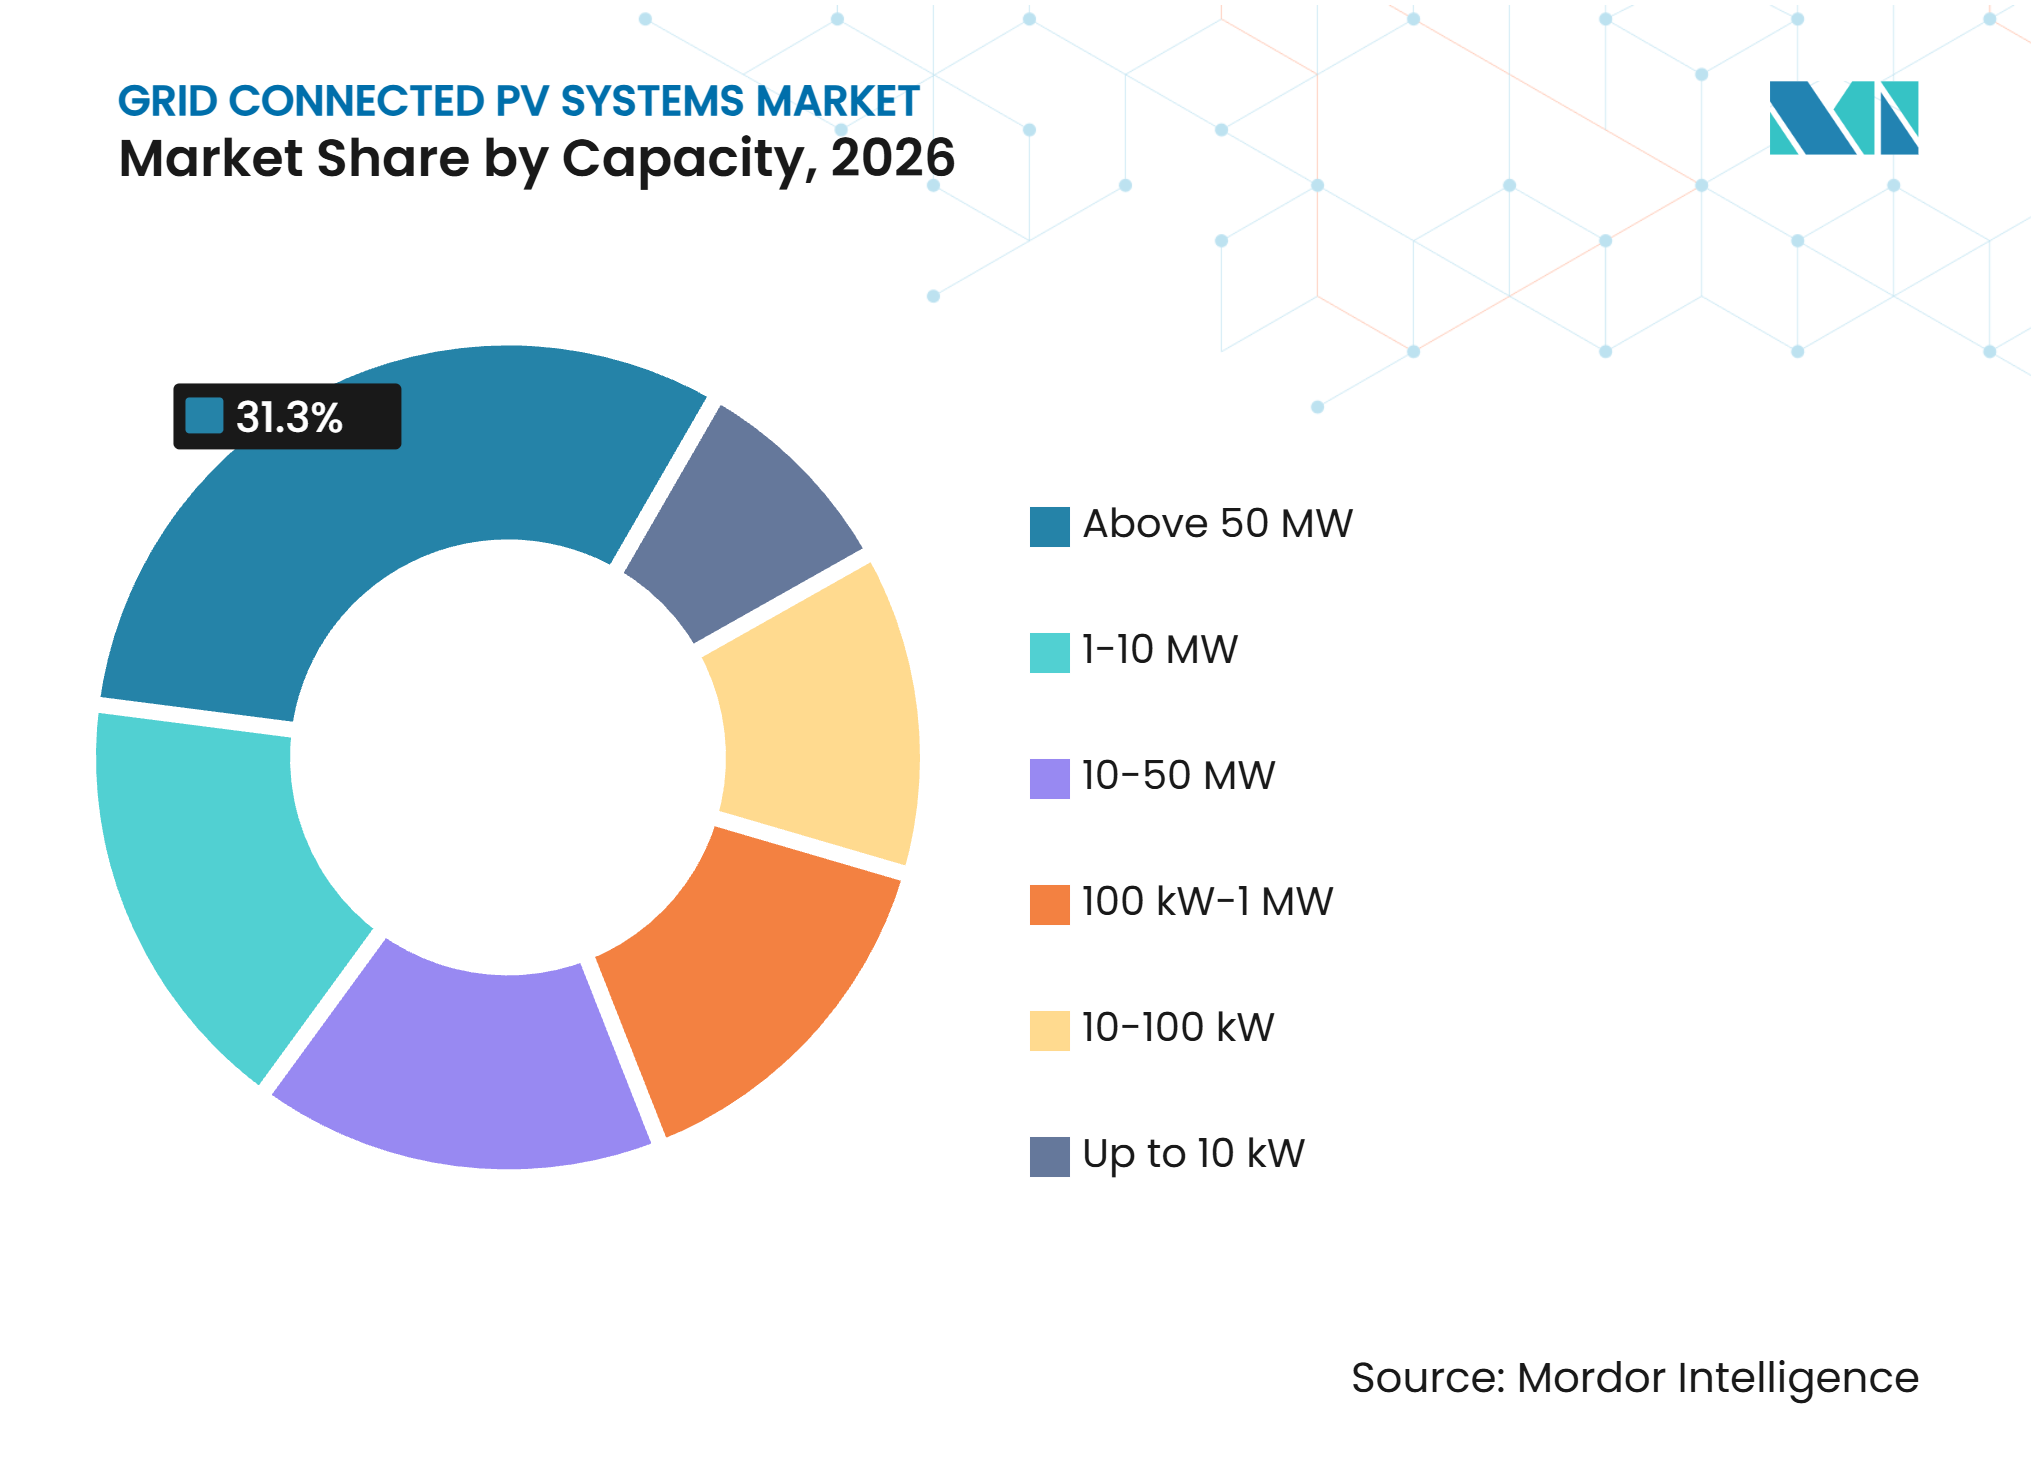
- By capacity, systems above 50 MW held 31.3% of revenue in 2026, while systems up to 10 kW are forecast to grow at a 30.2% CAGR through 2032.
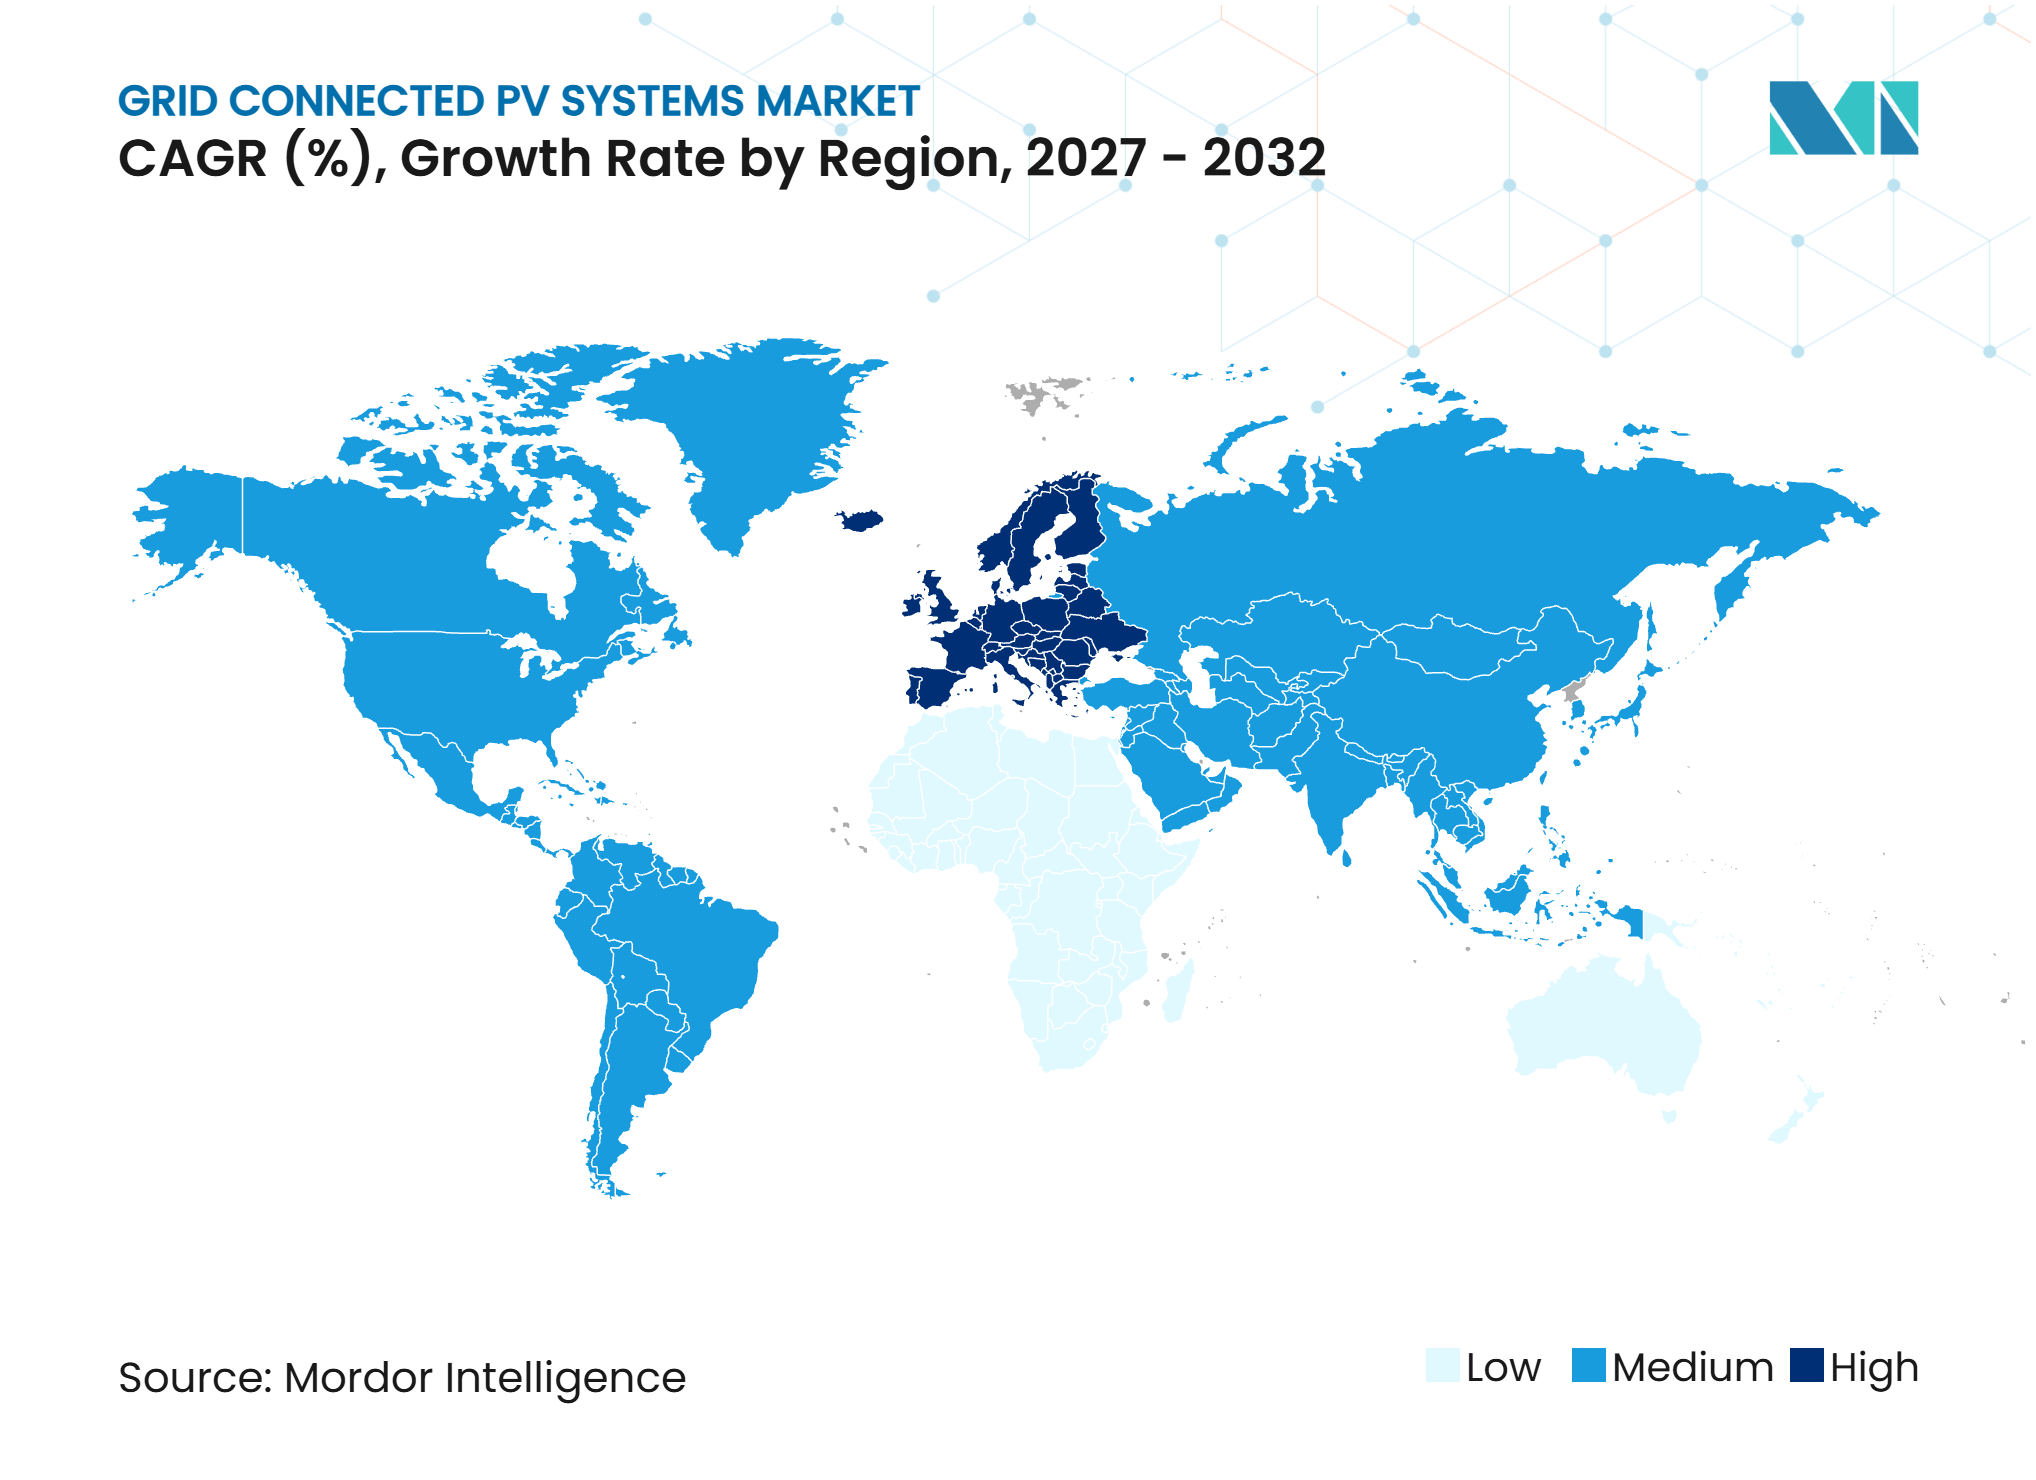
- By geography, Asia-Pacific held 59.4% of the Grid connected PV systems market in 2026, while Europe is forecast to grow at a 30.5% CAGR through 2032.
Note: Market numbers in this report are based on Mordor Intelligence's proprietary estimation framework, which combines nine months of actuals with Q4 projections for base year 2026.
Market Trends and Insights
Drivers Impact Analysis of Grid Connected PV Systems Market*
| Driver | (~) % Impact on CAGR Forecast | Geographic Relevance | Impact Timeline |
|---|---|---|---|
| Declining Solar Costs and PV Deployment | +7.8% | Global | Short term (≤ 2 years) |
| Renewable Targets and Decarbonization Procurement | +6.2% | Global, especially Europe, India, and the Middle East | Medium term (2-4 years) |
| Corporate PPAs and Industrial Electrification | +3.4% | North America, Europe, and Asia-Pacific | Medium term (2-4 years) |
| Distributed Solar and Self-Consumption | +4.1% | Asia-Pacific, Middle East and Africa, and South America | Medium term (2-4 years) |
| Smart Inverters and Grid Modernization | +2.3% | North America, Europe, and China | Long term (≥ 4 years) |
| Data Center Load Growth and Firmed Solar Demand | +2.8% | North America and Asia-Pacific | Medium term (2-4 years) |
| Source: Mordor Intelligence | |||
Declining Levelized Cost and Rapid PV Deployment
Solar PV remained one of the lowest-cost options for new power generation in 2025. The International Renewable Energy Agency (IRENA) reported a global weighted-average solar PV cost of USD 44 per MWh in 2025, which was 41% below the lowest-cost new fossil-fuel alternative. The grid-connected PV systems market continues to benefit from this cost position, as public and private buyers can procure solar with a clearer long-term cost case. IRENA also reported that 91% of newly commissioned utility-scale renewable projects in 2024 produced electricity below the cost of the cheapest new fossil-fuel alternative.[2] Hardware costs continued to decline between 2024 and 2025, but financing costs offset part of those gains. Future cost improvements will depend more on financing conditions, grid connection access, and project design, particularly in markets where risk premiums remain high.
Renewable-Energy Targets and Decarbonization Procurement
National renewable energy targets continue to translate broad policy commitments into procurement pipelines for the grid-connected PV systems market. The EU's Renewable Energy Directive III introduced time limits for permitting and measures intended to accelerate interconnection. However, permitting delays in several EU member states still exceeded two years and reached four years in some cases. India's 500 GW non-fossil power target for 2030 has also supported a large solar procurement pipeline. The IEA Photovoltaic Power Systems (PVPS) program reported that India commissioned approximately 32 GW of solar in 2024 and reached 124.6 GW of cumulative PV capacity. More structured procurement programs support longer offtake contracts and more rigorous storage and reliability terms, favoring developers with integrated delivery capabilities.
Corporate PPAs and Industrial Electrification
Corporate power purchase agreements remain an important demand source for the grid-connected PV systems market. Global corporate clean-energy PPA volumes reached 55.9 GW in 2025, the second-highest annual total on record, despite a 10% decline from the prior year. Amazon.com Inc., Meta Platforms Inc., Alphabet Inc., and Microsoft Corporation accounted for 49% of those volumes, indicating that data center operators have become major buyers. The Clean Energy Buyers Alliance reported that US corporate buyers had announced more than 143 GW of large-scale clean-energy procurement since 2014. Industrial users in steel, chemicals, and cement also use solar as part of electrification and green hydrogen (H2) plans. These buyers require dependable power arrangements, which increases demand for projects that combine solar generation with firming solutions and clear delivery schedules.
Distributed Solar and Self-Consumption Economics
Distributed systems support the grid-connected PV systems market through lower customer electricity bills, building requirements, and growing battery adoption. The Energy Performance of Buildings Directive requires solar installations on new public and non-residential buildings larger than 50 m2 by December 31, 2026. France connected a record 5.9 GW of PV capacity in 2025, while solar production on the Enedis network rose 26% year over year in the first half of 2026. China also required distributed PV systems to be monitorable, measurable, adjustable, and controllable, strengthening their role in grid operations. The European Commission's Joint Research Centre estimated that EU rooftop solar potential exceeds 1.1 TW and could cover 40% of long-run electricity demand. These conditions make behind-the-meter PV increasingly relevant as an actively managed energy resource, rather than solely a means of reducing retail electricity purchases.
Restraints Impact Analysis of Grid Connected PV Systems Market*
| Restraint | (~) % Impact on CAGR Forecast | Geographic Relevance | Impact Timeline |
|---|---|---|---|
| Transmission Congestion, Curtailment, and Negative Pricing | -3.1% | Global, especially Asia-Pacific and North America | Medium term (2-4 years) |
| Interconnection Queues and Permitting Delays | -2.6% | North America and Europe | Medium term (2-4 years) |
| Tariff, Subsidy, and Local-Content Uncertainty | -2.2% | Global, concentrated in North America and Asia-Pacific | Medium term (2-4 years) |
| Inverter-Dominated Grid Stability and Cybersecurity Requirements | -1% | Global, with Europe and North America leading the regulatory response | Long term (≥ 4 years) |
| Source: Mordor Intelligence | |||
Transmission Congestion, Curtailment, and Negative Pricing
Transmission capacity has become a material constraint on the grid-connected PV systems market. India curtailed 8,133 GWh of solar power in the April to June 2026 quarter because transmission infrastructure lagged generation additions. Analysis also identified nearly 300 GWh of transmission-related curtailment in Indian interstate projects during the first quarter of 2026. California curtailed 4.5 million MWh in the first half of 2026, exceeding the full-year curtailment recorded in 2025. Curtailment reduces expected output and can weaken project revenue forecasts. It also raises the value of storage, flexible connection agreements, transmission expansion, and operating systems that can respond to grid conditions.
Interconnection Queues and Permitting Delays
Interconnection queues and permitting delays can defer projects even where demand and financing are available. Lawrence Berkeley National Laboratory reported 773 GW of active solar capacity in the US interconnection queue at the end of 2025.[3] The median period from interconnection request to commercial operation exceeded five years, and only 13% of projects that entered the queue between 2000 and 2020 had reached commercial operation. Additionally, 549 GW of solar projects had executed interconnection agreements but were not operating at the end of 2025. In Europe, implementation capacity has not always matched faster permitting rules. These delays tie up capital, create scheduling uncertainty, and increase the advantage of developers that can manage grid studies, permitting, and stakeholder requirements early.
*Our forecasts treat driver/restraint impacts as directional, not additive. The impact forecasts reflect baseline growth, mix effects, and variable interactions.
Grid Connected PV Systems Market Segment Analysis
By System Type:
Utility-Scale Leads, but Distributed Systems Set the PaceCentralized and utility-scale PV held 58.4% of the grid-connected PV systems market share in 2026. Large procurement programs, institutional PPAs, and auction structures support this position by enabling capacity contracting at scale. IEA PVPS reported approximately 410 GW of new utility-scale solar additions in 2025, representing nearly 59% of global additions. These systems remain central to public utility procurement and large corporate offtake arrangements. Their development outlook is closely tied to transmission capacity, land access, and the availability of grid connection rights.
Distributed PV systems are forecast to grow at a 29.8% CAGR from 2027 to 2032. Rooftop mandates, self-consumption economics, and integration with battery storage and electric-vehicle charging support this growth. China's controllability requirements place distributed assets within an operating model that supports demand response and ancillary services. The two system types serve different purposes: centralized projects focus on large-volume generation, while distributed systems are positioned closer to end users. The grid-connected PV systems market therefore requires both large project execution capability and local installation capability.



By Component:
Modules Lead by Volume, Trackers and Inverters Lead by MarginSolar PV modules represented 49.2% of component revenue in 2026 and are forecast to grow at a 29.5% CAGR through 2032. Modules remain the core electricity-generating element in every project, which explains their large share of the grid-connected PV systems market. Sustained manufacturing overcapacity continues to pressure module pricing. At the same time, component requirements are moving beyond basic module supply toward performance documentation and equipment compatibility. As a result, module selection depends on reliability, power output, warranties, and compliance, in addition to purchase price.
Trackers, inverters, mounting systems, cables, connectors, and switchgear each serve distinct roles in project performance and grid compliance. Trackers and inverters are areas where software-based optimization, terrain adaptation, and predictive maintenance can preserve value more effectively than commoditized hardware. Inverter requirements are becoming more important as grids incorporate more inverter-based generation. The IEC 61724 performance-monitoring standard and IEEE 2800 grid-connection requirements shape procurement specifications. These conditions make component integration important for the grid-connected PV systems market, particularly for developers seeking stable yields and compliant connection performance.
By Installation:
Rooftop PV Gathers Speed from Regulatory MandatesGround-mounted systems held 54.2% of the grid-connected PV systems market in 2026. Utility-scale parks in the US Sun Belt, Australia, Gulf Cooperation Council countries, and western China supported this position. Ground-mounted projects can concentrate capacity and use standardized construction methods, but they require land rights, transmission access, and grid studies that can extend development timelines. Their scale makes them well suited to public auctions and large corporate offtake contracts.
Rooftop PV is forecast to grow at a 30.3% CAGR from 2027 to 2032. Building-code requirements and retail electricity savings are supporting demand, particularly in Europe. Floating solar, building-integrated PV, carport PV, and infrastructure-integrated PV address locations where land is scarce or sites have other primary uses. Floating solar developments in Malaysia and Vietnam illustrate hydro-linked and water-based installations. These formats reduce land requirements but involve more specialized engineering and installation work. The grid-connected PV systems market will therefore need installation capabilities suited to a range of site, building, and connection conditions.

By End Use:
Utility Anchors the Market, Residential Drives the Next Growth WaveUtilities accounted for 56.5% of revenue in 2026. Long-duration PPAs and government auctions provide the revenue structures required by large institutional investors. Commercial and industrial users form a middle tier where self-consumption and corporate decarbonization support on-site projects. Utility projects also face the most direct exposure to curtailment, transmission bottlenecks, and interconnection queue delays, reinforcing the need for storage and coordinated grid planning across the grid-connected PV systems market.
Residential systems are forecast to grow at a 29.6% CAGR from 2027 to 2032. Net-metering reforms, declining battery costs, and household energy-cost concerns support this outlook. Growing data-center demand for solar procurement and on-site capacity in the United States also favors projects that can offer reliable output and clear construction timelines. Residential and large-load demand expand through different routes, but both increase the requirement for flexible solar operation.
By Capacity:
Large Projects Dominate the Installed Base, Small Systems Drive Future AdoptionSystems above 50 MW held 31.3% of revenue in 2026, reflecting the installed base of large solar parks in China, the United States, and the Middle East. These projects are suited to large procurement rounds as they can deliver significant capacity from a single development. However, they are also more exposed to transmission delays and evolving requirements for grid-forming inverters. Their position is supported by scale but constrained by connection readiness.
Systems up to 10 kW are forecast to expand at a 30.2% CAGR through 2032. This capacity range supports residential and micro-commercial installations, where deployment is less dependent on large transmission projects. The 100 kW to 1 MW range serves commercial, agricultural, and agrivoltaic applications. Systems from 1 MW to 10 MW support community solar and mid-sized commercial projects, while the 10 MW to 50 MW range increasingly supports solar-plus-storage projects. The breadth of capacity requirements indicates that the grid-connected PV systems market cannot rely on a single development model.
Geography Analysis
Asia-Pacific held 59.4% of the grid-connected PV systems market share in 2026. China accounted for about 415 GW of the nearly 698 GW installed globally that year, supported by its domestic supply chain and deployment scale. India added substantial capacity but faced a gap between project commissioning and transmission availability. Vietnam, Indonesia, Thailand, Australia, and South Korea broadened deployment beyond China and India. Grid readiness remained a key regional issue.
Europe is forecast to grow at a 30.5% CAGR from 2027 to 2032. The region added 65.7 GW in 2025 and reached 406 GW of cumulative capacity, according to IEA PVPS. Germany, France, Spain, Italy, and Poland led national additions. The Energy Performance of Buildings Directive (EPBD) creates a more predictable route for solar deployment on qualifying new buildings. Slower rooftop adoption following subsidy changes and longer permitting processes could limit part of the regional opportunity.
North America combines high electricity demand with long project queues. The United States added 43.2 GW in 2025 and is expected to add 43.4 GW of utility-scale solar in 2026. Mexico and Canada provide additional commercial and industrial demand opportunities. In the Middle East and Africa, Saudi Arabia, the United Arab Emirates, Egypt, South Africa, and Morocco lead national programs. Nextpower Arabia's contract to supply 2.25 GW of trackers for the Bisha Solar project illustrates the scale of Saudi procurement.[4]
Competitive Landscape
Market Concentration
The grid-connected PV systems market includes concentrated module manufacturing and a broader set of competitors in inverters, trackers, mounting systems, and grid-integration services. LONGi, JinkoSolar, JA Solar, Trina Solar, and Tongwei are major module suppliers. Excess production capacity has created price pressure, increasing the importance of product reliability, supply-chain management, and differentiated system performance. This environment also makes it harder for smaller module manufacturers to compete on price alone.
Competitive activity is shifting toward subsystems and services that improve generation, connection performance, and system management. Nextracker reported FY26 revenue of USD 3.56 billion and an order backlog of USD 5.25 billion in its annual report filed with the U.S. Securities and Exchange Commission. The company also disclosed a pending acquisition of power-conversion product lines and intellectual property from Apex Power, extending its focus from trackers toward power electronics, storage, and data-center-related infrastructure. Array Technologies also expanded its tracker offering with the DuraTrack D2S system for international markets.
Grid-forming inverters, solar-plus-storage configurations, and energy-management platforms are important competitive areas, as they address the operational needs created by higher solar penetration. IRENA reported firm solar-plus-battery costs of USD 54 to USD 82 per MWh by 2025 in high-irradiance regions. The North American Electric Reliability Corporation (NERC) issued a draft Inverter-Based Resources Security Guideline in March 2026, setting out recommended cybersecurity practices for utility-scale facilities. A market concentration score of 5 is assigned, as leading module suppliers have been identified but no combined top-player share is available to support a higher score across the full value chain.
Grid Connected PV Systems Industry Leaders
-
JinkoSolar Holding Co., Ltd.
-
Trina Solar Co., Ltd.
-
Huawei Technologies Co., Ltd.
-
Sungrow Power Supply Co., Ltd.
-
LONGi Green Energy Technology Co., Ltd.
- *Disclaimer: Major Players sorted in no particular order
Grid Connected PV Systems Market Companies Covered in this Report
- Trina Solar Co., Ltd.
- JinkoSolar Holding Co., Ltd.
- Canadian Solar Inc.
- First Solar, Inc.
- Hanwha Q CELLS Co., Ltd.
- SMA Solar Technology AG
- ABB Ltd.
- Schneider Electric SE
- Huawei Technologies Co., Ltd.
- SolarEdge Technologies, Inc.
- JA Solar Technology Co., Ltd.
- Delta Electronics, Inc.
- SunPower Corporation
- Sungrow Power Supply Co., Ltd.
- LONGi Green Energy Technology Co., Ltd.
- Enphase Energy, Inc.
- Fronius International GmbH
- Sineng Electric Co., Ltd.
- Growatt New Energy Technology Co., Ltd.
- Nextracker Inc.
- Array Technologies, Inc.
Recent Industry Developments in Grid Connected PV Systems Market
- May 2026: Nextracker Arabia, a joint venture between Nextracker and Abunayyan Holding, secured a contract to supply 2.25 GW of smart solar tracking systems to Larsen and Toubro for ACWA Power's Bisha Solar Project in Saudi Arabia. The project is being developed under the Kingdom's National Renewable Energy Program (Wave 6) and represents one of the largest tracker supply agreements announced for a grid-connected PV project globally.
- April 2026: IRENA reported that global solar PV installations reached 510.3 GW of new capacity additions in 2025, accounting for nearly three-quarters of all renewable capacity additions worldwide. Total renewable capacity reached 5,149 GW, reinforcing solar PV's position as the dominant technology in grid-connected renewable power generation.
- June 2026: JinkoSolar introduced its Tiger Neo 5.0 PV modules with mass-produced efficiency of 25.91% and power output exceeding 700 W. The company also stated that TOPCon 3.0 production capacity is expected to exceed 40 GW by the end of 2026. High-efficiency modules directly influence the economics of utility-scale and commercial grid-connected PV projects.
- June 2026: Array Technologies launched DuraTrack D2S, a dual-row solar tracker platform for EMEA markets, and introduced ARRAY Atlas, an integrated foundation-to-tracker solution suite for utility-scale solar projects. This reflects increasing demand for integrated balance-of-system solutions in grid-connected PV projects.
Global Grid Connected PV Systems Market Report Scope
A grid-connected photovoltaic (PV) system is a solar power setup that connects directly to the local utility electrical network. It uses solar panels to convert sunlight into direct current (DC) electricity, which an inverter then converts into alternating current (AC) for local use. Any surplus power generated can be fed back into the main electrical grid through a bi-directional meter. This setup allows users to draw power from the grid when solar production is low, providing continuous electricity without requiring a battery bank.
The Global Grid-Connected PV Systems Market is segmented by system type into distributed PV systems and centralized/utility-scale PV systems. By component, the market is segmented into solar PV modules, inverters, mounting structures, solar trackers, DC cables and connectors, AC cables and switchgear, and other components. By installation, the market is segmented into rooftop PV, ground-mounted PV, building-integrated PV (BIPV), carport PV, floating PV, and infrastructure-integrated PV. By end use, the market is segmented into residential, commercial, industrial, and utility sectors. By capacity, the market is segmented into up to 10 kW, 10-100 kW, 100 kW-1 MW, 1-10 MW, 10-50 MW, and above 50 MW. The report also covers the market size and forecasts for the global grid-connected PV systems market across 26 countries in key regions. For each segment, the market sizing and forecasts are provided on the basis of value (USD).
Segmentation Overview
| Distributed PV Systems |
| Centralized/Utility-Scale PV Systems |
| Solar PV Modules |
| Inverters |
| Mounting Structures |
| Solar Trackers |
| DC Cables and Connectors |
| AC Cables and Switchgear |
| Other Components |
| Rooftop PV |
| Ground-Mounted PV |
| Building-Integrated PV (BIPV) |
| Carport PV |
| Floating PV |
| Infrastructure-Integrated PV |
| Residential |
| Commercial |
| Industrial |
| Utility |
| Up to 10 kW |
| 10–100 kW |
| 100 kW–1 MW |
| 1–10 MW |
| 10–50 MW |
| Above 50 MW |
| North America | United States |
| Canada | |
| Mexico | |
| Europe | Germany |
| France | |
| Italy | |
| Spain | |
| United Kingdom | |
| Poland | |
| Russia | |
| Rest of Europe | |
| Asia-Pacific | China |
| India | |
| Japan | |
| South Korea | |
| Australia | |
| Indonesia | |
| Vietnam | |
| Thailand | |
| Rest of Asia-Pacific | |
| South America | Brazil |
| Argentina | |
| Chile | |
| Rest of South America | |
| Middle East and Africa | Saudi Arabia |
| United Arab Emirates | |
| Egypt | |
| South Africa | |
| Morocco | |
| Rest of Middle East and Africa |
| By System Type | Distributed PV Systems | |
| Centralized/Utility-Scale PV Systems | ||
| By Component | Solar PV Modules | |
| Inverters | ||
| Mounting Structures | ||
| Solar Trackers | ||
| DC Cables and Connectors | ||
| AC Cables and Switchgear | ||
| Other Components | ||
| By Installation | Rooftop PV | |
| Ground-Mounted PV | ||
| Building-Integrated PV (BIPV) | ||
| Carport PV | ||
| Floating PV | ||
| Infrastructure-Integrated PV | ||
| By End Use | Residential | |
| Commercial | ||
| Industrial | ||
| Utility | ||
| By Capacity | Up to 10 kW | |
| 10–100 kW | ||
| 100 kW–1 MW | ||
| 1–10 MW | ||
| 10–50 MW | ||
| Above 50 MW | ||
| By Geography | North America | United States |
| Canada | ||
| Mexico | ||
| Europe | Germany | |
| France | ||
| Italy | ||
| Spain | ||
| United Kingdom | ||
| Poland | ||
| Russia | ||
| Rest of Europe | ||
| Asia-Pacific | China | |
| India | ||
| Japan | ||
| South Korea | ||
| Australia | ||
| Indonesia | ||
| Vietnam | ||
| Thailand | ||
| Rest of Asia-Pacific | ||
| South America | Brazil | |
| Argentina | ||
| Chile | ||
| Rest of South America | ||
| Middle East and Africa | Saudi Arabia | |
| United Arab Emirates | ||
| Egypt | ||
| South Africa | ||
| Morocco | ||
| Rest of Middle East and Africa | ||
Key Questions Answered in the Report
What is the projected growth rate for grid-connected PV systems?
The grid-connected PV systems market is forecast to grow at a 29.27% CAGR from 2027 to 2032, increasing from 4.05 TW in 2027 to 14.62 TW by 2032. Lower generation costs support this expansion, although connection capacity, financing, and storage increasingly affect project delivery.
Which system type leads global solar deployment?
Centralized and utility-scale PV led with 58.4% of revenue in 2026. Large public procurement programs, auctions, and corporate power purchase agreements support this segment of the grid-connected PV systems market.
Which installation type is growing fastest?
Rooftop PV is expected to expand at a 30.3% CAGR through 2032, supported by building mandates and self-consumption economics.
What is the main risk to solar project deployment?
Transmission congestion, curtailment, permitting delays, and long interconnection queues can reduce revenue certainty and delay construction.
Which region is expected to grow fastest?
Europe is projected to record a 30.5% CAGR through 2032, supported by solar building requirements and continued capacity additions.
How are companies competing in grid-connected solar?
Companies are expanding beyond modules into trackers, inverters, storage, grid-forming capabilities, cybersecurity, and energy management software. This reflects the evolving needs of the grid-connected PV systems market, where performance, grid compliance, and operating services are increasingly important alongside generation equipment.