Concrete Retarders Market Size and Share
Market Overview
| Study Period | 2020 - 2031 |
|---|---|
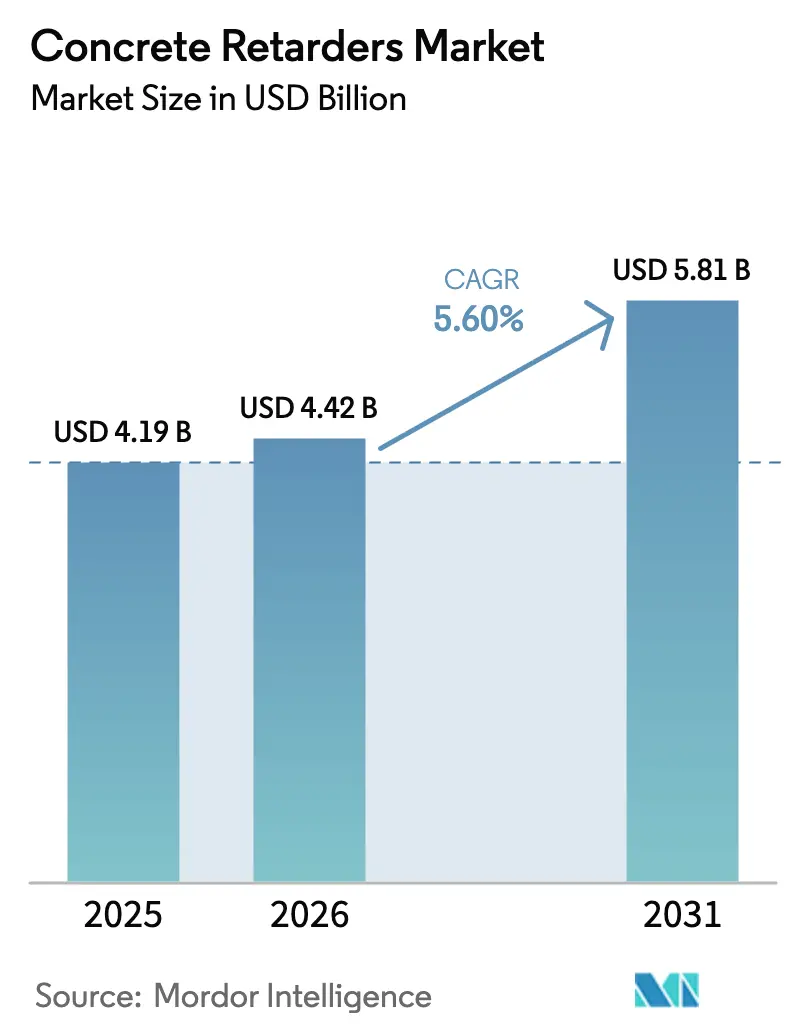
| Market Size (2026) | USD 4.42 Billion |
| Market Size (2031) | USD 5.81 Billion |
| Growth Rate (2026 - 2031) | 5.60% CAGR |
| Fastest Growing Market | Asia Pacific |
| Largest Market | Asia Pacific |
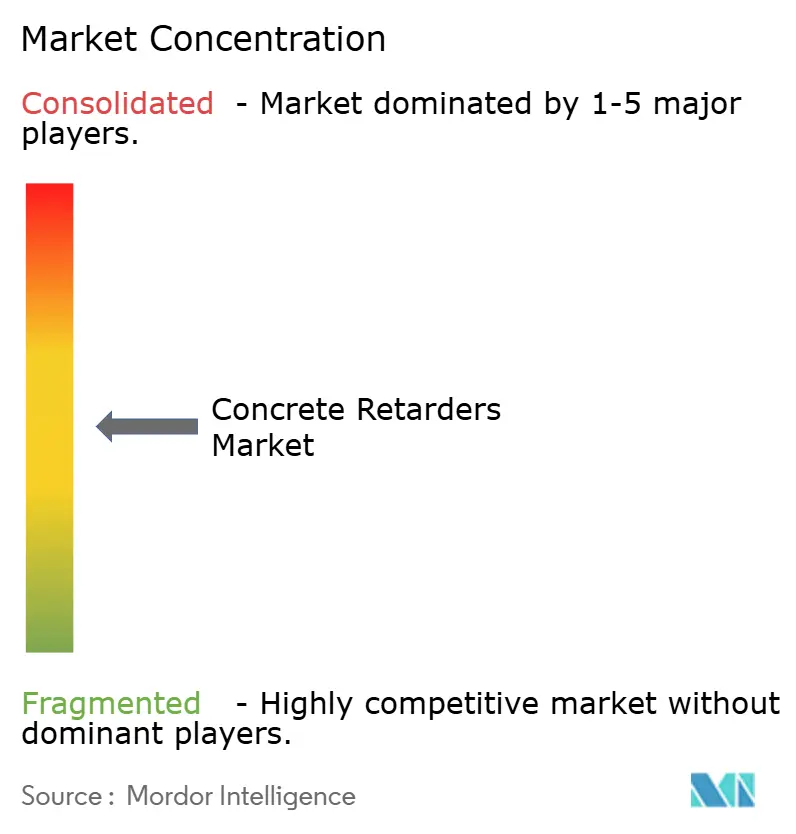
| Market Concentration | Medium |
Major Players *Disclaimer: Major Players sorted in no particular order Image © Mordor Intelligence. Reuse requires attribution under CC BY 4.0. | |
Concrete Retarders Market Analysis by Mordor Intelligence
The Concrete Retarders market size is expected to grow from USD 4.19 billion in 2025 to USD 4.42 billion in 2026 and is forecast to reach USD 5.81 billion by 2031 at 5.6% CAGR over 2026-2031. Demand growth stems from complex infrastructure projects that require extended working hours, the wider adoption of ready-mix concrete transported over longer distances, and stringent sustainability codes that favor low-heat mixes. Asia-Pacific dominates value generation, supported by mega-transport corridors and rapid urbanization. Liquid formulations gain preference because automated batch plants require precise dosing, while powder variants remain relevant in remote or storage-sensitive projects. Rising raw-material cost volatility and divergent regional cement chemistries temper momentum but also stimulate innovation in synthetic chemistries and digital quality management systems.
Key Report Takeaways
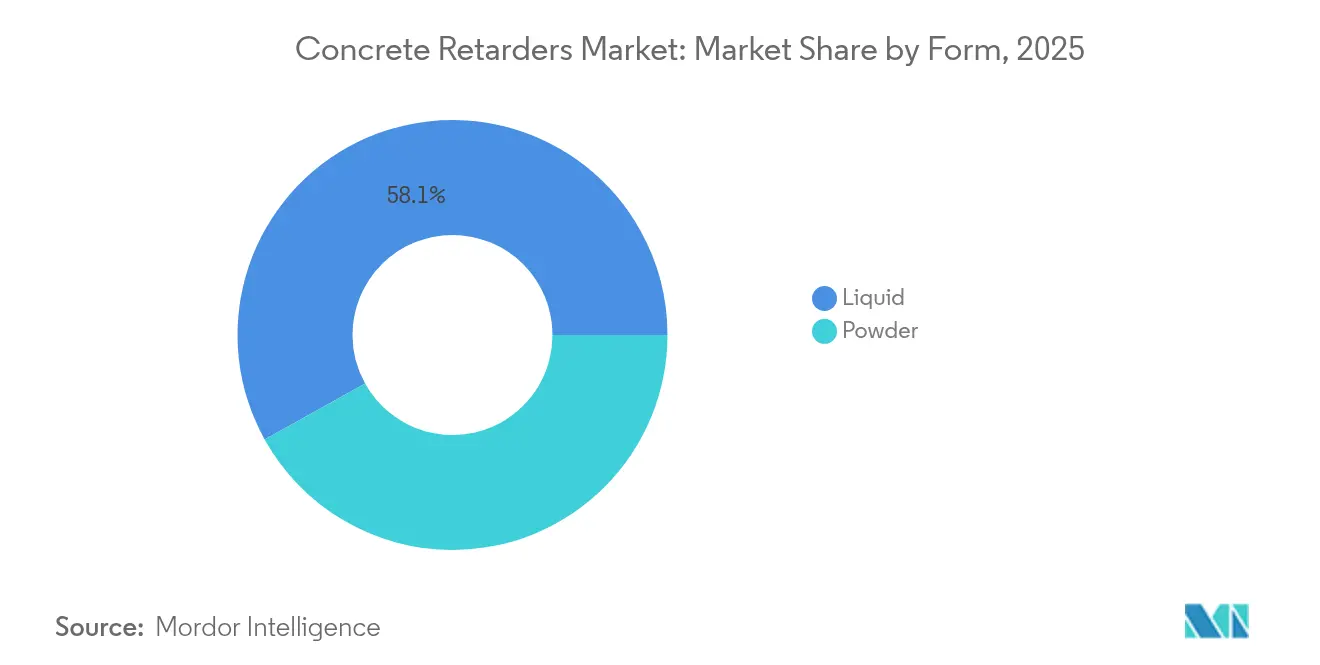
- By form, liquid products led the Concrete Retarders market with a 58.08% market share in 2025 and are projected to expand at a 5.74% CAGR through 2031.
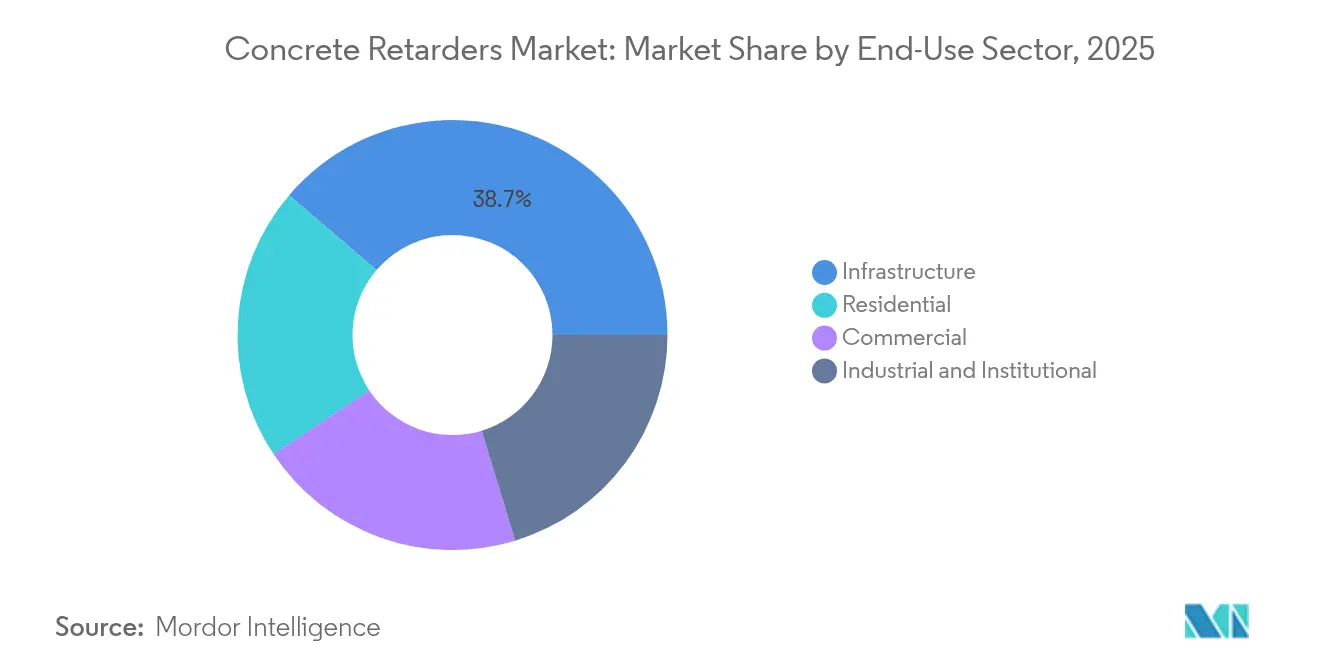
- By end-use, infrastructure captured a 38.74% revenue share in 2025, while residential construction is growing at the fastest rate, with a 6.69% CAGR to 2031.
- By geography, the Asia-Pacific region held 40.02% of the Concrete Retarders market in 2025 and is expected to advance at a 5.83% CAGR through 2031.
Note: Market size and forecast figures in this report are generated using Mordor Intelligence’s proprietary estimation framework, updated with the latest available data and insights as of 2026.
Global Concrete Retarders Market Trends and Insights
Drivers Impact Analysis*
| Driver | (~) % Impact on CAGR Forecast | Geographic Relevance | Impact Timeline |
|---|---|---|---|
| Rising infrastructure spending in the Asia-Pacific region | +1.2% | APAC core, spill-over to MEA | Medium term (2-4 years) |
| Growth of ready-mix concrete with longer haul distances | +0.9% | Global, concentrated in North America & APAC | Short term (≤ 2 years) |
| Strict sustainability codes favouring low-heat mixes | +0.7% | Europe & North America, expanding to APAC | Long term (≥ 4 years) |
| Digital batch-plant optimisation demanding dosage flexibility | +0.6% | Global, led by developed markets | Medium term (2-4 years) |
| Adoption in 3-D-printed concrete formulations | +0.4% | North America & Europe, pilot projects in APAC | Long term (≥ 4 years) |
| Source: Mordor Intelligence | |||


Rising Infrastructure Spending in Asia-Pacific
Record public investment across India, Indonesia, and other emerging economies lifts concrete demand for bridges, metros, and industrial parks. Masses above 1,000 m³ require set-time control to avoid cold joints, so contractors specify retarders within digital concrete management platforms, such as VERIFI. High outdoor temperatures above 30 °C reduce the workable life, making chemical intervention essential. Global suppliers, therefore, expand local technical centers and production capacity to support regional codes and localization requirements. Regional megaprojects, including high-speed rail corridors, continue to signal sustained demand throughout the decade.
Growth of Ready-Mix Concrete with Longer Haul Distances
Urban sprawl restricts new plant locations, extending average delivery times to more than 45 minutes. Extended hauls expose concrete to premature set, so producers integrate time-release retarder chemistries that preserve slump until placement. On-board sensors track temperature and rotation count, allowing for field adjustments through cloud-based dashboards. Global fleets adopt standardized liquid dosing modules that link to dispatch software, ensuring batch-to-batch consistency. The practice gains traction in North American refurbishment programs and Asian smart city builds[1]CEMEX, “Annual Integrated Report 2024,” cemex.com.
Strict Sustainability Codes Favoring Low-Heat Mixes
Ordinances like Santa Monica’s low-carbon concrete rule limit the cement content and reduce the global warming potential, thereby catalyzing demand for admixtures compatible with fly ash and slag blends [2]City of Santa Monica, “Ordinance 2778: Low-Carbon Concrete,” smgov.net. High SCM loadings alter hydration kinetics, so formulators design retarder molecules that moderate early heat release without delaying final strength. European EN 934-2 updates likewise push for disclosure on embodied carbon, prompting suppliers to launch low-VOC and fully offset “zero-line” portfolios. Such regulatory pull increases adoption across government buildings and private developments aiming for green certifications.
Digital Batch-Plant Optimization Demanding Dosage Flexibility
IoT-equipped plants utilize live rheology feedback to automatically adjust admixture volumes, favoring liquid forms that yield linear dose-response curves. Suppliers integrate QR-coded totes for traceability and cloud-based dashboards that flag variance outside control limits. The trend enhances quality assurance for precasters and mega infrastructure contractors pursuing predictive maintenance strategies.
Restraints Impact Analysis*
| Restraint | (~) % Impact on CAGR Forecast | Geographic Relevance | Impact Timeline |
|---|---|---|---|
| Volatile pulp and sugar prices impacting raw-material costs | -0.80% | Global, concentrated in regions dependent on lignosulfonate supply | Short term (≤ 2 years) |
| Diverse cement chemistries causing performance variability | -0.50% | Global, acute in markets with multiple cement producers | Medium term (2-4 years) |
| Tight limits on set time in hot climates | -0.30% | Tropical and desert regions where ambient temperatures regularly exceed 30 °C | Short term (≤ 2 years) |
| Geographic concentration of lignosulfonate supply | -0.20% | Major producing hubs such as Scandinavia and Brazil that service global markets | Short term (≤ 2 years) |
| Source: Mordor Intelligence | |||
Volatile Pulp and Sugar Prices Impacting Raw-Material Costs
Lignosulfonate, sourced from pulp mills, is subject to price fluctuations driven by paper-grade capacity reductions and energy cost increases. Parallel volatility in sugar markets lifts feedstock costs for carbohydrate-derivative retarders. Small manufacturers without long-term contracts struggle to absorb hikes, prompting portfolio shifts to synthetic gluconate or phosphonate chemistries. Logistics tightness in key producing regions, such as Scandinavia and Brazil, further compresses margins and can trigger spot shortages.
Diverse Cement Chemistries Causing Performance Variability
Blended products with varying C₃A and alkali levels respond differently to identical admixture doses. Ready-mix firms operating across multiple cement suppliers must fine-tune their formulations per source, which raises inventory complexity and testing requirements. The challenge escalates as regulations push higher supplementary cementitious materials, creating cement chemistries with limited historical compatibility data. Global admixture vendors invest in regional labs and mobile field teams to troubleshoot variability on-site, increasing service overheads.
*Our forecasts treat driver/restraint impacts as directional, not additive. The impact forecasts reflect baseline growth, mix effects, and variable interactions.
Segment Analysis
By Form: Liquid Dominance Driven by Precision Demands
Liquid products held a 58.08% market share of the concrete retarders market in 2025, owing to their compatibility with automated batch plants and accurate dosage. The segment is projected to outpace overall growth with a 5.74% CAGR to 2031, capturing additional share in high-volume ready-mix networks. The expansion of the concrete retarders market size for liquid formulations also benefits from the increasing adoption of IoT-linked dispensing pumps, which guarantee uniform admixture distribution.
Liquid chemistries dissolve rapidly and prevent particulate segregation, delivering homogeneous set control across mass pours. Their compatibility with evolving polycarboxylate superplasticizers enhances performance in low-water mixes. Powder products remain viable for remote sites lacking liquid storage infrastructure and in regions where transport cost per kilogram favors dry goods. This niche demand stabilizes powder revenue, though it grows more slowly than the broader concrete retarders market.


By End-Use Sector: Infrastructure Leadership Amid Residential Acceleration
Infrastructure registered 38.74% revenue in 2025, reflecting projects such as mega roads, metros, and hydropower dams that require long set-up times. The segment uses advanced quality assurance protocols that specify premium retarder blends, reinforcing supplier relationships with large EPC contractors. The concrete retarders market size in infrastructure will track national stimulus budgets, particularly in the Asia-Pacific region.
Residential construction is expected to exhibit the fastest 6.69% CAGR through 2031, as precast panels, decorative floors, and energy-efficient homes become mainstream. Controlled placement windows facilitate the execution of architectural finishes and complex formwork. Suppliers launch odor-free, low-VOC lines suitable for indoor use, enabling them to penetrate multi-family high-rise projects. The commercial and industrial segments post steady demand, anchored by warehouse automation builds and data center expansions that adopt consistent batching methodologies.
Geography Analysis
The Asia-Pacific region accounted for 40.02% of the concrete retarders market in 2025 and is projected to grow at a 5.83% CAGR through 2031. Governments in India and Indonesia fund road and port networks, while China advances urban rail and industrial clusters. Multinational admixture vendors expand regional plants to reduce lead times, and local firms license global chemistries to comply with national product standards. Hot climates accelerate set, making retarders a default specification for daytime pours.
North America maintains a robust demand through federal infrastructure rehabilitation. Ready-mix fleets integrate telematics and slump monitoring, driving uptake of digital-compatible retarders. Sustainability initiatives promote the use of low-carbon concrete blends in coastal flood-protection projects, thereby reinforcing demand for specialty formulations. Europe exhibits moderate value growth but outsized innovation, spearheading the development of low-heat and zero-carbon concrete standards that prompt suppliers to adopt bio-based molecules and provide full life-cycle disclosures.
The Middle East and Africa experience emerging opportunities where extreme temperatures necessitate sophisticated set-control. Mega developments in Saudi Arabia and the United Arab Emirates are adopting performance-based concrete specifications that feature liquid retarders. South America advances urban mobility and housing programs, supporting incremental uptake. Regional cement chemistries vary widely, encouraging customized technical service and co-formulation partnerships.


Competitive Landscape
The Concrete Retarders Market is moderately concentrated. Global leading companies command notable positions through integrated distribution and strong technical advisory teams. They add regional production lines to localize supply and hedge currency risks. Pricing dynamics reflect raw-material volatility. Suppliers with captive lignosulfonate or synthetic capability cushion cost spikes, while smaller firms face margin squeeze. Long-term contracts with ready-mix majors improve visibility and reinforce switching barriers. Market concentration remains moderate.
Concrete Retarders Industry Leaders
RPM International Inc.
Saint-Gobain
Sika AG
MAPEI S.p.A.
Jiangsu Subote New Material Co., Ltd.
- *Disclaimer: Major Players sorted in no particular order

Recent Industry Developments
- February 2025: Saint-Gobain completed the acquisition of FOSROC, Inc., a global construction chemicals player. This represents another important step in establishing Saint-Gobain’s worldwide presence in construction chemicals, including concrete retarders.
- May 2023: Sika completed the acquisition of MBCC Group to expand its footprint across all regions, reinforce its range of products and services, including concrete retarders, throughout the entire construction life cycle.


Global Concrete Retarders Market Report Scope
Commercial, Industrial and Institutional, Infrastructure, Residential are covered as segments by End Use Sector. Asia-Pacific, Europe, Middle East and Africa, North America, South America are covered as segments by Region.| Liquid |
| Powder |
| Commercial |
| Industrial and Institutional |
| Infrastructure |
| Residential |
| Asia-Pacific | Australia |
| China | |
| India | |
| Indonesia | |
| Japan | |
| Malaysia | |
| South Korea | |
| Thailand | |
| Vietnam | |
| Rest of Asia-Pacific | |
| North America | Canada |
| Mexico | |
| United States | |
| Europe | France |
| Germany | |
| Italy | |
| Russia | |
| Spain | |
| United Kingdom | |
| Rest of Europe | |
| South America | Argentina |
| Brazil | |
| Rest of South America | |
| Middle East and Africa | Saudi Arabia |
| United Arab Emirates | |
| Rest of Middle East and Africa |
| By Form | Liquid | |
| Powder | ||
| By End-Use Sector | Commercial | |
| Industrial and Institutional | ||
| Infrastructure | ||
| Residential | ||
| By Geography | Asia-Pacific | Australia |
| China | ||
| India | ||
| Indonesia | ||
| Japan | ||
| Malaysia | ||
| South Korea | ||
| Thailand | ||
| Vietnam | ||
| Rest of Asia-Pacific | ||
| North America | Canada | |
| Mexico | ||
| United States | ||
| Europe | France | |
| Germany | ||
| Italy | ||
| Russia | ||
| Spain | ||
| United Kingdom | ||
| Rest of Europe | ||
| South America | Argentina | |
| Brazil | ||
| Rest of South America | ||
| Middle East and Africa | Saudi Arabia | |
| United Arab Emirates | ||
| Rest of Middle East and Africa | ||


Market Definition
- END-USE SECTOR - Concrete retarder admixtures consumed in the construction sectors such as commercial, residential, industrial, institutional, and infrastructure are considered under the scope of the study.
- PRODUCT/APPLICATION - Under the scope of the study, the consumption of water-based and solvent-based concrete retarders are considered.
| Keyword | Definition |
|---|---|
| Accelerator | Accelerators are admixtures used to fasten the setting time of concrete by increasing the initial rate and speeding up the chemical reaction between cement and the mixing water. These are used to harden and increase the strength of concrete quickly. |
| Acrylic | This synthetic resin is a derivative of acrylic acid. It forms a smooth surface and is mainly used for various indoor applications. The material can also be used for outdoor applications with a special formulation. |
| Adhesives | Adhesives are bonding agents used to join materials by gluing. Adhesives can be used in construction for many applications, such as carpet laying, ceramic tiles, countertop lamination, etc. |
| Air Entraining Admixture | Air-entraining admixtures are used to improve the performance and durability of concrete. Once added, they create uniformly distributed small air bubbles to impart enhanced properties to the fresh and hardened concrete. |
| Alkyd | Alkyds are used in solvent-based paints such as construction and automotive paints, traffic paints, flooring resins, protective coatings for concrete, etc. Alkyd resins are formed by the reaction of an oil (fatty acid), a polyunsaturated alcohol (Polyol), and a polyunsaturated acid or anhydride. |
| Anchors and Grouts | Anchors and grouts are construction chemicals that stabilize and improve the strength and durability of foundations and structures like buildings, bridges, dams, etc. |
| Cementitious Fixing | Cementitious fixing is a process in which a cement-based grout is pumped under pressure to fill forms, voids, and cracks. It can be used in several settings, including bridges, marine applications, dams, and rock anchors. |
| Commercial Construction | Commercial construction comprises new construction of warehouses, malls, shops, offices, hotels, restaurants, cinemas, theatres, etc. |
| Concrete Admixtures | Concrete admixtures comprise water reducers, air entrainers, retarders, accelerators, superplasticizers, etc., added to concrete before or during mixing to modify its properties. |
| Concrete Protective Coatings | To provide specific protection, such as anti-carbonation or chemical resistance, a film-forming protective coat can be applied on the surface. Depending on the applications, different resins like epoxy, polyurethane, and acrylic can be used for concrete protective coatings. |
| Curing Compounds | Curing compounds are used to cure the surface of concrete structures, including columns, beams, slabs, and others. These curing compounds keep the moisture inside the concrete to give maximum strength and durability. |
| Epoxy | Epoxy is known for its strong adhesive qualities, making it a versatile product in many industries. It resists heat and chemical applications, making it an ideal product for anyone needing a stronghold under pressure. It is widely used in adhesives, electrical and electronics, paints, etc. |
| Fiber Wrapping Systems | Fiber Wrapping Systems are a part of construction repair and rehabilitation chemicals. It involves the strengthening of existing structures by wrapping structural members like beams and columns with glass or carbon fiber sheets. |
| Flooring Resins | Flooring resins are synthetic materials applied to floors to enhance their appearance, increase their resistance to wear and tear or provide protection from chemicals, moisture, and stains. Depending on the desired properties and the specific application, flooring resins are available in distinct types, such as epoxy, polyurethane, and acrylic. |
| High-Range Water Reducer (Super Plasticizer) | High-range water reducers are a type of concrete admixture that provides enhanced and improved properties when added to concrete. These are also called superplasticizers and are used to decrease the water-to-cement ratio in concrete. |
| Hot Melt Adhesives | Hot-melt adhesives are thermoplastic bonding materials applied as melts that achieve a solid state and resultant strength on cooling. They are commonly used for packaging, coatings, sanitary products, and tapes. |
| Industrial and Institutional Construction | Industrial and institutional construction includes new construction of hospitals, schools, manufacturing units, energy and power plants, etc. |
| Infrastructure Construction | Infrastructure construction includes new construction of railways, roads, seaways, airports, bridges, highways, etc. |
| Injection Grouting | The process of injecting grout into open joints, cracks, voids, or honeycombs in concrete or masonry structural members is known as injection grouting. It offers several benefits, such as strengthening a structure and preventing water infiltration. |
| Liquid-Applied Waterproofing Membranes | Liquid-Applied membrane is a monolithic, fully bonded, liquid-based coating suitable for many waterproofing applications. The coating cures to form a rubber-like elastomeric waterproof membrane and may be applied over many substrates, including asphalt, bitumen, and concrete. |
| Micro-concrete Mortars | Micro-concrete mortar is made up of cement, water-based resin, additives, mineral pigments, and polymers and can be applied on both horizontal and vertical surfaces. It can be used to refurbish residential complexes, commercial spaces, etc. |
| Modified Mortars | Modified Mortars include Portland cement and sand along with latex/polymer additives. The additives increase adhesion, strength, and shock resistance while also reducing water absorption. |
| Mold Release Agents | Mold release agents are sprayed or coated on the surface of molds to prevent a substrate from bonding to a molding surface. Several types of mold release agents, including silicone, lubricant, wax, fluorocarbons, and others, are used based on the type of substrates, including metals, steel, wood, rubber, plastic, and others. |
| Polyaspartic | Polyaspartic is a subset of polyurea. Polyaspartic floor coatings are typically two-part systems that consist of a resin and a catalyst to ease the curing process. It offers high durability and can withstand harsh environments. |
| Polyurethane | Polyurethane is a plastic material that exists in various forms. It can be tailored to be either rigid or flexible and is the material of choice for a broad range of end-user applications, such as adhesives, coatings, building insulation, etc. |
| Reactive Adhesives | A reactive adhesive is made of monomers that react in the adhesive curing process and do not evaporate from the film during use. Instead, these volatile components become chemically incorporated into the adhesive. |
| Rebar Protectors | In concrete structures, rebar is one of the important components, and its deterioration due to corrosion is a major issue that affects the safety, durability, and life span of buildings and structures. For this reason, rebar protectors are used to protect against degrading effects, especially in infrastructure and industrial construction. |
| Repair and Rehabilitation Chemicals | Repair and Rehabilitation Chemicals include repair mortars, injection grouting materials, fiber wrapping systems, micro-concrete mortars, etc., used to repair and restore existing buildings and structures. |
| Residential Construction | Residential construction involves constructing new houses or spaces like condominiums, villas, and landed homes. |
| Resin Fixing | The process of using resins like epoxy and polyurethane for grouting applications is called resin fixing. Resin fixing offers several advantages, such as high compressive and tensile strength, negligible shrinkage, and greater chemical resistance compared to cementitious fixing. |
| Retarder | Retarders are admixtures used to slow down the setting time of concrete. These are usually added with a dosage rate of around 0.2% -0.6% by weight of cement. These admixtures slow down hydration or lower the rate at which water penetrates the cement particles by making concrete workable for a long time. |
| Sealants | A sealant is a viscous material that has little or no flow qualities, which causes it to remain on surfaces where they are applied. Sealants can also be thinner, enabling penetration to a certain substance through capillary action. |
| Sheet Waterproofing Membranes | Sheet membrane systems are reliable and durable thermoplastic waterproofing solutions that are used for waterproofing applications even in the most demanding below-ground structures, including those exposed to highly aggressive ground conditions and stress. |
| Shrinkage Reducing Admixture | Shrinkage-reducing admixtures are used to reduce concrete shrinkage, whether from drying or self-desiccation. |
| Silicone | Silicone is a polymer that contains silicon combined with carbon, hydrogen, oxygen, and, in some cases, other elements. It is an inert synthetic compound that comes in various forms, such as oil, rubber, and resin. Due to its heat-resistant properties, it finds applications in sealants, adhesives, lubricants, etc. |
| Solvent-borne Adhesives | Solvent-borne adhesives are mixtures of solvents and thermoplastic or slightly cross-linked polymers such as polychloroprene, polyurethane, acrylic, silicone, and natural and synthetic rubbers. |
| Surface Treatment Chemicals | Surface treatment chemicals are chemicals used to treat concrete surfaces, including roofs, vertical surfaces, and others. They act as curing compounds, demolding agents, rust removers, and others. They are cost-effective and can be used on roadways, pavements, parking lots, and others. |
| Viscosity Modifier | Viscosity Modifiers are concrete admixtures used to change various properties of admixtures, including viscosity, workability, cohesiveness, and others. These are usually added with a dosage of around 0.01% to 0.1% by weight of cement. |
| Water Reducer | Water reducers, also called plasticizers, are a type of admixture used to decrease the water-to-cement ratio in the concrete, thereby increasing the durability and strength of concrete. Various water reducers include refined lignosulfonates, gluconates, hydroxycarboxylic acids, sugar acids, and others. |
| Water-borne Adhesives | Water-borne adhesives use water as a carrier or diluting medium to disperse resin. They are set by allowing the water to evaporate or be absorbed by the substrate. These adhesives are compounded with water as a dilutant rather than a volatile organic solvent. |
| Waterproofing Chemicals | Waterproofing chemicals are designed to protect a surface from the perils of leakage. A waterproofing chemical is a protective coating or primer applied to a structure's roof, retaining walls, or basement. |
| Waterproofing Membranes | Waterproofing membranes are liquid-applied or self-adhering layers of water-tight materials that prevent water from penetrating or damaging a structure when applied to roofs, walls, foundations, basements, bathrooms, and other areas exposed to moisture or water. |


Research Methodology
Mordor Intelligence follows a four-step methodology in all our reports.
- Step-1: Identify Key Variables: The quantifiable key variables (industry and extraneous) pertaining to the specific product segment and country are selected from a group of relevant variables & factors based on desk research & literature review; along with primary expert inputs. These variables are further confirmed through regression modeling (wherever required).
- Step-2: Build a Market Model: In order to build a robust forecasting methodology, the variables and factors identified in Step-1 are tested against available historical market numbers. Through an iterative process, the variables required for market forecast are set and the model is built on the basis of these variables.
- Step-3: Validate and Finalize: In this important step, all market numbers, variables and analyst calls are validated through an extensive network of primary research experts from the market studied. The respondents are selected across levels and functions to generate a holistic picture of the market studied.
- Step-4: Research Outputs: Syndicated Reports, Custom Consulting Assignments, Databases & Subscription Platforms


