
Commercial Renewable Energy Market Size and Share
Market Overview
| Study Period | 2022 - 2032 |
|---|---|
| Market Size (2027) | USD 1.10 Billion |
| Market Size (2032) | USD 1.49 Billion |
| Growth Rate (2027 - 2032) | 6.26 % |
| Fastest Growing Market | Middle East and Africa |
| Largest Market | Asia-Pacific |
| Market Concentration | Low |
Major Players *Disclaimer: Major Players sorted in no particular order Image © Mordor Intelligence. Reuse requires attribution under CC BY 4.0. | |
Commercial Renewable Energy Market Analysis by Mordor Intelligence
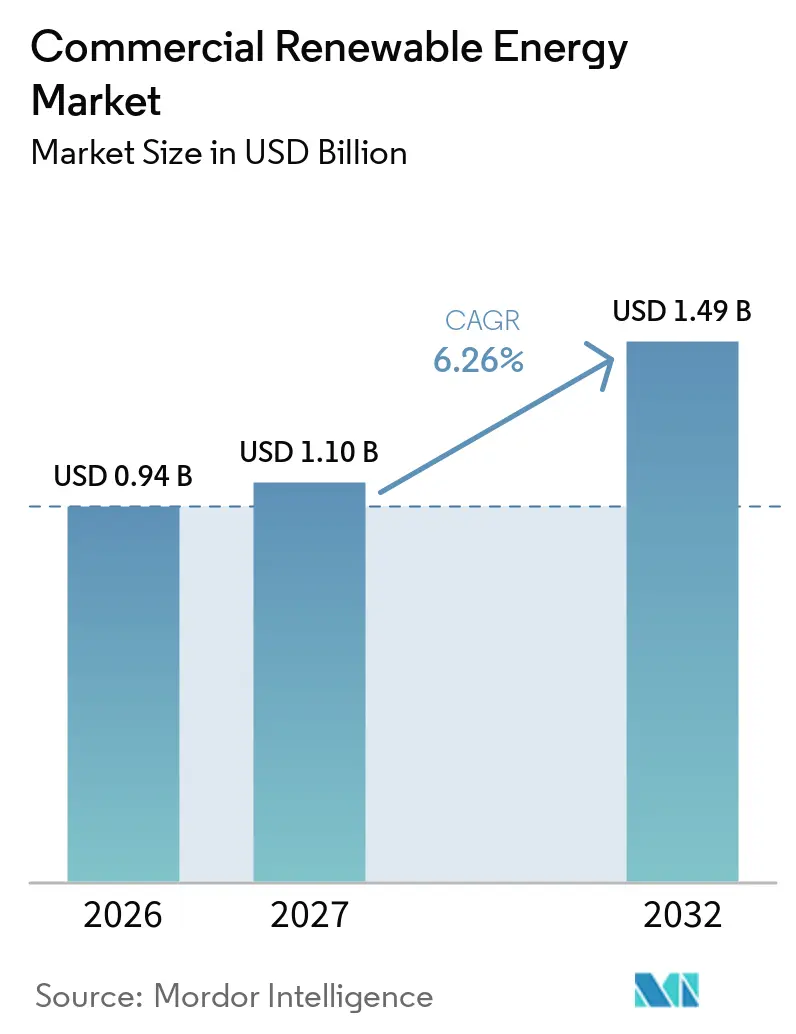
The commercial renewable energy market size is expected to grow from USD 0.94 billion in 2026 to USD 1.10 billion in 2027 and is forecast to reach USD 1.49 billion by 2032 at 6.26% CAGR over 2027-2032. Commercial facilities are increasingly active energy buyers as electricity supply, cost control, and emissions commitments converge in a single procurement decision. Data center demand has tightened access to long-term renewable supply, raising the importance of early contracting for retailers, logistics operators, hospitals, and office portfolios. Lower renewable generation and storage costs support on-site and contracted supply, although connection delays can postpone projects even when the economics are viable.[1] The market is also moving toward contracts that better match the location and timing of electricity use, making procurement structures more important than unbundled certificate purchases. Developers with generation pipelines, balance-sheet capacity, and direct customer relationships are therefore better positioned to secure larger commercial contracts.
Key Report Takeaways
- By type, wind energy led with 31.7% revenue share in 2026, while solar energy is forecast to expand at a 7.2% CAGR through 2032.
- By deployment, on-grid systems held 77.3% of the commercial renewable energy market share in 2026, while off-grid systems recorded the highest projected CAGR at 6.8% through 2032.
- By end user, retail and shopping malls accounted for 25.2% of the commercial renewable energy market size in 2026, while data centers are advancing at an 8.7% CAGR through 2032.
- By geography, Asia-Pacific held 66.5% share in 2026, while Middle East and Africa is forecast to grow at a 7.4% CAGR through 2032.
Note: Market numbers in this report are based on Mordor Intelligence's proprietary estimation framework, which combines nine months of actuals with Q4 projections for base year 2026.
Market Trends and Insights
Drivers Impact Analysis of Commercial Renewable Energy Market*
| Driver | (~) % Impact on CAGR Forecast | Geographic Relevance | Impact Timeline |
|---|---|---|---|
| Corporate renewable procurement for AI and data-centre load growth | +2.1% | Global, concentrated in North America and Asia-Pacific | Short term (≤ 2 years) |
| Falling solar and storage costs and shorter build cycles | +1.5% | Global; strongest in Asia-Pacific and MEA | Medium term (2-4 years) |
| Corporate net-zero commitments and Scope 2 hedging | +1.0% | North America and Europe | Medium term (2-4 years) |
| Green-hydrogen and industrial decarbonization offtake | +0.5% | Europe and Middle East | Long term (≥ 4 years) |
| 24/7 carbon-free energy and locational matching requirements | +0.4% | North America and Europe | Medium term (2-4 years) |
| Multi-buyer aggregation and standardized PPA platforms | +0.3% | Global | Short term (≤ 2 years) |
| Source: Mordor Intelligence | |||
Corporate Renewable Procurement for AI and Data-Center Load Growth
Data centers have become a major source of new electricity demand in 2026, with global consumption reaching 485 TWh and growing 17%. AI-focused facilities have expanded more quickly, increasing the need for long-term renewable contracts near large computing campuses. The International Energy Agency (IEA) expects renewables to meet 50% of growth in data-center electricity demand through 2035. In February 2026, TotalEnergies signed 15-year agreements to supply Google with 1 GW of solar capacity from Texas projects, illustrating the scale of procurement linked to data-center load.[2] For the commercial renewable energy market, this demand can reduce the supply available to smaller buyers and extend their contracting timelines.
Falling Solar, Storage Costs, and Shorter Build Cycles
More than 90% of utility-scale renewable projects commissioned in 2025 supplied power below the cost of the least expensive new fossil-fuel alternative in their markets. The International Renewable Energy Agency (IRENA) reported global average costs of USD 33/MWh for onshore wind and USD 44/MWh for solar PV in 2025. Installed battery energy storage costs fell 95% from 2010 to USD 140/kWh in 2025, supporting the use of storage alongside solar generation. Rooftop solar combined with behind-the-meter storage can extend self-consumption and reduce exposure to peak electricity charges. The commercial renewable energy market still depends on timely permitting, construction, and grid access, as lower equipment prices do not resolve connection constraints.
Corporate Net-Zero, Scope 2, and 24/7 Matching Requirements
The Science Based Targets initiative released Corporate Net-Zero Standard Version 2.0 in June 2026 and plans to accept new submissions under the standard from early 2027. The standard places greater emphasis on whether contracted low-carbon electricity can be delivered to the point and time of consumption. This approach favors physically delivered power purchase agreements and virtual contracts with stronger matching arrangements over standalone certificates. Companies with rising electricity demand must also address Scope 2 emissions through a defined reduction pathway. As a result, retailers, healthcare providers, and hospitality companies may reassess contracts across multiple jurisdictions to align procurement with their stated emissions targets.
Multi-Buyer PPAs and Industrial Offtake
Multi-buyer contracts can give smaller commercial purchasers access to renewable projects that would otherwise require a larger credit profile. In 2026, Statkraft AS, PepsiCo Inc., Givaudan SA, and Smurfit Westrock plc signed a 10-year virtual power purchase agreement tied to a repowered wind project in Spain. Repsol SA also signed nine virtual power purchase agreements with Grupo Bimbo SAB de CV in 2026 for renewable supply across Spain, Portugal, France, and Italy. Standardized documentation and shared risk can lower barriers for smaller buyers, while green hydrogen and industrial decarbonization projects can add long-term offtake demand. These arrangements broaden participation in the commercial renewable energy market, but they may also reduce intermediary margins as contracting becomes more repeatable.
Restraints Impact Analysis of Commercial Renewable Energy Market*
| Restraint | (~) % Impact on CAGR Forecast | Geographic Relevance | Impact Timeline |
|---|---|---|---|
| Interconnection queues, transmission bottlenecks and curtailment | -1.8% | North America and Europe, spill-over to APAC | Medium term (2-4 years) |
| High upfront capital costs and counterparty risk for smaller buyers | -0.9% | Global; more acute in South America and MEA | Short term (≤ 2 years) |
| Negative pricing, cannibalization and merchant-price exposure | -0.6% | Europe; spill-over to APAC | Medium term (2-4 years) |
| Carbon-accounting uncertainty for hourly and cross-border claims | -0.4% | Global | Medium term (2-4 years) |
| Source: Mordor Intelligence | |||
Interconnection Queues, Transmission Bottlenecks, and Curtailment
Grid access is the most direct physical constraint on the commercial renewable energy market. The United States had 2,060 GW of generation and storage awaiting interconnection at the end of 2025, with median wait times exceeding five years. A peer-reviewed study identified grid connection delays as a significant barrier to renewable deployment in the United States. These delays increase development and financing costs for projects supplying off-site commercial power purchase agreements (PPAs). Reforms under Federal Energy Regulatory Commission (FERC) Order 2023 introduced changes to the interconnection process; however, developers continue to face lengthy studies and technical requirements.[3]
Capital, Merchant-Price, and Carbon-Accounting Risk for Smaller Buyers
Behind-the-meter projects can require commitments from both landlords and tenants, complicating ownership and financing arrangements for leased sites. Energy-as-a-service and Commercial Property Assessed Clean Energy (C-PACE) structures can transfer some asset risk, but long contract periods may not suit buyers with changing property portfolios. Smaller buyers may also face stricter credit reviews for PPAs and higher transaction costs in markets without credit support. Negative pricing, renewable energy oversupply, and merchant-price exposure can reduce project revenue where supply is concentrated within similar time periods. Carbon-accounting uncertainty related to hourly and cross-border claims adds further risk, particularly as buyers move away from simple annual certificate matching.
*Our forecasts treat driver/restraint impacts as directional, not additive. The impact forecasts reflect baseline growth, mix effects, and variable interactions.
Commercial Renewable Energy Market Segment Analysis
By Type:
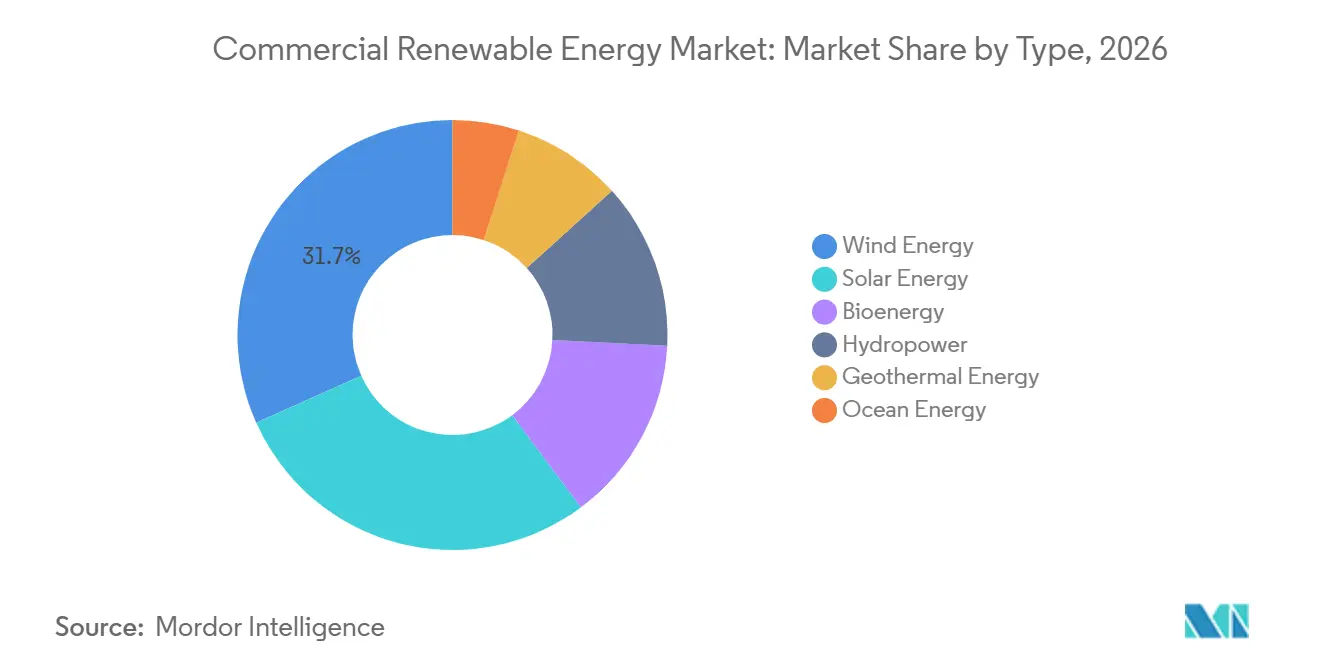
Solar’s Cost Advantage Narrows Wind’s LeadWind energy held 31.7% of the commercial renewable energy market share in 2026, reflecting its established role in large corporate power purchase agreements. Solar energy is forecast to grow at a 7.2% CAGR through 2032, the fastest pace among the listed energy types. Wind projects can serve large contracts where scale and long-duration offtake are central to procurement. Solar has a deployment advantage for commercial customers because it can be installed on rooftops and parking structures near the point of demand. Its modular design also allows facilities to expand capacity incrementally rather than wait for a single large project.
Solar Photovoltaic (PV) cost USD 44/MWh in 2025, while onshore wind cost USD 33/MWh, according to the International Renewable Energy Agency (IRENA). This comparison does not fully capture commercial site conditions, where available space, retail electricity tariffs, and local connection costs shape the final choice. Bioenergy remains relevant for facilities that need steady heat and power, including food processing and hospitality operations. Geothermal, hydropower, and ocean energy remain limited by site-specific resource conditions. In 2026, Nadara signed a 434 MW hybrid wind and solar agreement with Trafigura in Spain, illustrating how hybrid projects can improve the use of existing renewable assets.[4]

By Deployment:
Off-Grid Systems Respond to Reliability NeedsOn-grid systems accounted for 77.3% of the commercial renewable energy market in 2026, as grid-tied contracts and net-metering arrangements remain the primary supply route for large portfolios. Off-grid systems are forecast to grow at a 6.8% CAGR through 2032. Their appeal is strongest where data centers, cold-chain sites, and logistics facilities cannot rely on consistent utility service. Off-grid solar and storage are used to support operational continuity at sites with frequent outages. On-grid procurement is also evolving as buyers seek storage-backed contracts that better match demand over time.
The IEA identified rapid growth in renewable electricity in markets including South Africa and Pakistan, where reliability needs support distributed solar and storage adoption. In India, the Ministry of New and Renewable Energy reported strong additions across renewable technologies during fiscal 2025-26, supported by a broader policy focus on clean power. Battery co-location enables commercial facilities to store solar output, manage peak demand, and improve the reliability of on-site supply. A German Deutsche Bahn Schenker site combined rooftop solar, battery storage, and electric vehicle charging in one system, demonstrating how logistics locations can integrate power and transport needs. Grid-linked and off-grid solutions are increasingly used together rather than as alternatives.
By End User:
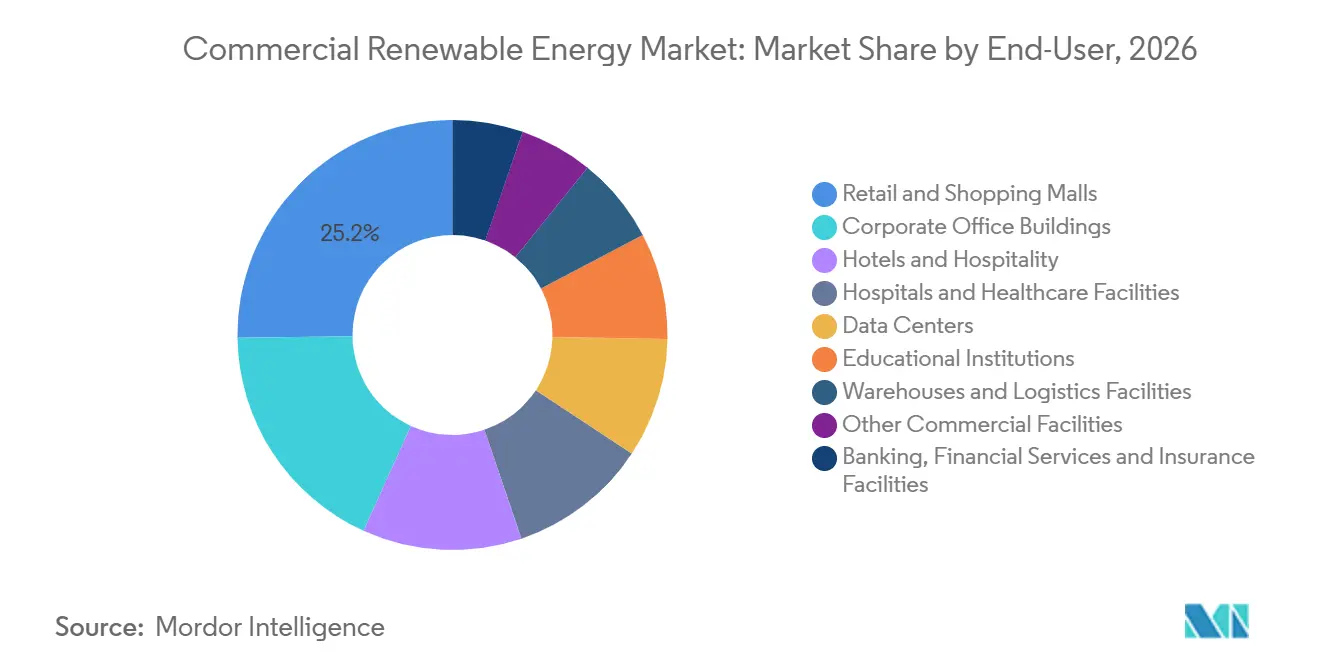
Data Centers Lead Growth While Retail Holds VolumeRetail and shopping malls accounted for 25.2% of the commercial renewable energy market in 2026, supported by large rooftop areas and daytime electricity demand. Data centers are forecast to grow at an 8.7% CAGR through 2032. Retail properties can use on-site solar to align production with daytime loads and reduce exposure to retail power prices. Data centers require dependable electricity at all hours, which drives demand for large power purchase agreements, storage, and firm generation. Warehouses and logistics facilities also offer suitable roof areas and gain additional value as fleets adopt electric vehicles.
In July 2026, Energiekontor, Energie Handels Gesellschaft, and dm-drogerie markt signed a 10-year agreement for power from the planned Solarpark Kolitzheim-Herlheim in Germany. Corporate offices, hotels, hospitals, schools, and Banking, Financial Services, and Insurance (BFSI) facilities each have different operating requirements for renewable procurement. Hospitals place greater weight on resilience, while hotels can align daytime cooling loads with solar output in suitable locations. Office portfolios can combine on-site systems with virtual power purchase agreements where direct installation is not possible. As data center contracts secure an increasing share of new capacity, other end users in the commercial renewable energy market may need to procure earlier or use aggregated contracts.
Geography Analysis
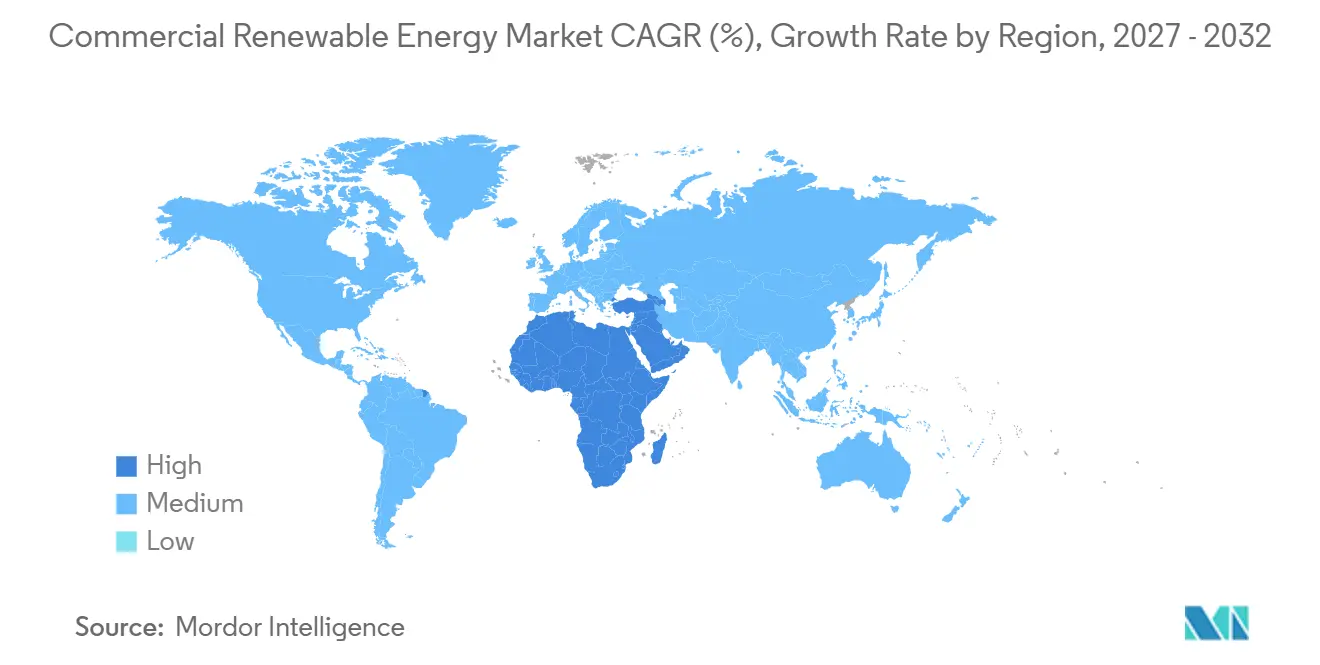
Asia-Pacific held 66.5% of the commercial renewable energy market share in 2026, supported by the scale of China's renewable buildout and India's commercial and industrial activity. China's move toward market-based pricing for grid-connected renewable projects has increased the relevance of direct-market contracts and provincial arrangements. India continues to build renewable capacity under national policy frameworks that support clean electricity use. The Ministry of New and Renewable Energy and Ministry of Power set a renewable purchase obligation target of 43.33% of total electricity consumption from renewable sources by fiscal 2030. Japan and South Korea are advancing corporate procurement frameworks, although permitting and grid access remain constraints.
North America and Europe remain important markets for corporate power purchase agreements, particularly for large technology, retail, and industrial buyers. In the United States, pressure on supply is strongest in locations serving major data center development, where new capacity must also navigate interconnection queues. Europe has a deeper base of cross-border commercial contracting, as demonstrated by Statkraft's 10-year agreement to supply Makro and Shell España with 85 GWh annually for 37 retail centers in Spain. Germany continues to support solar deployment under its policy framework for non-residential properties. South America is adding renewable capacity, and Vestas received an order for turbines for the 230 MW Esquina do Vento project in Brazil in 2026.
The Middle East and Africa is forecast to grow at a 7.4% CAGR through 2032, the fastest regional pace in the commercial renewable energy market. Saudi Arabia and the United Arab Emirates are expanding renewable capacity through large procurement programs and national targets. Saudi Arabia added 7.8 GW of solar capacity in 2025, according to the national program's reported project pipeline and commissioning activity. The region's sovereign-backed project model can coordinate generation and transmission investment more closely than markets with fragmented grid planning. Commercial buyers in the region can benefit where new transmission capacity and renewable development are delivered together.
Competitive Landscape
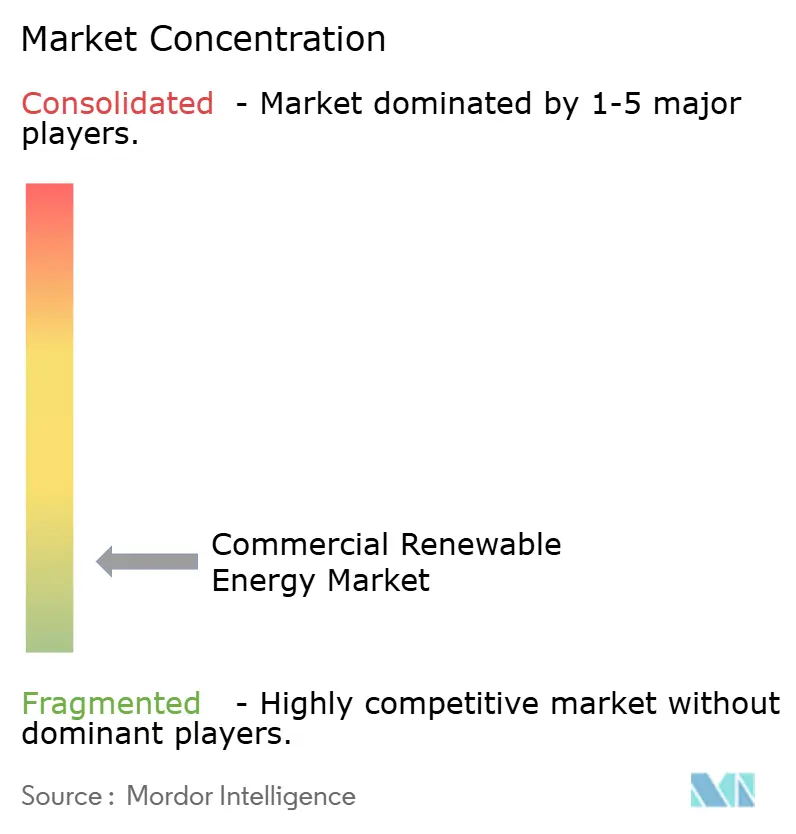
The commercial renewable energy market is fragmented among numerous regional project developers, while power purchase agreement brokers and aggregation platforms compete for smaller buyers. Localized developers, mid-sized independent power producers, and regional utilities have advantages in agility, local community relationships, and navigating municipal permitting processes. Their decentralized structure is relevant where buyers need smaller, site-specific contracts or customized supply arrangements tailored to distinct local regulations. Developers serving these commercial contracts must rely heavily on joint ventures and third-party financing to carry projects through long development cycles, creating an open market for smaller firms to capture niche regional demand.
Technology and industrial groups are also important to project execution. In 2026, Vestas Wind Systems received firm orders from RWE Renewables for the 1,380 MW Norfolk Vanguard East project and the 1,380 MW Norfolk Vanguard West project in the United Kingdom. RWE reported that its 1.1 GW Thor offshore wind farm in Denmark had reached 50% turbine installation in July 2026. These projects illustrate how equipment supply and project delivery affect the availability of long-term renewable electricity for commercial buyers. Digital monitoring, dispatch tools, and carbon-accounting capabilities are becoming more relevant as customers seek closer alignment between consumption and procurement.
Regional developers such as ReNew Energy Global and Scatec Solar compete with larger utilities for commercial and industrial contracts in India and Africa. They compete through local execution capability, contract flexibility, and familiarity with local permitting and customer requirements. Aggregation platforms provide an additional route for medium-sized buyers that cannot independently sign large contracts.
Commercial Renewable Energy Industry Leaders
-
NextEra Energy, Inc.
-
Brookfield Renewable Partners L.P.
-
State Power Investment Corporation
-
Enel Green Power S.p.A.
-
CHN Energy
- *Disclaimer: Major Players sorted in no particular order
Commercial Renewable Energy Market Companies Covered in this Report
- NextEra Energy, Inc.
- Brookfield Renewable Partners L.P.
- Iberdrola, S.A.
- Enel Green Power S.p.A.
- GE Vernova Inc.
- ENGIE SA
- Ørsted A/S
- Vestas Wind Systems A/S
- Siemens Gamesa Renewable Energy, S.A.
- EDF Renewables
- Acciona Energía, S.A.
- RWE Renewables GmbH
- ACWA Power Company
- EDP Renováveis, S.A.
- Statkraft AS
- Invenergy LLC
- ReNew Energy Global PLC
- Scatec ASA
- First Solar, Inc.
- JinkoSolar Holding Co., Ltd.
- Canadian Solar Inc.
- Sungrow Power Supply Co., Ltd.
- AES Clean Energy
- Clearway Energy Group LLC
Recent Industry Developments in Commercial Renewable Energy Market
- July 2026: RWE announced that its 1.1 GW Thor Offshore Wind Farm in Denmark had reached 50% turbine installation, with 36 of 72 turbines installed. The project utilizes Siemens Gamesa turbines and includes the first commercial-scale deployment of recyclable wind turbine blades. Full installation is expected by the end of 2026, with commissioning targeted for spring 2027.
- July 2026: Vestas received a firm order from RWE for the 1,380 MW Norfolk Vanguard East offshore wind project in the United Kingdom. Combined with the previously awarded Norfolk Vanguard West contract, the two projects total 2.76 GW, making them among the largest offshore wind developments supporting the United Kingdom's clean energy transition.
- February 2026: TotalEnergies signed two long-term power purchase agreements with Google to supply electricity from 1 GW of solar capacity located in Texas. The agreements cover approximately 28 TWh of renewable electricity over 15 years and represent one of the largest corporate renewable energy procurement deals globally.
- December 2025: Ørsted and Nuveen Infrastructure's 913 MW Borkum Riffgrund 3 offshore wind farm delivered first electricity to the German grid. The project supports multiple long-term corporate power purchase agreements with industrial and technology-sector customers and ranks among Germany's most significant offshore wind developments.
Global Commercial Renewable Energy Market Report Scope
Commercial renewable energy refers to clean, zero-emission electricity generated from natural sources such as solar, wind, hydro, and biomass, procured and used by businesses, institutions, and industrial enterprises. Unlike residential renewable energy installations, commercial deployments range from large on-site rooftop systems to utility-scale off-site projects contracted through long-term corporate Power Purchase Agreements (PPAs). This framework enables corporations to secure stable, predictable energy costs while reducing exposure to volatile fossil fuel markets and lowering operational expenditures. It also serves as a key mechanism for enterprises to reduce corporate Scope 2 carbon emissions, meet Environmental, Social, and Governance (ESG) compliance requirements, and fulfill net-zero sustainability commitments.
The global commercial renewable energy market is segmented by type into wind energy, solar energy, bioenergy, geothermal energy, hydropower, and ocean energy. By deployment, the market is segmented into on-grid and off-grid systems. By end user, the market is segmented into retail and shopping malls, corporate office buildings, hotels and hospitality, hospitals and healthcare facilities, data centers, educational institutions, warehouses and logistics facilities, banking, financial services and insurance facilities, and other commercial facilities. The report also covers market size and forecasts for the global commercial renewable energy market across 26 countries in key regions. For each segment, market sizing and forecasts are provided on the basis of value (USD).
Segmentation Overview
| Wind Energy |
| Solar Energy |
| Bioenergy |
| Geothermal Energy |
| Hydropower |
| Ocean Energy |
| On-Grid |
| Off-Grid |
| Retail and Shopping Malls |
| Corporate Office Buildings |
| Hotels and Hospitality |
| Hospitals and Healthcare Facilities |
| Data Centers |
| Educational Institutions |
| Warehouses and Logistics Facilities |
| Banking, Financial Services and Insurance Facilities |
| Other Commercial Facilities |
| North America | United States |
| Canada | |
| Mexico | |
| Europe | Germany |
| France | |
| Italy | |
| Spain | |
| United Kingdom | |
| Poland | |
| Russia | |
| Rest of Europe | |
| Asia-Pacific | China |
| India | |
| Japan | |
| South Korea | |
| Australia | |
| Indonesia | |
| Vietnam | |
| Thailand | |
| Rest of Asia-Pacific | |
| South America | Brazil |
| Argentina | |
| Chile | |
| Rest of South America | |
| Middle East and Africa | Saudi Arabia |
| United Arab Emirates | |
| Egypt | |
| South Africa | |
| Morocco | |
| Rest of Middle East and Africa |
| By Type | Wind Energy | |
| Solar Energy | ||
| Bioenergy | ||
| Geothermal Energy | ||
| Hydropower | ||
| Ocean Energy | ||
| By Deployment | On-Grid | |
| Off-Grid | ||
| By End User | Retail and Shopping Malls | |
| Corporate Office Buildings | ||
| Hotels and Hospitality | ||
| Hospitals and Healthcare Facilities | ||
| Data Centers | ||
| Educational Institutions | ||
| Warehouses and Logistics Facilities | ||
| Banking, Financial Services and Insurance Facilities | ||
| Other Commercial Facilities | ||
| By Geography | North America | United States |
| Canada | ||
| Mexico | ||
| Europe | Germany | |
| France | ||
| Italy | ||
| Spain | ||
| United Kingdom | ||
| Poland | ||
| Russia | ||
| Rest of Europe | ||
| Asia-Pacific | China | |
| India | ||
| Japan | ||
| South Korea | ||
| Australia | ||
| Indonesia | ||
| Vietnam | ||
| Thailand | ||
| Rest of Asia-Pacific | ||
| South America | Brazil | |
| Argentina | ||
| Chile | ||
| Rest of South America | ||
| Middle East and Africa | Saudi Arabia | |
| United Arab Emirates | ||
| Egypt | ||
| South Africa | ||
| Morocco | ||
| Rest of Middle East and Africa | ||
Key Questions Answered in the Report
What is the forecast growth rate for the commercial renewable energy market?
The commercial renewable energy market is forecast to grow at a CAGR of 6.26% from 2027 to 2032, reaching USD 1.49 billion.
Which renewable energy technology holds the largest share in the commercial market?
Wind energy held the largest share at 31.7% in 2026, while solar is projected to grow the fastest at a CAGR of 7.2% through 2032.
Why are data centers driving increased demand for renewable power?
Global data center electricity use reached 485 TWh in 2025. Data centers are the fastest-growing end-user segment, expanding at a CAGR of 8.7%.
What is the primary barrier to commercial renewable energy deployment?
Grid interconnection is a major barrier. At the end of 2025, the United States had 2,060 GW of generation and storage capacity waiting for grid connection.
Why is demand for off-grid commercial systems growing?
Off-grid systems are projected to grow at a CAGR of 6.8%, as storage-backed systems can improve reliability for facilities with critical power needs.
Which region leads in commercial renewable energy deployment?
Asia-Pacific led with a 66.5% share in 2026, while the Middle East and Africa is forecast to grow the fastest at a CAGR of 7.4% through 2032.