Chromatography Instrumentation Market Size and Share
Market Overview
| Study Period | 2020 - 2031 |
|---|---|
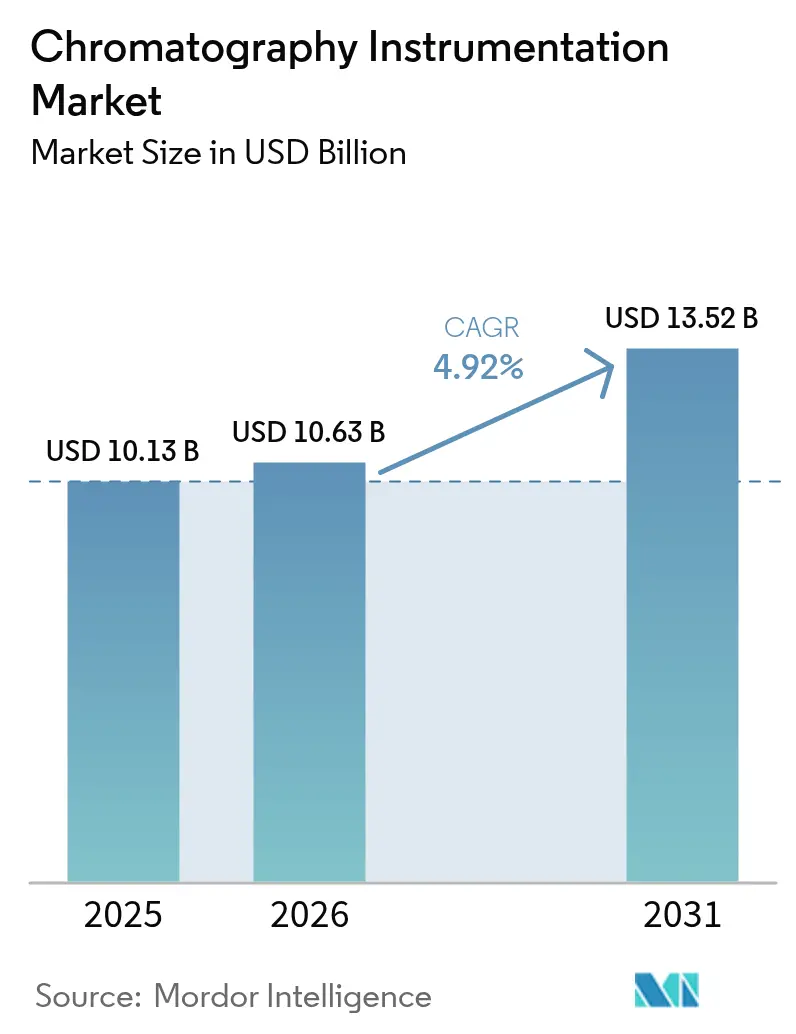
| Market Size (2026) | USD 10.63 Billion |
| Market Size (2031) | USD 13.52 Billion |
| Growth Rate (2026 - 2031) | 4.92% CAGR |
| Fastest Growing Market | Asia Pacific |
| Largest Market | North America |
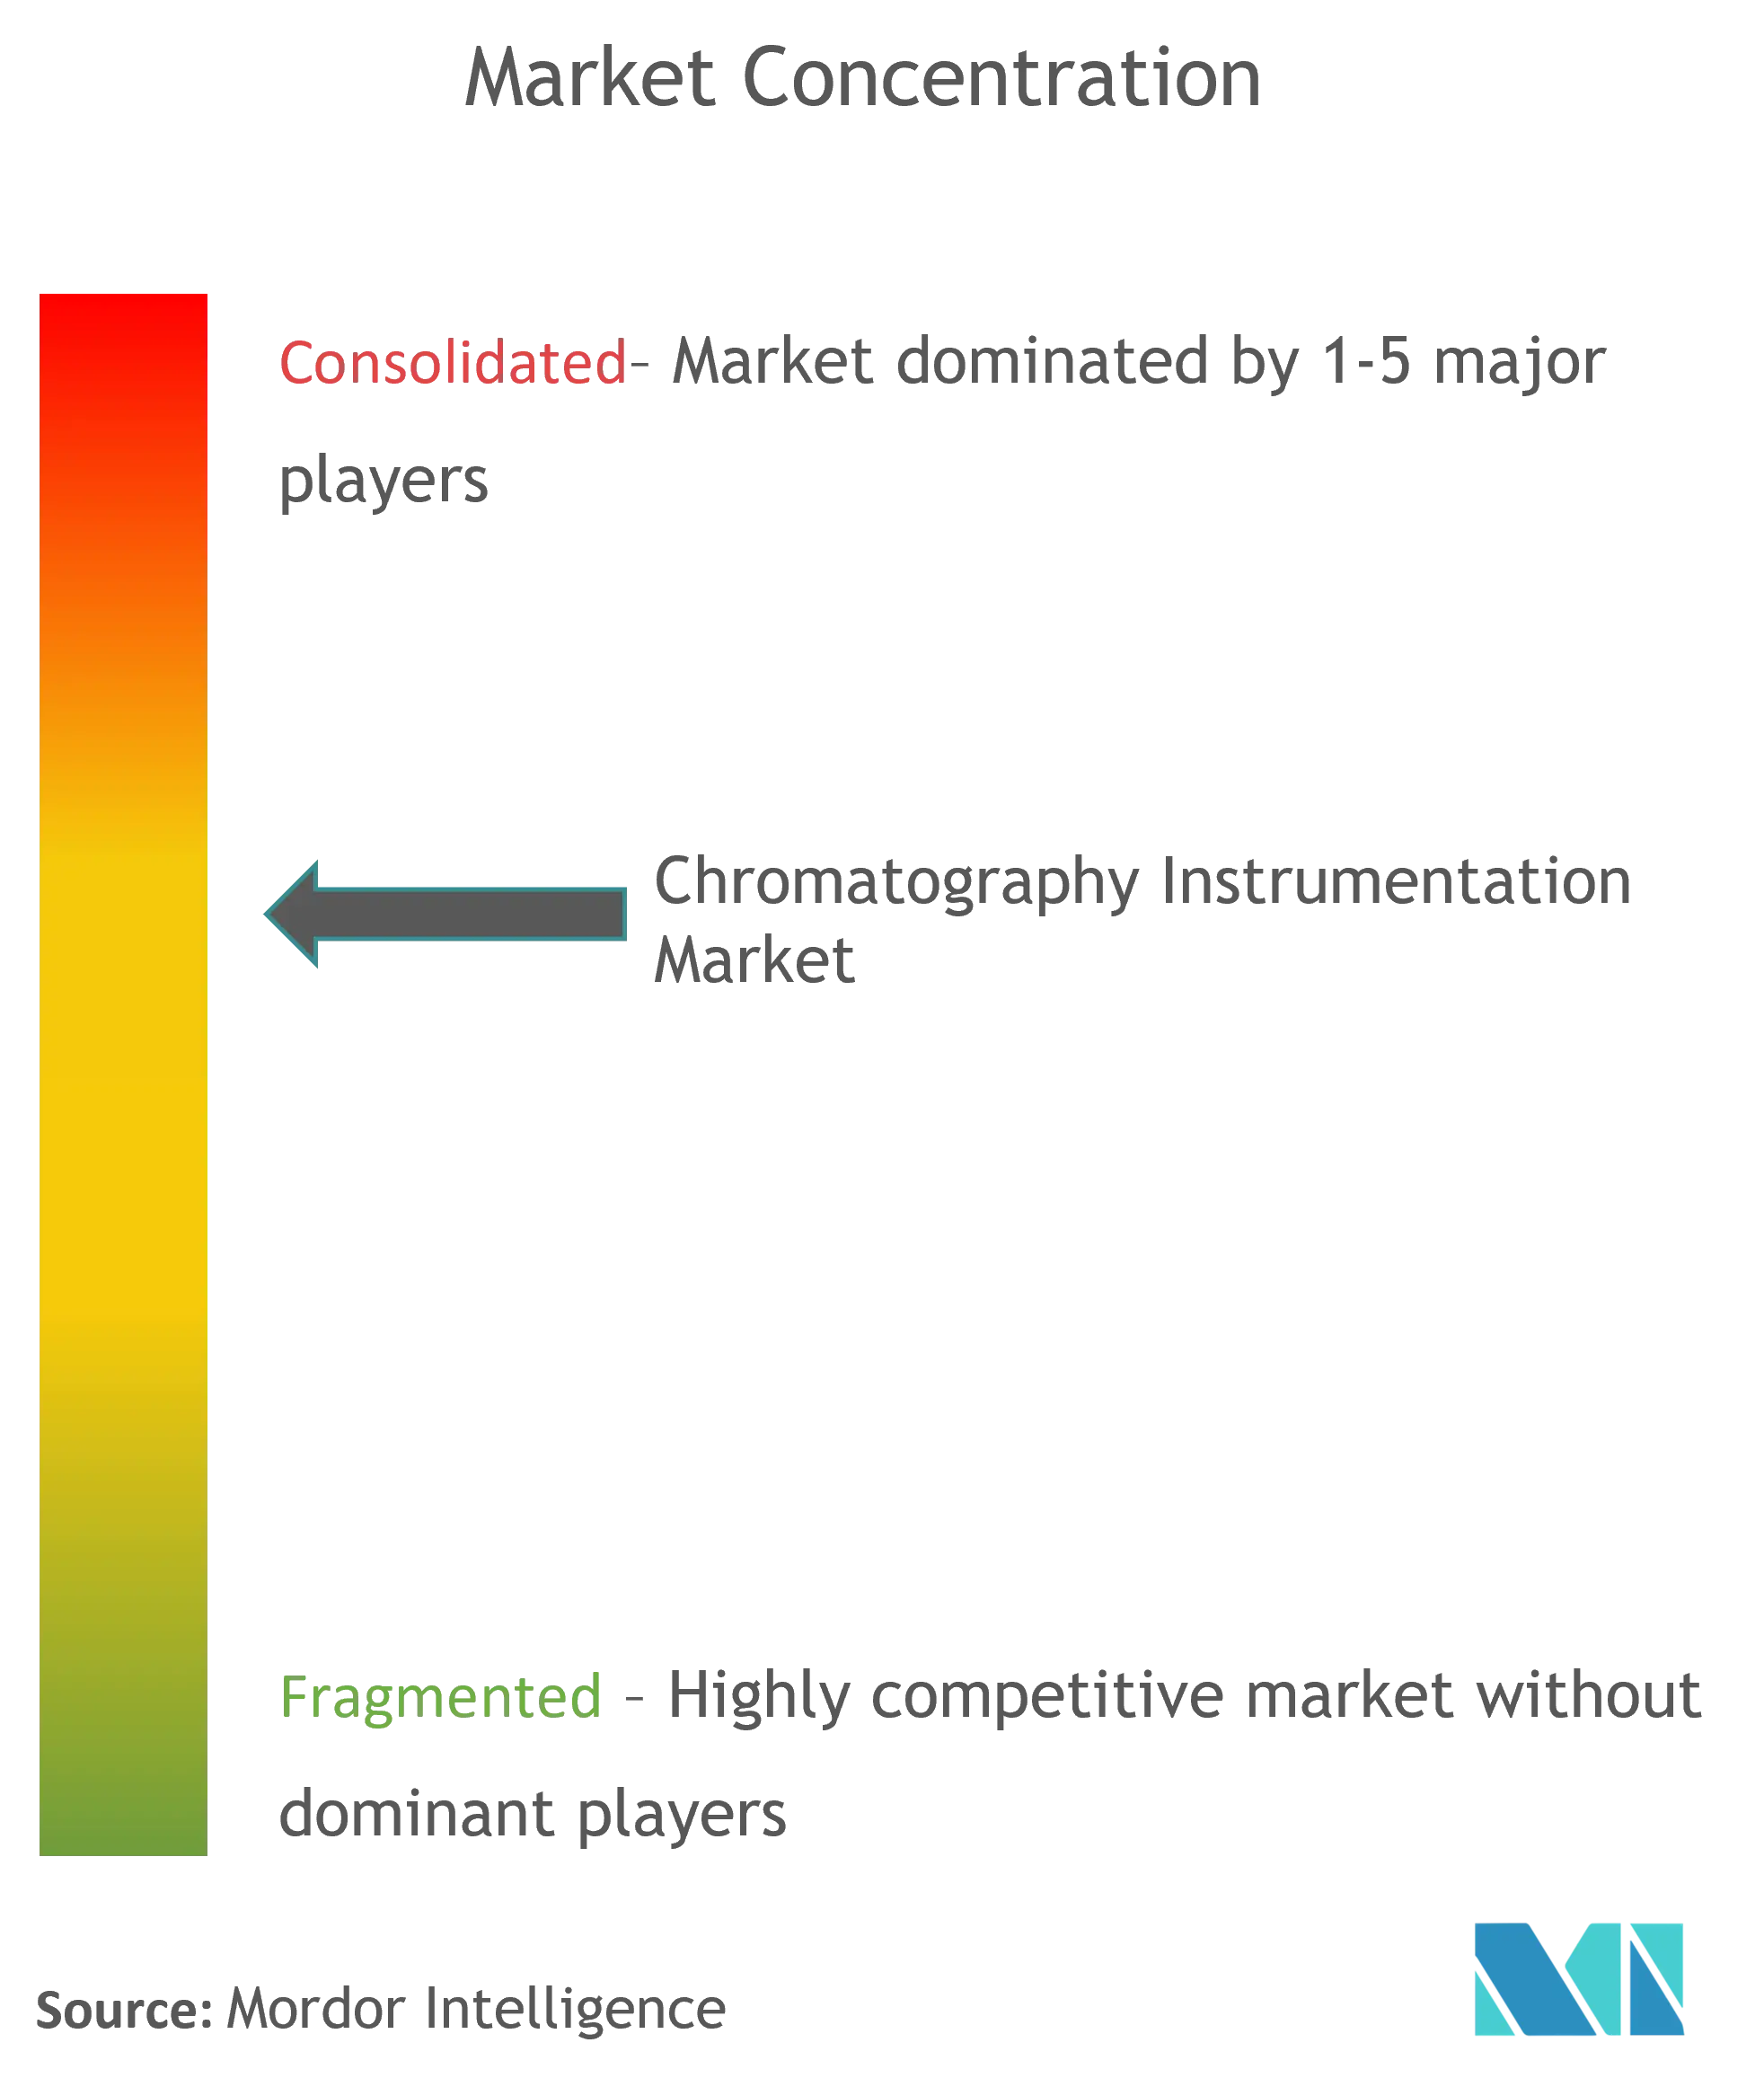
| Market Concentration | Medium |
Major Players *Disclaimer: Major Players sorted in no particular order Image © Mordor Intelligence. Reuse requires attribution under CC BY 4.0. | |
Chromatography Instrumentation Market Analysis by Mordor Intelligence
The Global Chromatography Instrumentation Market size is expected to grow from USD 10.13 billion in 2025 to USD 10.63 billion in 2026 and is forecast to reach USD 13.52 billion by 2031 at 4.92% CAGR over 2026-2031.
Rising regulatory scrutiny, expanding biologics pipelines, and rapid automation are reinforcing demand, while artificial-intelligence-enabled platforms are cutting laboratory cycle times by as much as 40%. Pharmaceutical and biopharmaceutical companies account for the most significant revenue contribution, driven by the US FDA’s more rigorous analytical validation guidelines that favor ultra-high-performance systems.[1]US Food & Drug Administration, “Q2(R2) Validation of Analytical Procedures and Q14 Analytical Procedure Development,” fda.gov Parallel expansion of PFAS monitoring and food-safety testing is adding new application breadth, especially for ion and liquid chromatography platforms. Vendors are responding with greener solvent systems, smaller footprints, and cloud-connected software that supports predictive maintenance. Supply-chain localization for critical columns and resins further supports stable long-term growth as manufacturers mitigate geopolitical risk.
Key Report Takeaways
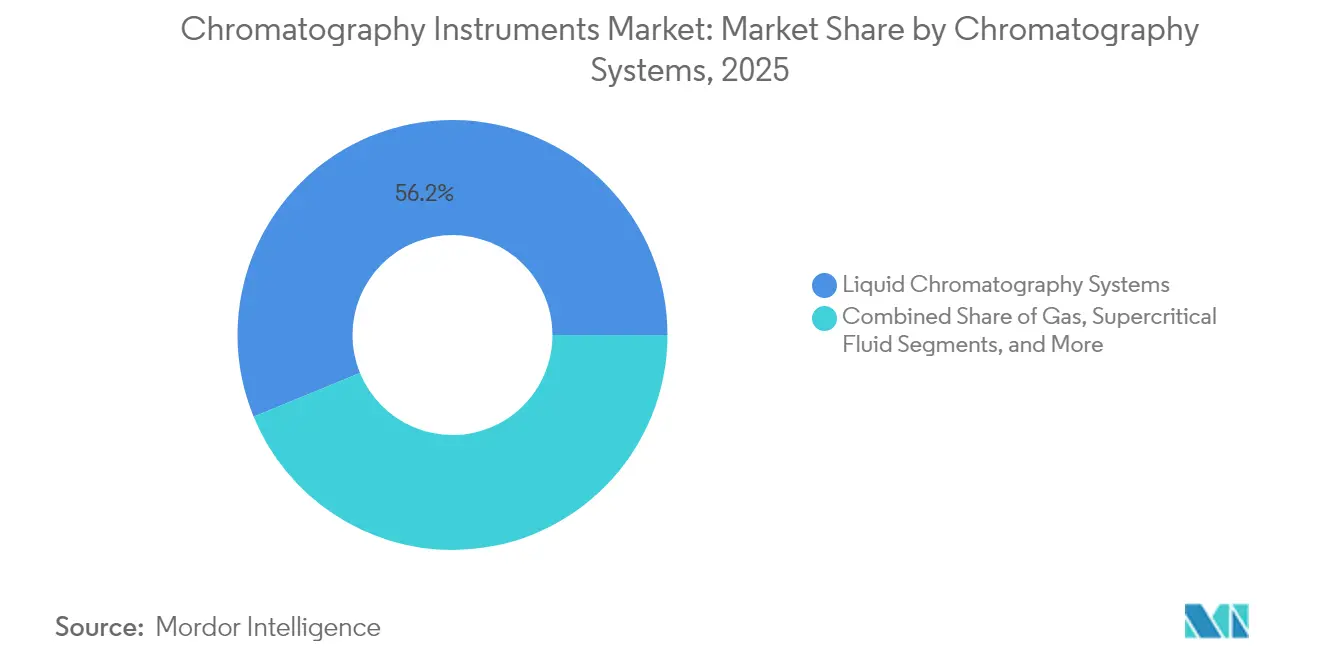
- By device, liquid chromatography systems led with 56.20% of chromatography instrumentation market share in 2025; supercritical fluid chromatography is projected to expand at an 8.45% CAGR through 2031.
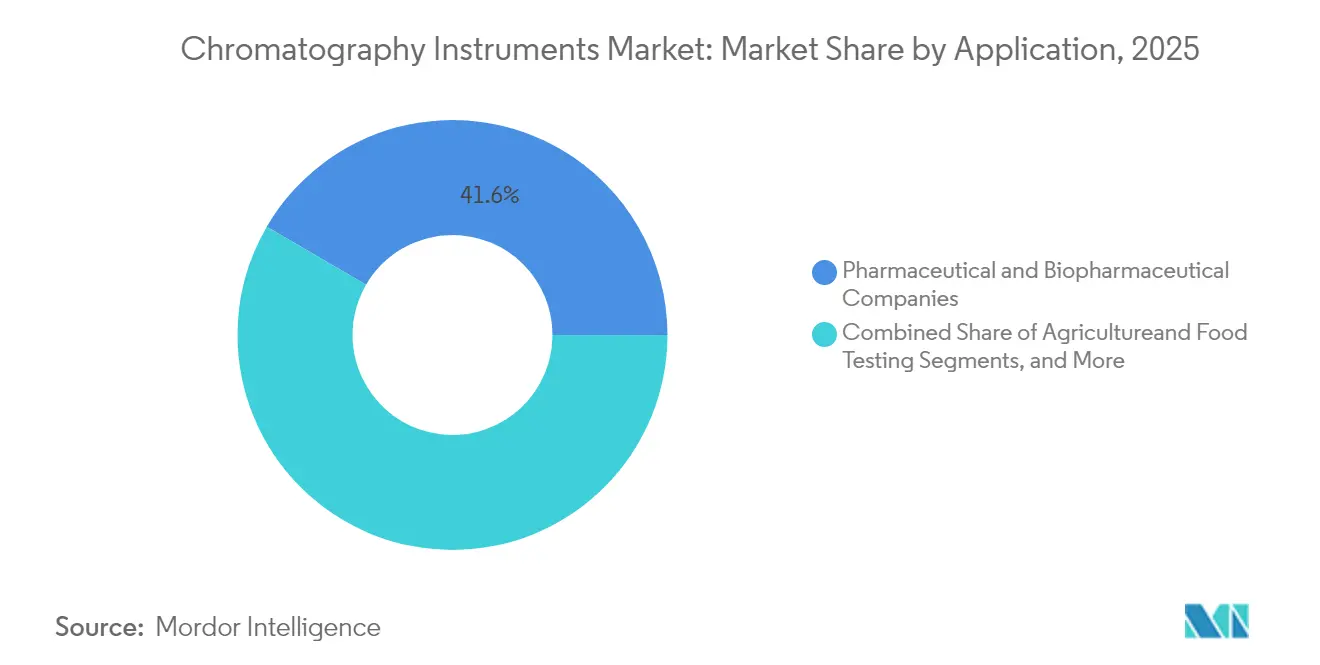
- By application, pharmaceutical and biopharmaceutical laboratories held a 41.60% share of the chromatography instrumentation market size in 2025, whereas environmental testing is set to grow at a 8.95% CAGR to 2031.
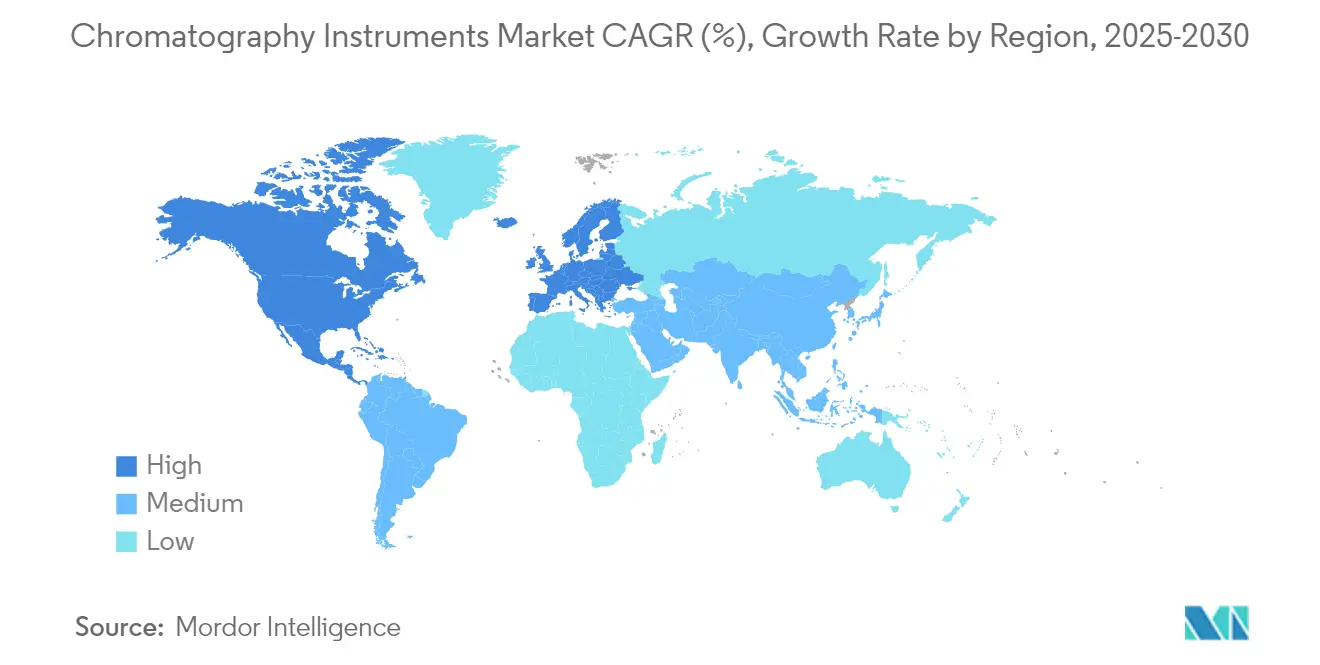
- By geography, North America commanded 38.30% revenue in 2025, while Asia-Pacific is poised for the fastest 7.45% CAGR through 2031.
Note: Market size and forecast figures in this report are generated using Mordor Intelligence’s proprietary estimation framework, updated with the latest available data and insights as of 2026.
Global Chromatography Instrumentation Market Trends and Insights
Drivers Impact Analysis*
| Driver | (~) % Impact on CAGR Forecast | Geographic Relevance | Impact Timeline |
|---|---|---|---|
| Chromatography integral to accelerating biologics & small-molecule drug approvals | +1.20% | Global – strongest in North America & EU | Medium term (2-4 years) |
| Rapid technology advances: miniaturized & UHPLC/UPGC platforms | +0.90% | Global – led by developed markets | Short term (≤ 2 years) |
| Stringent global food-safety and PFAS regulations upping testing volumes | +0.80% | North America & EU primary, expanding to APAC | Long term (≥ 4 years) |
| Expanding bioprocessing & continuous manufacturing in biopharma | +0.70% | Global – APAC fastest | Medium term (2-4 years) |
| Helium shortage spurring alternative-carrier-gas GC upgrades | +0.40% | Global – most acute in legacy labs | Short term (≤ 2 years) |
| AI-powered workflow automation slashing analytical turnaround time | +0.60% | Developed markets first, then global | Medium term (2-4 years) |
| Source: Mordor Intelligence | |||
Chromatography Integral to Accelerating Biologics & Small-Molecule Drug Approvals
Updated Q2(R2) and Q14 guidance from the US FDA now requires stronger evidence of method robustness, prompting widespread upgrades to ultra-high-performance LC-MS platforms. Waters’ Empower software already supports roughly 80% of new drug dossiers worldwide, reflecting the technique’s central role in quality-by-design programs. Demand is especially strong for biocompatible columns that eliminate metal contamination of antibody therapeutics. Continuous manufacturing lines rely on in-line chromatographic monitoring to keep critical process parameters within specification, reinforcing instrumentation sales to contract development and manufacturing organizations.
Rapid Technology Advances: Miniaturized & UHPLC/UPGC Platforms
Latest-generation systems deliver pressures beyond 1,300 bar while embedding self-diagnostic sensors that trigger automated maintenance routines. AI engines now tune gradient profiles in real time, improving peak capacity without operator intervention and reducing solvent use by up to 65%. Microfluidic sample preparation modules minimize reagent consumption and accelerate throughput, allowing smaller labs to handle complex matrices. Instrument footprints continue to shrink, enabling multiplexed installations even in space-constrained facilities. These gains directly address the global shortage of trained chromatographers by reducing manual workload.
Stringent Global Food-Safety and PFAS Regulations Upping Testing Volumes
The US EPA’s Method 1633 establishes sub-ng/mL limits for dozens of PFAS compounds, expanding LC-MS/MS demand in environmental and food laboratories.[2]US Environmental Protection Agency, “Draft Method 1633: Analysis of PFAS in Aqueous, Solid, Biosolids, and Tissue Samples,” epa.gov Europe’s REACH program adds similar obligations, and several APAC nations are drafting aligned rules. Vendors have introduced delay columns and dedicated stationary phases that suppress analyte degradation, increasing method sensitivity threefold. The estimated USD 220 billion cost to remediate US contamination alone underscores enduring testing volume, firmly linking regulatory action to sustained revenue for the chromatography instrumentation market.
Expanding Bioprocessing & Continuous Manufacturing in Biopharma
Asia Pacific biomanufacturers are shifting from batch to continuous downstream purification, depending on multi-column chromatography skids that deliver higher yields at lower buffer consumption. Cytiva and Pall plan USD 600 million in new resin capacity, ensuring supply of agarose beads essential for intensified processes. Inline protein-A monitoring shortens release cycles, encouraging broader installation of PAT-ready systems. Integrated software feeds analytics directly to manufacturing execution systems, tightening control loops and reducing deviation rates.
Restraints Impact Analysis*
| Restraint | (~) % Impact on CAGR Forecast | Geographic Relevance | Impact Timeline |
|---|---|---|---|
| High upfront and maintenance cost of advanced LC & MS-coupled systems | -0.80% | Global – most limiting in emerging markets | Long term (≥ 4 years) |
| Shortage of skilled chromatographers & data analysts | -0.60% | Developed markets first, now global | Medium term (2-4 years) |
| Volatility in supply of high-purity resins, columns & semiconductor chips | -0.50% | Worldwide | Short term (≤ 2 years) |
| Emerging green-solvent mandates raising compliance and redesign costs | -0.30% | EU & North America lead | Long term (≥ 4 years) |
| Source: Mordor Intelligence | |||
High Upfront and Maintenance Cost of Advanced LC & MS-Coupled Systems
Next-generation LC-MS instruments often exceed USD 500,000, with service contracts adding another 12% annually, straining budgets in academia and diagnostic labs. Semiconductor tariffs risk pushing component costs higher, potentially delaying upgrades. Certified pre-owned programs from OEMs and resellers offer entry points as low as USD 14,000, yet limited warranty scope can raise lifecycle risk. Total analytical cost per complex bioanalytical sample frequently surpasses USD 100, forcing some facilities to outsource testing rather than invest internally.
Shortage of Skilled Chromatographers & Data Analysts
Retirement of experienced analysts and competition from adjacent industries have left many laboratories understaffed. Multifunctional instruments now integrate guided workflows and remote diagnostics to support novice users. While these tools ease routine tasks, advanced method development still demands expertise. Training programs lag behind market growth, prolonging vacancies and limiting throughput capacity.
*Our forecasts treat driver/restraint impacts as directional, not additive. The impact forecasts reflect baseline growth, mix effects, and variable interactions.
Segment Analysis
By Devices: High-Performance Liquid Systems Sustain Leadership
Liquid chromatography systems captured 56.20% of 2025 revenue, reflecting broad applicability in pharma, environmental, and clinical arenas. The chromatography instrumentation market size for liquid platforms reached USD 5.69 billion in 2025 and is projected to advance at a 4.85% CAGR, buoyed by biocompatible hardware that minimizes metal adsorption of sensitive biomolecules. Supercritical fluid instruments, though smaller in absolute terms, will record the fastest 8.45% CAGR, riding pharmaceutical demand for greener chiral separations. Gas chromatography manufacturers are redesigning systems for hydrogen carriers to mitigate helium reliance, and ion chromatography gains relevance in drinking-water compliance. Consumables, especially columns engineered for PFAS and antibody analysis, drive recurring revenue and buffer suppliers from capital-spending cycles. Localization of agarose resin production in the US and Europe shields users from trans-Pacific logistics risk, improving lead times and pricing stability.
Technological differentiation now centers on embedded analytics. Instruments log every parameter change, creating traceable digital twins that feed laboratory information systems. Vendors integrate column health dashboards that predict failure, thereby protecting data integrity and reducing reruns. Compact autosamplers and solvent-saving gradient pumps align with green-chemistry mandates while preserving chromatographic resolution. These trends ensure sustained leadership for liquid systems, underpinning the overall trajectory of the chromatography instrumentation market.


By Application: Environmental Testing Outpaces Traditional Domains
Pharmaceutical laboratories retained the largest 41.60% revenue slice in 2025, yet mounting PFAS and food-safety rules position environmental testing as the fastest-expanding application at 8.95% CAGR. Routine drug-release testing now requires sub-ppm impurity quantitation, driving multi-detector LC-MS configurations in pharma quality control suites. Clinical diagnostics adopt liquid chromatography-tandem mass spectrometry for vitamin-D, steroid, and toxicology panels, widening the method’s footprint beyond esoteric labs.
Agri-food chains deploy high-throughput GC-MS screens for pesticide residues, while petrochemical operators monitor refinery streams with process GC units capable of real-time composition feedback. Across every segment, machine-learning post-processing reduces manual peak review, allowing labs to redeploy limited staff toward investigation tasks. These cross-industry drivers collectively keep the chromatography instrumentation market on a resilient growth path, even as spending priorities vary by sector.
Geography Analysis
North America maintained 38.30% of global revenue in 2025, anchored by intensive pharmaceutical R&D pipelines and strict FDA oversight that mandate high-end analytical validation. Domestic expansion projects such as Thermo Fisher’s USD 2 billion capacity program improve access to instruments and consumables, supporting replacement cycles and new installations. Federal incentives for semiconductor onshoring also protect instrument component supply, enhancing ecosystem resilience.
Europe follows with a well-established base but faces tighter solvent and waste regulations that drive early adoption of greener technologies. Laboratories pivot toward low-flow UHPLC and hydrogen carrier gas solutions to comply with environmental directives. EU Horizon research funds continue to seed next-generation detection methods, sustaining regional innovation pipelines.
Asia-Pacific represents the principal growth engine, expanding at a 7.45% CAGR to 2031. China and India jointly account for over half of regional demand as contract research organizations, vaccine producers, and generics manufacturers scale operations. Government initiatives to upgrade food-safety testing and curb industrial pollution further stimulate orders. Japanese and South Korean firms remain at the forefront of platform engineering, exporting high-precision components worldwide and reinforcing the global standing of the chromatography instrumentation market.

Competitive Landscape
Four multinationals such as Waters, Agilent, Thermo Fisher Scientific, and Shimadzu—collectively hold significant global revenue, underscoring moderate consolidation within the chromatography instrumentation market. Each leverages unique technology stacks: Waters pioneered UPLC; Agilent emphasizes modular LC platforms; Thermo Fisher integrates chromatography with Orbitrap MS; and Shimadzu champions AI-assisted workflows. Competitive tension now centers on software ecosystems that enhance regulatory compliance and remote service.
Mergers and acquisitions accelerate capability expansion. Thermo Fisher’s USD 4.1 billion purchase of Solventum’s purification and filtration unit broadens bioprocess coverage and underpins chromatography resin supply. Smaller niche acquisitions, such as PEAK Scientific’s purchase of Noblegen gas-generation technology, illustrate how specialized capabilities can earn premium market positioning. Patent filings concentrate on porous particle chemistry and chemometrics algorithms, with top inventors often exceeding 100 active US patents.
Pricing pressure persists despite vendor concentration, driven by leaner manufacturing in Asia-Pacific and the rise of certified-pre-owned equipment programs. Suppliers respond by bundling instruments with cloud subscriptions, securing annuity revenue through analytics dashboards and e-commerce consumable ordering. This balanced strategy maintains profitability while keeping barriers to entry high for new challengers, sustaining leadership positions within the chromatography instrumentation market.
Chromatography Instrumentation Industry Leaders
Agilent Technologies
Thermo Fisher Scientific
Merck KGaA
Sartorius AG
Bio-Rad Laboratories
- *Disclaimer: Major Players sorted in no particular order

Recent Industry Developments
- June 2025: Waters Corporation released BioResolve Protein A columns with MaxPeak Premier coating, delivering up to 7× sensitivity gains.
- June 2025: Bruker introduced the timsMetabo platform for high-throughput PFAS detection.
- March 2025: Cytiva and Pall announced a USD 1.5 billion investment across 13 sites, adding a new US chromatography plant.
- February 2025: Thermo Fisher Scientific acquired Solventum’s Purification & Filtration business for USD 4.1 billion, targeting USD 125 million in year-five synergy gains.
- October 2025: Agilent Technologies launched the Infinity III LC Series, featuring InfinityLab Assist Technology for enhanced automation and sustainability.


Research Methodology Framework and Report Scope
Market Definitions and Key Coverage
Our study treats the chromatography instrumentation market as the annual revenue generated from newly manufactured gas, liquid, ion, thin-layer, and super-critical chromatography systems that contain an integrated separation module, detector, pump, and control software. Values are expressed in constant 2025 US dollars at factory-gate average selling prices, covering laboratory, pilot-scale, and process instruments bought by life-science, environmental, food-testing, and petrochemical end users.
Scope Exclusions: disposables such as columns, solvents, vials, needles, and service contracts are not counted.
Segmentation Overview
- By Devices
- Chromatography Systems
- Gas Chromatography Systems
- Liquid Chromatography Systems
- Supercritical Fluid Chromatography Systems
- Ion Chromatography Systems
- Thin-Layer Chromatography Systems
- Consumables
- Columns
- Solvents / Reagents / Adsorbents
- Syringes / Needles
- Membrane Filters
- Others
- Accessories
- Column Accessories
- Auto-Sampler Accessories
- Pumps
- Detectors
- Other Accessories
- Chromatography Systems
- By Application
- Agriculture & Food Testing
- Pharmaceutical & Biopharmaceutical Companies
- Clinical & Diagnostic Laboratories
- Environmental Testing
- Chemical & Petrochemical
- Forensic & Toxicology
- Geography
- North America
- United States
- Canada
- Mexico
- Europe
- Germany
- United Kingdom
- France
- Italy
- Spain
- Rest of Europe
- Asia Pacific
- China
- Japan
- India
- South Korea
- Australia
- Rest of Asia Pacific
- Middle East and Africa
- GCC
- South Africa
- Rest of Middle East and Africa
- South America
- Brazil
- Argentina
- Rest of South America
- North America
Detailed Research Methodology and Data Validation
Primary Research
Interviews with instrument product managers, QC directors in multinational pharma plants, regional distributors, and academic lab heads across North America, Europe, Asia-Pacific, and Latin America help us test secondary findings, refine installed-base estimates, and benchmark replacement intervals. Structured e-mail surveys capture average throughput shifts after regulatory updates.
Desk Research
Mordor analysts first compile supply-side clues from open sources such as the US FDA 510(k) database, Eurostat PRODCOM output files, UN Comtrade HS-8419 shipment records, WHO food-safety alerts, and scientific literature indexed in PubMed. Company 10-Ks, investor decks, and major trade association briefs (e.g., AoAC, AAPS) enrich pricing and demand context. Paid tools, D&B Hoovers for firm financials, Questel for patent velocity, and Dow Jones Factiva for deal tracking, add further depth. This list is illustrative; dozens of additional outlets are checked to close data gaps.
Market-Sizing & Forecasting
A top-down model starts with global production and trade data, which are then reconciled with estimated installed bases and five-year replacement cycles to frame demand. Select bottom-up spot checks, sampled ASP × regional shipment volumes, validate totals before minor alignment. Key variables monitored include pharmaceutical R&D outlays, number of batch-release chromatographic assays, environmental compliance test counts, average detector price erosion, and laboratory capital budgets. Multivariate regression, complemented by scenario analysis for regulatory shocks, projects each driver. The aggregate series is forecast with ARIMA for 2026-2030. Where channel data lack detail, we apply conservative error bands agreed in expert calls.
Data Validation & Update Cycle
Outputs undergo two-step peer review, variance tests against independent benchmarks, and anomaly flags. Reports refresh every twelve months; mid-cycle updates are triggered when currency swings above 7% or a top-three vendor issues material guidance.
Why Our Chromatography Instrumentation Baseline Commands Reliability
Published figures often diverge because publishers choose different device mixes, bundle consumables, or freeze exchange rates at dissimilar points.
Mordor Intelligence filters out non-instrument revenues, applies live FX, and rebuilds 2025 demand from corroborated production, trade, and usage ratios, which keeps our baseline steady yet responsive.
Benchmark comparison
| Market Size | Anonymized source | Primary gap driver |
|---|---|---|
| USD 10.13 B (2025) | Mordor Intelligence | - |
| USD 11.01 B (2025) | Regional Consultancy A | Includes columns and reagents; surveys limited to North America |
| USD 10.31 B (2025) | Global Consultancy B | Counts software plus instruments; geographies updated biennially |
| USD 11.60 B (2025) | Industry Journal C | Relies on list prices, no primary interviews, top-down only |
Taken together, the comparison shows that scope creep, infrequent refreshes, and unverified assumptions inflate other tallies, whereas our disciplined variable selection and continuous validation give decision-makers a transparent, reproducible market view.


Key Questions Answered in the Report
What is the current size of the chromatography instrumentation market?
The chromatography instrumentation market stands at USD 10.63 billion in 2026 and is set to reach USD 13.52 billion by 2031.
Which device type captures the highest market share?
Liquid chromatography platforms lead with 56.20% of global revenue thanks to their versatility across pharmaceutical, environmental, and clinical workflows.
Which application area will grow the fastest through 2031?
Environmental testing is projected to expand at a 8.95% CAGR through 2031 due to stringent PFAS and food-safety regulations.
Who are the top players in this market?
Waters, Agilent, Thermo Fisher Scientific, and Shimadzu together control more than 80% of worldwide revenues.
Why is AI important in modern chromatography?
AI-enabled workflows can cut analytical turnaround by up to 40%, enhance data reliability, and ease skilled-labour shortages through predictive maintenance and automated method optimisation.
What regions offer the strongest growth outlook?
Asia-Pacific is forecast to grow at 7.45% CAGR, driven by expanding biomanufacturing capacity, rising healthcare investment, and tighter regulatory compliance standards.
Page last updated on:


