
Market Overview
| Study Period | 2021 - 2031 |
|---|---|
| Forecast Data Period | 2026 - 2031 |
| Base Year Market Size (2025) | 10.25 gigawatt |
| Market Volume (2026) | 12.41 gigawatt |
| Market Volume (2031) | 32.27 gigawatt |
| Growth Rate (2026 - 2031) | 21.06 % |
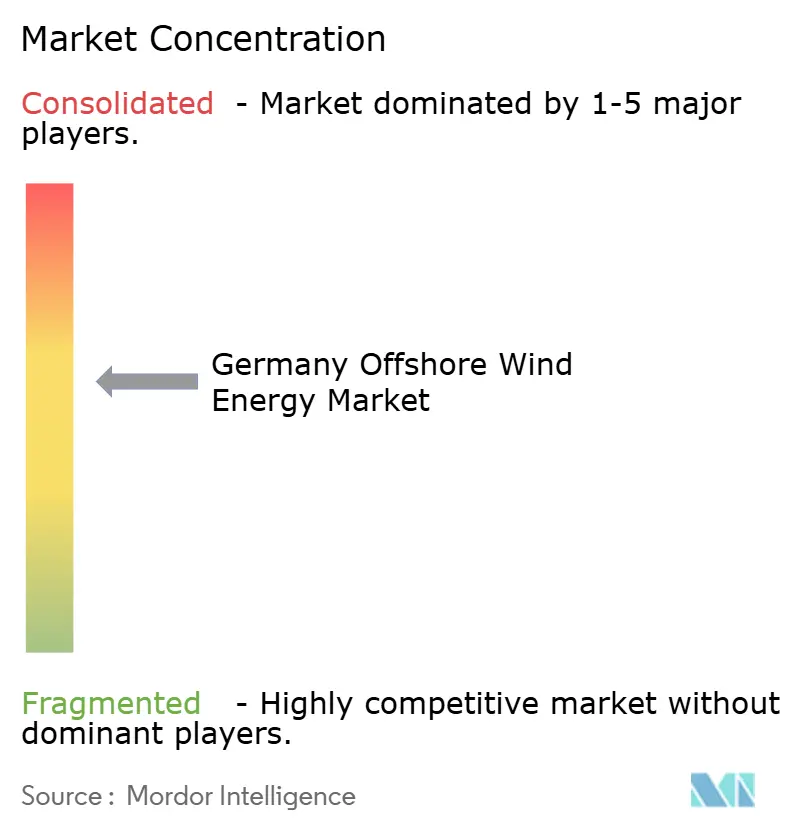
| Market Concentration | Medium |
Major Players *Disclaimer: Major Players sorted in no particular order Image © Mordor Intelligence. Reuse requires attribution under CC BY 4.0. | |
Germany Offshore Wind Energy Market Analysis by Mordor Intelligence
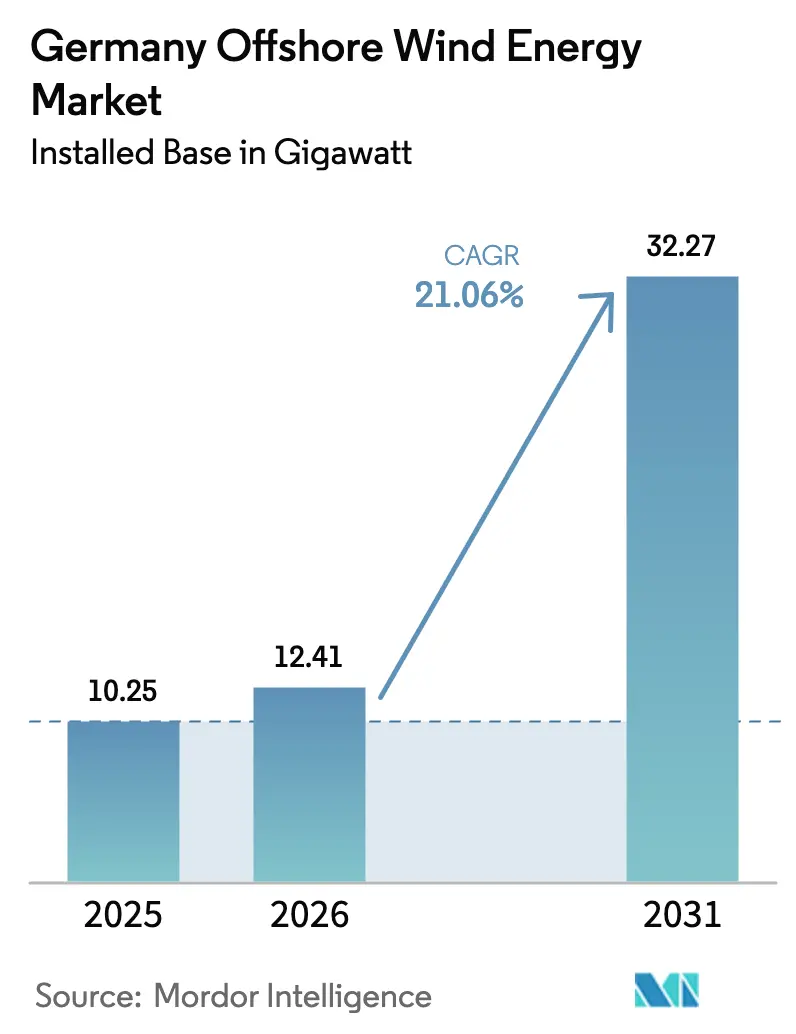
Germany Offshore Wind Energy Market size in 2026 is estimated at 12.41 gigawatt, growing from 2025 value of 10.25 gigawatt with 2031 projections showing 32.27 gigawatt, growing at 21.06% CAGR over 2026-2031.
Capacity growth aligns with the national target of 30 GW by 2030, rising corporate power-purchase agreements, and a steady fall in levelized cost as 14 MW-plus turbines become mainstream. Deeper collaboration between federal and state agencies accelerates permits, while pilot projects that link offshore wind with electrolyzers signal a shift toward integrated energy systems. Supply-chain limits around heavy-lift vessels still cap build-out speed, yet digital-twin maintenance tools are lowering unplanned downtime and lifting project returns. Taken together, these drivers position the German offshore wind energy market for sustained double-digit expansion through the decade.
Key Report Takeaways
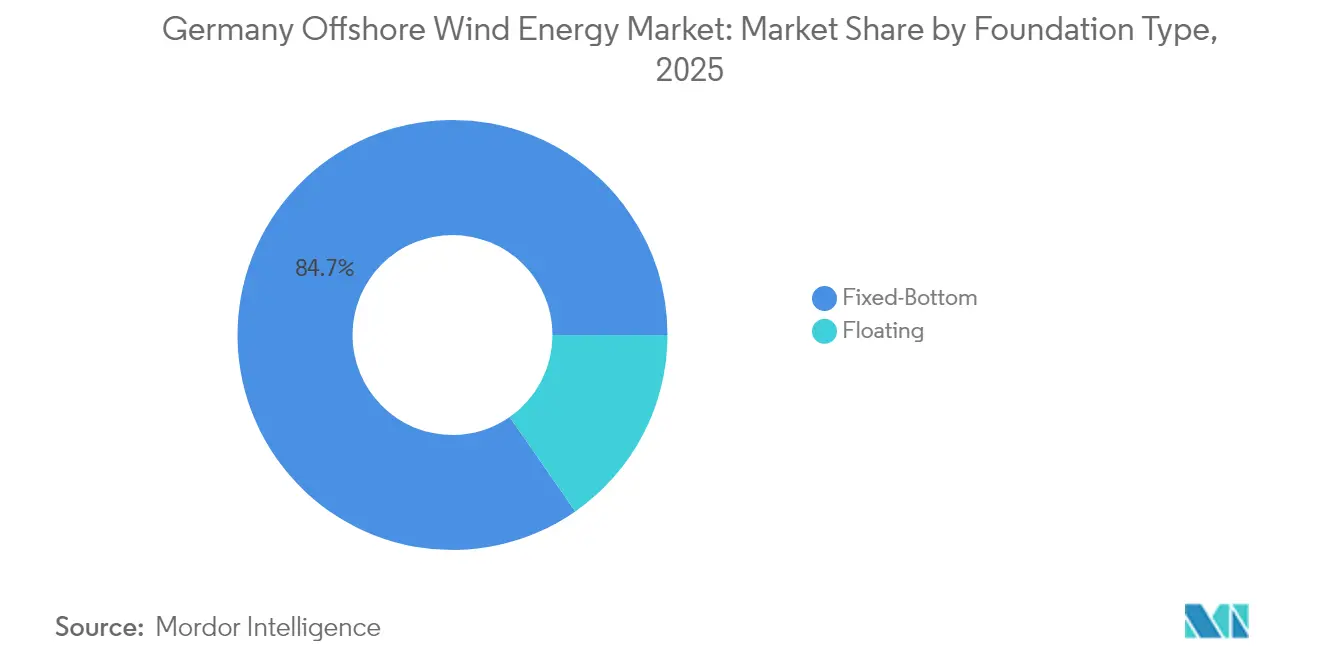
- By foundation type, fixed-bottom structures captured 84.68% of the German offshore wind energy market share in 2025, while floating foundations are forecast to expand at a 25.41% CAGR through 2031.
- By turbine capacity, units with a capacity above 6 MW held 74.12% of the German offshore wind energy market size in 2025 and are projected to grow at a 22.15% CAGR between 2026 and 2031.
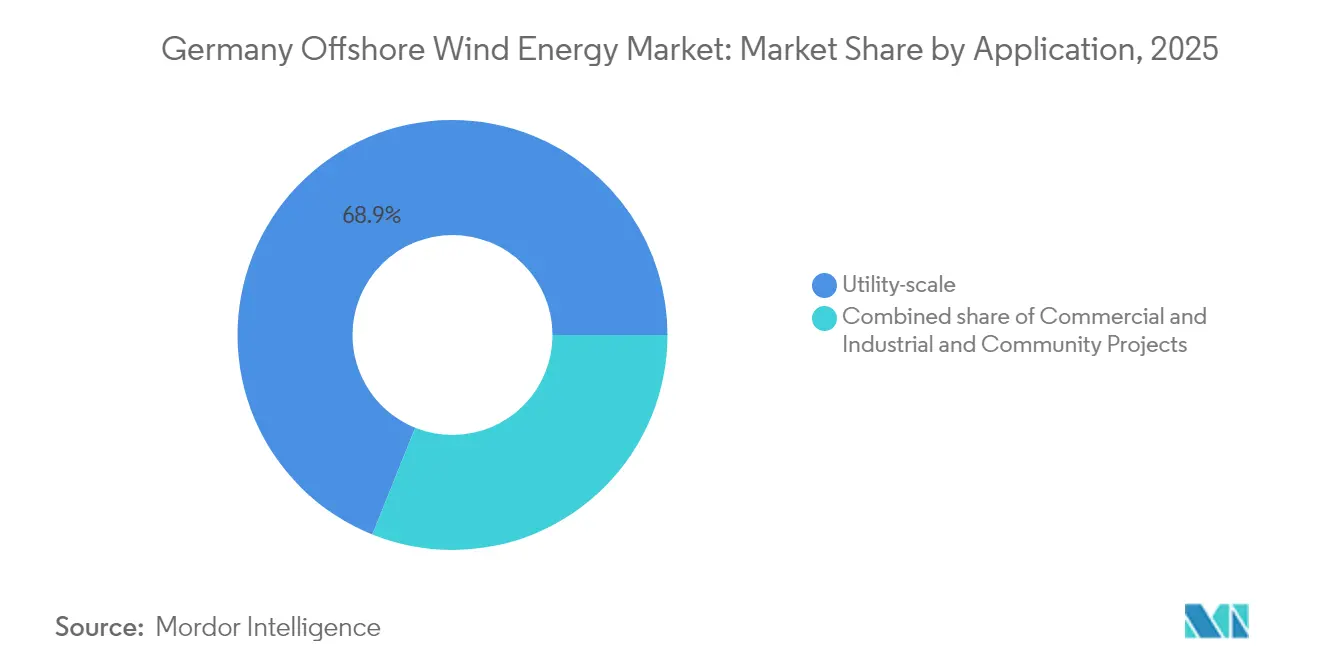
- By application, utility-scale projects accounted for 68.92% of the German offshore wind energy market size in 2025, whereas community projects are advancing at a 28.31% CAGR to 2031.
Note: Market size and forecast figures in this report are generated using Mordor Intelligence’s proprietary estimation framework, updated with the latest available data and insights as of 2026.
Germany Offshore Wind Energy Market Trends and Insights
Drivers Impact Analysis*
| Driver | (~) % Impact on CAGR Forecast | Geographic Relevance | Impact Timeline |
|---|---|---|---|
| Accelerated 40 GW-by-2034 target | +4.2% | National, North Sea and Baltic expansion zones | Medium term (2–4 years) |
| Falling LCOE from 14–15 MW turbines | +3.8% | National, early adoption in shallow-water North Sea sites | Short term (≤ 2 years) |
| Corporate PPA boom | +4.1% | National, heavy-industry clusters across western and southern states | Short term (≤ 2 years) |
| Offshore wind-to-hydrogen pilot tenders | +2.9% | North Sea pilot zones near Heligoland | Long term (≥ 4 years) |
| Federal-state Area Development Plan timetable | +3.5% | National, coordinated seabed scheduling | Medium term (2–4 years) |
| Digital-twin O&M platforms | +2.3% | National, all operating and planned assets | Medium term (2–4 years) |
| Source: Mordor Intelligence | |||
Accelerated 30 GW-by-2030 National Target
The federal goal, doubled from its earlier pledge, obliges yearly additions near 3.1 GW, far above the sub-300 MW pace logged in 2023. The Federal Maritime and Hydrographic Agency has zoned precise build areas that let developers plan equipment orders and capital spending with more certainty.(1) Faster permits and auction clarity are driving a queue of multi-gigawatt projects that will keep the German offshore wind energy market on its steep growth track. Companies are lobbying for quicker grid links so new capacity can feed demand centers in the south. Meeting the target cements Germany as Europe’s second-largest offshore arena, below only the United Kingdom.
Falling Levelized Cost from >14 MW Turbines
Rapid adoption of 14-15 MW turbines lifts output per foundation and trims array-cable runs. Siemens Gamesa’s SG 14-222 DD delivers 25% more annual energy than its 11 MW predecessor.(2) Fraunhofer ISE pegs 2024 LCOE at 5.5-10.3 €c/kWh, putting offshore wind on par with gas-fired power in Germany. Developers favor bigger rotors because fewer units cut crane days and vessel charters, two of the priciest items in a build budget. The trend protects margins as zero-subsidy bids become common in the German offshore wind energy market.
Federal-State North Sea–Baltic “Area Development Plan 2023” Build-out Timetable
The plan coordinates seabed leasing, environmental checks, and grid-connection studies under one schedule, replacing past patchwork rules. Uniform data sets on wind speeds and seabed conditions save developers costly surveys. Pipeline visibility also gives tier-two suppliers confidence to scale factory output. Resulting efficiencies are expected to lift the German offshore wind energy market by unlocking stranded projects and shortening lead times for new zones.
Corporate PPA Boom Among German Heavy Industry
BASF, Covestro, and Amazon have signed decade-long PPAs that let projects secure debt on merchant terms. These contracts hedge power price risk for energy-intensive firms while furnishing fixed revenue for wind-farm owners. The maturing PPA market is cutting reliance on state subsidies, sparking a self-reinforcing cycle of demand and new builds in the German offshore wind energy market.
Restraints Impact Analysis*
| Restraint | (~) % Impact on CAGR Forecast | Geographic Relevance | Impact Timeline |
|---|---|---|---|
| Grid-connection queue and onshore bottlenecks | -3.7% | Schleswig-Holstein and Lower Saxony | Short term (≤ 2 years) |
| Lengthy maritime environmental permitting | -2.1% | Baltic Sea protected areas | Medium term (2–4 years) |
| Heavy-lift vessel and monopile scarcity | -2.8% | North Sea and Baltic supply chain | Medium term (2–4 years) |
| High interest-rate environment | -3.4% | National, all project-finance structures | Short term (≤ 2 years) |
| Source: Mordor Intelligence | |||
Grid-Connection Queue & Onshore Transmission Bottlenecks
TenneT curtailed 9% of North Sea output in 2024 due to cable congestion. The federal regulator forecasts that 500,000 km of new lines plus transformers will be needed by 2045. Delays inflate financing costs and dent capacity factors, holding back the German offshore wind energy market during a critical scale-up phase.
Heavy-Lift Vessel & Monopile Forging Scarcity
Only a handful of European yards forge XXL monopiles, and heavy-lift vessels that can raise 3,000-ton jackets are nearly booked out until late-2027.(3) Competition for scarce assets risks slippage in project timetables and higher EPC prices, raising entry hurdles for smaller developers in the German offshore wind energy market.
*Our forecasts treat driver/restraint impacts as directional, not additive. The impact forecasts reflect baseline growth, mix effects, and variable interactions.
Segment Analysis
By Foundation Type: Floating Technology Gains Despite Fixed-Bottom Dominance
Fixed-bottom structures represented 84.68% of the German offshore wind energy market in 2025, driven by shallow-water zones near Borkum and Sylt, where monopile costs average EUR 1.9–2.1 million per MW. RWE’s 300-monopile reservation with Steelwind secures capacity through 2027 but signals scarcity, as European mills run at 85% utilization. Supply tightness and steel price inflation could accelerate the adoption of floating if fabrication lead times extend beyond two years.
Floating foundations held 15.32% in 2025 and are forecast to grow at a 25.41% CAGR through 2031, supported by Baltic sites beyond the 50-meter isobath and the North Sea west of Heligoland. Although the capital cost remains EUR 2.8–3.4 million per MW, floating technology eliminates costly seabed dredging and expands the developable seabed by 40% in German waters. Upcoming Arkona Basin tenders include three floating-specific zones totaling 1.2 GW, expected to connect through BalWin 5 after 2030. As turbine ratings climb, floating platforms’ higher nameplate capacities could offset upfront cost premiums, sustaining momentum in the German offshore wind energy market.

By Turbine Capacity: Above-6 MW Platforms Consolidate
Above-6 MW turbines captured 74.12% of Germany's offshore wind energy market size in 2025 and will accelerate at a 22.15% CAGR through 2031. Projects such as Vattenfall's Nordlicht clusters utilize 107 Vestas 15 MW units, each delivering 80 GWh annually, and achieve a 56% capacity factor in North Sea conditions. Direct-drive technology reduces maintenance outlays to EUR 18 per MWh, compared with EUR 26 per MWh for geared 6–8 MW turbines.
The 3–6 MW segment fell to 18.42% in 2025, and no new sub-3 MW orders have been announced since 2019, effectively rendering that class obsolete. Factory capacity at Cuxhaven and Nakskov reaches 2.7 GW per year, but rising demand could potentially exhaust the supply by 2027, underscoring the need for further investment. IEC 61400-3-1 standard revisions now accommodate rotors up to 250 meters, which supports next-generation 18 MW designs and keeps the German offshore wind energy market on its technology-upgrade path.
By Application: Community Ownership Surges
Utility-scale ventures accounted for 68.92% of installed capacity in 2025, led by Ørsted’s Borkum Riffgrund 3 (913 MW) and EnBW’s He Dreiht (960 MW). Economies of scale keep all-in CAPEX at EUR 2.9–3.2 million per MW, but grid-fee inflation is narrowing margins. Integrated utilities continue to win the largest leases, yet community ownership models are proliferating under revised federal rules that award tender premiums for local equity.
Community projects held 22.20% in 2025 and are forecast to grow at a 28.31% CAGR, buoyed by Trianel’s 400 MW Borkum cooperative and BayWa r.e.’s Schönberg farm, which reserved 25% equity for residents. Retail capital lowers project WACC by 40 basis points and enhances social acceptance, a critical factor in permitting. Commercial and industrial direct-wire setups, at 8.88% in 2025, utilize dedicated turbine clusters within utility projects, allowing off-takers to secure long-term green power. Together, these models diversify revenue streams and deepen resilience in the German offshore wind energy industry.
Geography Analysis
The North Sea remains the powerhouse of the German offshore wind energy market, supplying nearly three-quarters of installed capacity and benefiting from favorable wind speeds that push capacity factors above 50%. Recent completion of Borkum Riffgrund 3 and the start of He Dreiht construction illustrate how established port logistics, deeper water sites for larger turbines, and existing TenneT hubs reduce execution risk.
Baltic Sea prospects, although smaller in absolute terms, are scaling rapidly. The German offshore wind energy market size tied to Baltic projects is forecast to triple between 2025 and 2031 as Baltic Eagle and Arcadis Ost 1 unlock follow-up zones nearer to Hamburg’s industrial belt. Environmental assessments show lower marine-mammal sensitivity, which shortens permit reviews. The Baltic grid also allows shorter onshore reinforcement, cutting soft-cost overheads.
Inter-connector ambitions add a cross-border twist. Draft proposals envisage cable corridors that tie North Sea clusters with Danish and Dutch grids, while Baltic schemes link directly into Polish and Swedish lines. This emerging mesh will assist curtailment management and stabilize revenues across the German offshore wind energy market under higher renewable penetration scenarios.
Regulatory Landscape
Germanys offshore wind build-out is governed primarily by the Wind Energy at Sea Act (WindSeeG), which sets the rules for site development, auctions, and grid-connection planning. As of October 2025, amendments aligned parts of the framework with EU Renewable Energy Directive requirements and reinforced the public-interest priority for offshore wind and associated grid connectivity, which supports faster planning and permitting pathways.
At the operational level, the Federal Maritime and Hydrographic Agency (BSH) remains the key authority for marine spatial planning, the Area Development Plan timetable, and project approvals in German waters. Project-level decisions continue to shape progress, including BSH planning permission granted to RWE in March 2026 for the Nordseecluster B offshore wind farm, showing how regulatory approvals convert multi-phase cluster pipelines into executable construction schedules.
Competitive Landscape
The market shows a moderate concentration profile anchored by five primary developers, Ørsted, RWE, Vattenfall, EnBW, and E.ON, holding a combined share near 60% of operational assets. Ørsted capitalizes on its serial project track record and early investment in digital-twin analytics that raise availability. RWE leans on domestic brand trust and cross-business hedging to secure PPAs with German heavy manufacturers.
Turbine manufacturing is essentially a two-horse race between Siemens Gamesa and Vestas, each locking in multi-farm framework deals that tilt bidding in favor of aligned developers. Siemens Energy’s 2023 move to take full control of Siemens Gamesa hints at tighter vertical integration that could compress costs on nacelles and service contracts. New entrants, chiefly oil-and-gas majors, must either overbid in capacity auctions or partner with experienced utilities to gain a foothold in the German offshore wind energy market.
Supply-chain bottlenecks remain a pivotal competitive lever. Firms that reserve heavy-lift vessel slots or monopile forging windows enjoy schedule certainty. Developers unable to guarantee logistics face financing penalties. Consequently, market power is drifting toward players capable of locking in end-to-end supply agreements early, reinforcing the consolidation pattern within the German offshore wind energy industry.
Germany Offshore Wind Energy Industry Leaders
-
Ørsted A/S
-
RWE AG
-
Vattenfall AB
-
EnBW Energie Baden-Württemberg AG
-
Siemens Gamesa Renewable Energy S.A.
- *Disclaimer: Major Players sorted in no particular order
Market Opportunities and Future Outlook
Near-term whitespace centers on accelerating build-out against national expansion targets (30 GW by 2030, 40 GW by 2035, and 70 GW by 2045), while reducing grid-connection friction and shortening permitting cycles. A visible opportunity set is industrial offtake and bankability structures: corporate PPAs already signed by companies such as BASF, Covestro, and Amazon provide long-tenor revenue frameworks that complement subsidy-free bidding and support large, multi-phase developments.
Supply-chain depth and cross-border coordination also look actionable. In March 2026, Germany and Norway formed an Offshore Wind Working Group to identify business opportunities, address regulatory barriers, and facilitate supply chain integration, creating a platform for procurement collaboration across foundations, installation capacity, and services. Economic footprint indicators underline scale, with industry added value cited at EUR 14.6 billion in 2025, supporting investment cases for ports, manufacturing, and O&M capabilities tied to the North Sea and Baltic project pipeline.
Recent Industry Developments
- July 2026: Vattenfall announces Nordlicht offshore wind cluster construction begins with first monopile install for Nordlicht I (1.6 GW) in German North Sea. The start expands large-scale deployment in the region and sets up additional projects to advance with PPAs in sight. This aligns with German 2030 targets by accelerating project development and grid integration readiness.
- June 2026: RWE AG reports Nordseecluster A: first turbine installed at 660 MW offshore wind farm in the German North Sea. The milestone supports progress in cluster-level growth and strengthens visibility for multi-GW capacity additions. It also lowers execution risk and improves throughput for subsequent cluster developments.
- April 2026: RWE AG confirms Nordseecluster A: two offshore electrical substations successfully installed. The installations improve grid interconnection readiness and support earlier CPPAs. This strengthens project readiness for timely grid connection and market integration.
Research Methodology Framework and Report Scope
Market Definition and Coverage
For this report, we define the market as offshore wind power development and operation within Germany, measured through grid-connected offshore wind installed capacity and the project pipeline that converts into commissioned gigawatts.
Scope exclusions: We exclude onshore wind, behind-the-meter generation, and broader renewable services that are not tied to Germany offshore wind capacity additions and operations.
Segmentation Overview
- By Foundation Type
- Fixed-Bottom
- Floating
- By Turbine Capacity
- Up to 3 MW
- 3 to 6 MW
- Above 6 MW
- By Application
- Utility-scale
- Commercial and Industrial
- Community Projects
- By Component (Qualitative Analysis)
- Nacelle/Turbine
- Blade
- Tower
- Generator and Gearbox
- Balance-of-System
- Others (Installation, Vessels, O&M)
Data Sources, Market Sizing, and Validation
Desk Research
Desk research was used to build the starting database of Germany offshore wind assets, policy targets, and grid connection context, and then to check if the modeled capacity curve fits public records. We pulled facts from official energy and maritime bodies and cross-checked them across multiple publications so one update does not overly move the final numbers.
Public sources that helped anchor the model included federal energy statistics releases, Federal Maritime and Hydrographic Agency publications, and grid and transmission operator updates. We also used industry association statistics for annual commissioning and installed-base summaries, and we referenced peer-reviewed energy studies to keep capacity factor ranges realistic. Where needed, our analysts reviewed company filings and investor presentations for project timing and ownership clues. If a point was ambiguous, we used paid subscriptions for company financials and intelligence, news and financials, patent databases, and global contracts and tenders to confirm award dates and construction milestones. These desk research sources are illustrative only, and many other documents were reviewed for data collection, validation, and clarification.
Primary Interviews and Surveys
Primary work focused on verifying what gets built and connected in Germany offshore wind, and where projects tend to slip. Public schedules often change after permitting and auction wins, so we asked about realistic timelines, typical project sizing, and commissioning patterns. We covered developers, marine contractors, key equipment suppliers, and grid-related experts, then used their input to correct assumptions and recheck the full project list.
Distribution of primary research fieldwork respondents
| Company type | Respondent position |
|---|---|
| Top tier: 28% | CXOs: 16% |
| Mid tier: 50% | Functional/Unit leaders: 27% |
| Smaller Players: 22% | Managers: 57% |
Market-Sizing & Forecasting
Sizing was built using a top-down and bottom-up combination, where national targets, sea area planning, and grid connection readiness were used to reconstruct the realistic annual offshore capacity build-out, which is then summed into installed GW by year. To keep it grounded, selective bottom-up checks were added through project-by-project rollups for known farms and near-term phases, and totals were adjusted when the two views did not align.
Key inputs in the model included installed offshore capacity already operating, announced and awarded auction capacities, typical turbine ratings and expected wind farm sizes, grid connection and commissioning lead times, and observed annual offshore generation signals that help confirm commissioning completeness. If a project detail was missing, we filled the gap using ranges agreed in interviews (including typical delay bands by development stage) and then rechecked the output so one assumption does not distort the curve.
For forecasting, scenario analysis was applied around commissioning timing and award-to-build conversion, since the pipeline can shift with permitting and grid availability. The chosen scenario is the one that best matched expert consensus and the historical cadence of German offshore connections, while still tracking the stated medium-term capacity goals.
Data Validation & Update Cycle
Validation was done through stepwise checks that compare the modeled installed capacity path against independent signals like official installed base snapshots, yearly commissioning announcements, and grid connection progress notes. When an outlier appeared, we traced it back to the project list, auction timing, or assumed build duration, and we re-contacted sources if the variance was material.
Before sign-off, the model goes through a multi-analyst review so calculation logic, unit consistency, and year-to-year jumps are challenged and corrected. Reports are refreshed annually, with interim updates triggered when large auctions, policy changes, or major grid decisions occur. Right before delivery, an analyst runs a fresh pass on key inputs so clients receive the latest updated view.
Mordor Intelligence's Germany Offshore Wind Energy Market Size Compared With Other Published Estimates
Published estimates for Germany offshore wind do not always match, mainly because some sources talk in gigawatts while others translate activity into USD using their own pricing and timing assumptions. Differences also show up when one number reflects installed assets only, but another blends in planned or awarded capacity from the pipeline.
The table shows a spread that is mostly driven by unit conversion and year alignment, and under Mordor Intelligence's scope the sizing is anchored on installed offshore capacity (GW) and the commissioning schedule, rather than treating turbine, foundation, and installation spend as the market value in USD.
Benchmark comparison
| Source | Market Size | Gaps in Research Methodology |
|---|---|---|
| Mordor Intelligence | USD 12.41 B (2026) | |
| Industry Association A | USD 9.20 B (2024) | Uses an end-of-year installed base snapshot for 2024, which is not the same timing as a forecast-year point and does not reflect later pipeline conversion into operating capacity. |
| Energy Research Group B | USD 30.00 B (2030) | Anchors the total to a target-style 2030 capacity level and may treat planned grid connections or awarded capacity as realized, which can pull installed capacity forward. |
Looking across the three values, most of the spread can be explained by whether the publisher reports installed capacity versus a target-like figure, and whether the year selected is a snapshot or a forward point. By tying the model to public commissioning signals and then pressure-testing timing assumptions through interviews, we keep the final number traceable to repeatable inputs.
Key Questions Answered in the Report
How large is Germany’s offshore wind capacity today?
Installed capacity reached 12.41 GW in 2026 and is on track for 32.27 GW by 2031.
What is the expected growth rate through 2031?
Capacity is projected to expand at a 21.06% CAGR between 2026 and 2031.
Which foundation technology is gaining ground?
Floating foundations are forecast to grow at a 25.41% CAGR as deeper Baltic sites come to auction.
Why are corporate PPAs important?
Industrial PPAs lock in sub-EUR 0.08 per kWh pricing, reduce financing spreads by about 120 basis points, and secure up to 4.2 GW of capacity.
What challenges could slow the build-out?
Grid-connection queues, onshore transmission delays, and high interest rates collectively shave up to 3.7 percentage points off forecast CAGR.
Who are the leading developers?
Ørsted, RWE, Vattenfall, and EnBW collectively hold about 70% of operating capacity but face growing competition from Shell, BP, TotalEnergies, and Equinor.