
Geogrids Market Size and Share
Market Overview
| Study Period | 2020 - 2031 |
|---|---|
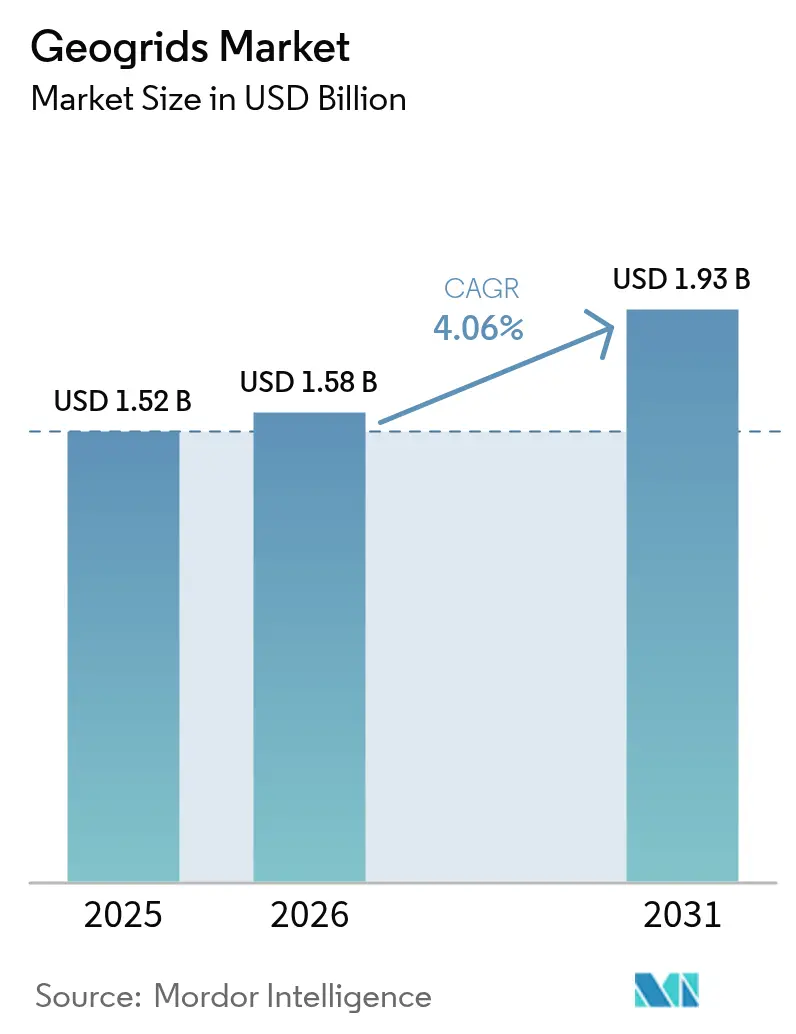
| Market Size (2026) | USD 1.58 Billion |
| Market Size (2031) | USD 1.93 Billion |
| Growth Rate (2026 - 2031) | 4.06 % |
| Fastest Growing Market | Asia Pacific |
| Largest Market | North America |
| Market Concentration | Medium |
Major Players *Disclaimer: Major Players sorted in no particular order Image © Mordor Intelligence. Reuse requires attribution under CC BY 4.0. | |
Geogrids Market Analysis by Mordor Intelligence
The Geogrids Market size was valued at USD 1.52 billion in 2025 and estimated to grow from USD 1.58 billion in 2026 to reach USD 1.93 billion by 2031, at a CAGR of 4.06% during the forecast period (2026-2031). Increasing adoption of performance-based pavement design, alignment of public spending with whole-life cost principles, and carbon-reduction mandates are cementing demand for geogrids across infrastructure programs. Agencies now emphasize extending pavement life rather than replacing entire road sections, which raises the value of engineered soil reinforcement solutions that deliver verifiable lifecycle savings. Demand also benefits from stricter disclosure rules on embodied emissions that favor lightweight geosynthetics over thicker unreinforced aggregate layers. Meanwhile, digital twin modeling is improving specification accuracy and shortening approval cycles, fostering a more data-driven purchasing culture. Together, these forces are moving the geogrids market beyond early adoption and into a period of steady, efficiency-oriented growth.
Key Report Takeaways
- By material, polypropylene led with 43.78% of the geogrids market share in 2025, while polyester registered the fastest expansion at a 5.32% CAGR through 2031.
- By structural types, biaxial products accounted for 45.21% of 2025 revenues; triaxial designs are forecast to grow at a 5.05% CAGR, the swiftest among structural types.
- By manufacturing method, extrusion remained the dominant manufacturing method with 40.79% share in 2025, whereas knitted/woven output is projected to post a 4.67% CAGR to 2031.
- By application, road construction absorbed 51.63% of the 2025 demand; other applications are projected to expand at a 4.94% CAGR, the highest among all applications.
- By geography, North America held 39.01% of 2025 revenues, yet Asia-Pacific is poised for the fastest regional growth at a 4.74% CAGR through 2031.
Note: Market size and forecast figures in this report are generated using Mordor Intelligence’s proprietary estimation framework, updated with the latest available data and insights as of 2026.
Market Trends and Insights
Drivers Impact Analysis of Geogrids Market*
| Drivers | (~) % Impact on CAGR Forecast | Geographic Relevance | Impact Timeline |
|---|---|---|---|
| Pavement life-cycle extension targets | +1.2% | North America and Europe | Medium term (2-4 years) |
| Carbon-reduction mandates | +0.8% | EU and North America | Long term (≥ 4 years) |
| Expressway build-out in developing markets | +1.1% | Asia-Pacific; spill-over to MEA and Latin America | Medium term (2-4 years) |
| Mining haul-road reinforcement | +0.6% | Resource-rich regions worldwide | Short term (≤ 2 years) |
| Digital twin-based design optimisation | +0.4% | North America and Europe; emerging in Asia-Pacific | Long term (≥ 4 years) |
| Source: Mordor Intelligence | |||
Surge in Pavement Life-Cycle Extension Targets
Transport agencies are shifting from thickness-based empirical design toward mechanistic-empirical approaches that quantify the incremental benefit of geogrid inclusion over a 40- to 100-year life. Layer Coefficient Ratio calculations prove that thinner reinforced pavements can deliver identical fatigue performance, directly supporting budget-constrained jurisdictions[1]. United States state departments have begun embedding geogrids in standard specifications for weak-subgrade corridors, a practice mirrored in several EU member states. This behavioural change elevates lifecycle cost over first cost, heightening interest in products with robust field performance data. The resulting demand uptick is most visible in rehabilitation contracts, where agencies seek rapid construction and minimal lane closure times. Consequently, the geogrids market registers increased pull-through from pavement preservation budgets and stimulus allocations earmarked for deferred maintenance.
Carbon-Reduction Mandates Favouring Lightweight Geo-Solutions
Several jurisdictions now score bids partly on total embodied carbon, prompting contractors to quantify emissions from aggregate haulage and asphalt production. Independent studies show geogrid-reinforced base layers can shrink material haulage volumes by 28 to 45%, translating into 58 to 85 tCO₂e/km savings on two-lane highways. With material production accounting for more than 95% of road-building emissions, this benefit carries decisive weight. Early movers in France and the Nordics have created procurement templates that treat carbon reduction as a non-price criterion, a model now spreading to US state DOTs. Suppliers able to substantiate carbon savings with third-party verified data gain preferred status on low-carbon pilot programs. Over the long term, lifecycle inventory disclosure is expected to become mandatory on publicly funded transportation projects, embedding geogrids deeper into mainstream design.
Rapid Expansion of Expressway Networks in Developing Economies
China, India, and Indonesia are commissioning multilane corridors across variable subgrade profiles, often crossing soft clays, expansive soils, or frost-susceptible ground. On the Harbin–Yichun high-speed corridor, triaxial geogrids stabilise sub-freezing soils while minimising excavation volumes. India’s Bharatmala initiative specifies geogrid reinforcement on black cotton soil stretches to mitigate differential settlement and cracking. Latin American public-private partnerships similarly rely on geogrids to control rutting in heavy truck lanes traversing tropical soils. Collectively, these projects add more than 12,000 km of reinforced pavement annually, underpinning above-average demand growth for the geogrids market in developing regions.
Mining Haul-Road Reinforcement Demand
Open-pit mines face escalating tyre and suspension costs as equipment payloads surpass 360 tons. Case studies show that triaxial grids can cut dozer-maintenance hours by 52% while extending haul-road resurfacing intervals from three weeks to six months. Furthermore, geogrids enable the use of locally sourced inferior aggregates, trimming imported crushed-rock procurement. As mining stakeholders embed Scope 3 emission considerations, material-efficient road designs resonate with sustainability commitments, fuelling short-term demand across resource-rich geographies.
Restraints Impact Analysis of Geogrids Market*
| Restraints | (~) % Impact on CAGR Forecast | Geographic Relevance | Impact Timeline |
|---|---|---|---|
| Polypropylene and HDPE price volatility | -0.7% | Global, pronounced in price-sensitive regions | Short term (≤ 2 years) |
| Fragmented certification standards | -0.5% | Worldwide, hurdles for cross-border projects | Medium term (2-4 years) |
| Limited installer skill sets | -0.3% | Asia-Pacific, MEA and Latin America | Medium term (2-4 years) |
| Source: Mordor Intelligence | |||
Price Volatility of Polypropylene and HDPE
Spikes in polypropylene spot values compress margins for manufacturers locked into fixed-price public contracts. To buffer risk, producers hedge feedstock exposure and diversify toward polyester, yet substitution remains partial because polypropylene dominates high-volume roads. Price uncertainty also complicates project budgeting, leading some agencies to postpone geogrid tenders or seek escalation clauses. Over the near term, volatility is likely to deter adoption in cost-sensitive rural road programs, trimming incremental demand in emerging economies despite strong structural drivers for the geogrids market.
Fragmented Certification Standards Across Regions
A lack of globally harmonised test methods forces suppliers to duplicate certification across ASTM, ISO, and country-specific regimes[2]. Each additional protocol adds laboratory fees, inventory complexity, and time-to-market delays, disadvantages that fall hardest on small and medium enterprises. Multilateral attempts to converge standards move slowly, so manufacturers allocate engineering budgets to matrix regional test variations instead of product innovation. Disparate rules also impair project tendering, as owners struggle to compare technical equivalence, occasionally defaulting to familiar incumbent brands. This regulatory friction moderates international expansion, dampening the compound growth of the geogrids market over the medium term.
*Our forecasts treat driver/restraint impacts as directional, not additive. The impact forecasts reflect baseline growth, mix effects, and variable interactions.
Geogrids Market Segment Analysis
By Material:
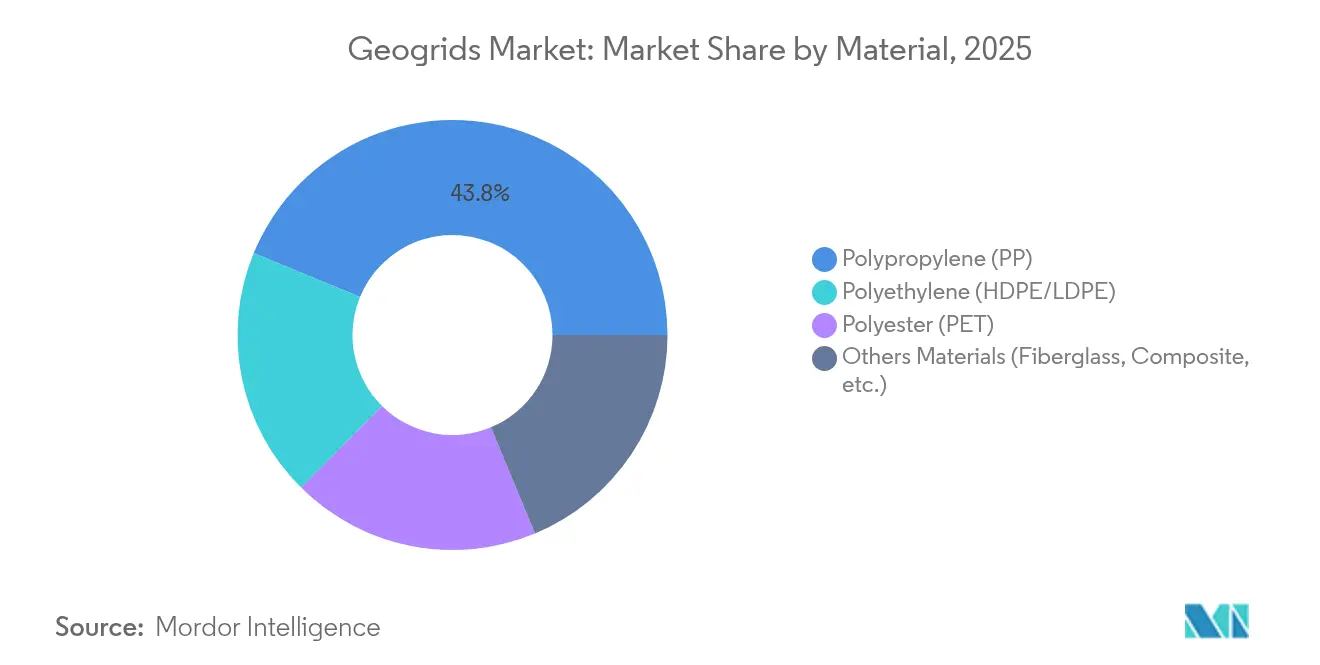
Polypropylene Dominance Amid Polyester InnovationThe geogrids market registered a polypropylene contribution of 43.78% in 2025, translating into the single-largest slice of global revenues. In absolute terms, the polypropylene segment commanded a larger share of the geogrids market size than any other material because its tensile efficiency, chemical inertness, and price competitiveness meet most highway specifications without additional resin modifiers.
Yet the same data show polyester advancing at a 5.32% CAGR, the sharpest trajectory among materials, as engineers prioritise creep resistance for long-term load-bearing structures. Polyester’s lower susceptibility to oxidative degradation under sustained stress makes it the preferred choice for high embankments and reinforced steep slopes that must resist constant gravitational pull over decades. Design consultancies increasingly prescribe polyester for structures exceeding 10 m in height, a specification niche widening as urban sprawl pushes transport corridors onto marginal terrain.

By Structural Type:
Triaxial Gains Ground on Biaxial LeadershipBiaxial designs delivered 45.21% of global revenue in 2025, thereby anchoring the structural hierarchy of the geogrids market. Their dominance stems from multi-decade design guidance, abundant field data, and manufacturing economies of scale that drive down unit costs. Engineers deploying standard flexible pavement rehabilitation often default to biaxial because guidance documents contain traffic-equivalent thickness factors calibrated for its stiffness profile.
Nevertheless, triaxial units are expanding at a 5.05% CAGR and are increasingly specified for heavy-loading conditions where omnidirectional traffic patterns create high shear at aggregate interfaces. Independent laboratory tests reveal that triaxial grids can reduce permanent deformation 30–40% more effectively than biaxial under cyclic wheel loads, owing to their radial rib distribution that mobilises interlock in every direction.
By Manufacturing Method:
Knitted/Woven Techniques Challenge ExtrusionExtrusion supplied 40.79% of global volume in 2025 and continues to dominate mass-market supply on account of high-throughput lines that confer cost advantages for commodity grades. The method provides tight aperture control, facilitating quality-assurance protocols compliant with ASTM D6637 tensile testing. However, knitted and woven production is posting a 4.67% CAGR, outpacing extrusion as pavement engineers prioritise aggregate interlock and junction flexibility.
Knitted PET grids exhibit superior junction efficiency because yarns are mechanically interlaced rather than heat-bonded, yielding higher pull-out resistance when laid over rough subgrades. Comparative trials conducted on Louisiana DOT’s full-scale test section showed that knitted grids lowered rutting by 18 mm versus 11 mm for extruded equivalents over identical base thickness, an outcome attributed to the higher conformability of woven structures.
By Application:
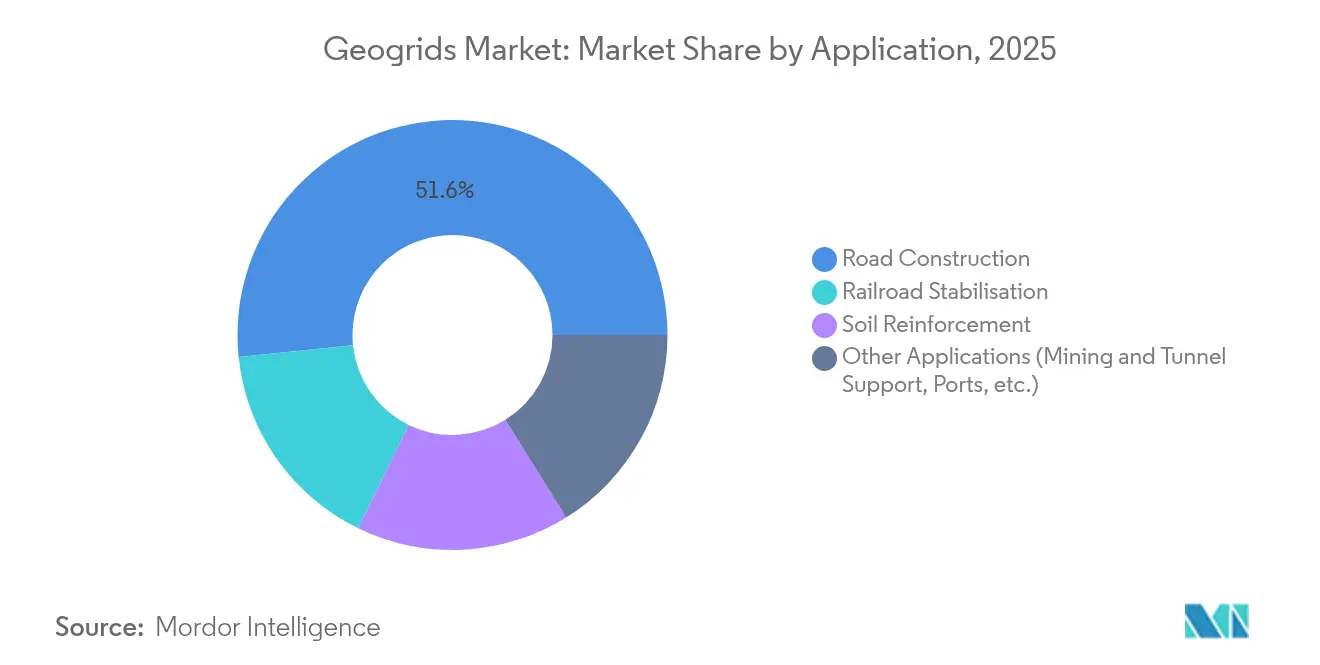
Mining and Tunnel Support Diversify Beyond RoadsRoad construction represented 51.63% of the 2025 geogrids market size as agencies embedded grids into standard pavement-rehab playbooks. Layered flexible pavement designs integrating geogrids typically achieve 20–35% reductions in aggregate thickness, savings that multiply across multi-kilometre projects. Yet the application portfolio is broadening; demand for haul-road stabilisation, tunnel-face support, and rail ballast confinement is projected to grow 4.94% annually through 2031, outpacing highways. The shift is particularly notable in copper, gold, and lithium mines where geogrids underpin high-speed haul traffic as pits deepen.
Railways are another emerging outlet as operators look to control ballast settlement under higher axle loads from double-stack freight. Tests at the Transportation Technology Center in Pueblo, Colorado, found that geogrid-stiffened ballast layers halve maintenance tamping cycles without compromising track geometry. Collectively, these non-road segments provide countercyclical revenue streams that soften the impact of highway funding cycles, reinforcing the structural resilience of the geogrids market.
Geography Analysis
North America Geogrids Market
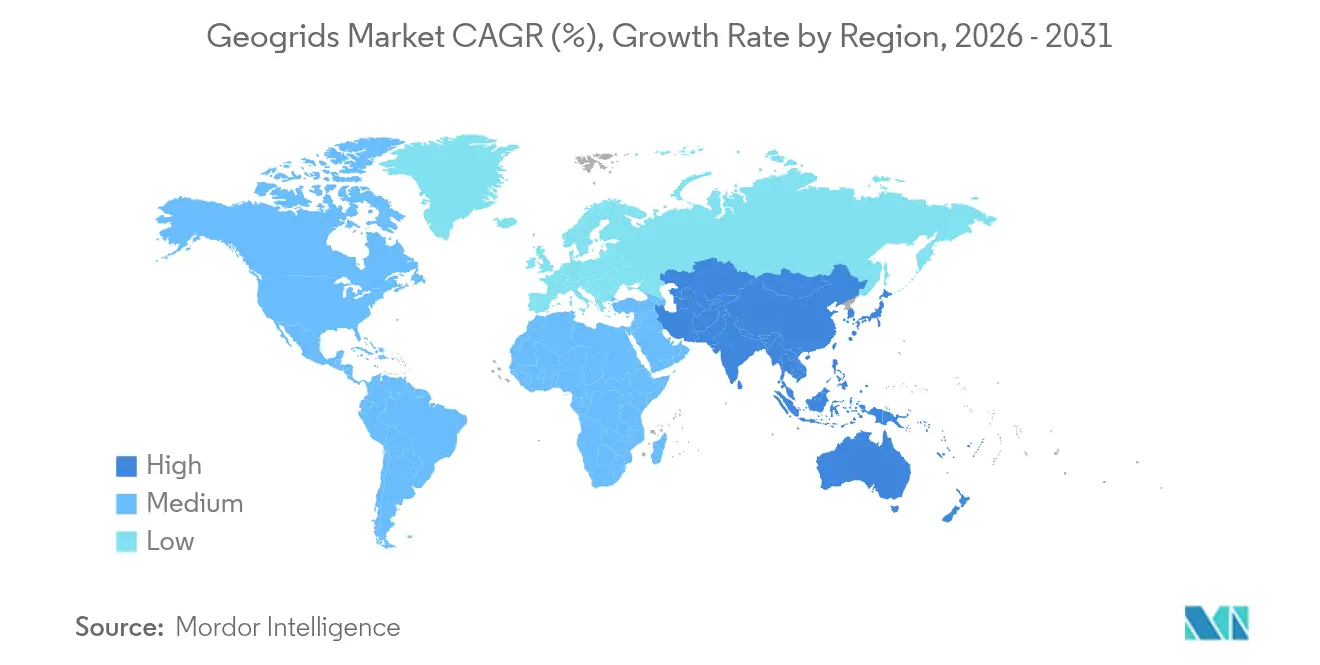
North America delivered 39.01% of 2025 revenues, underpinned by USD 350 billion of federal highway funding authorised by the Infrastructure Investment and Jobs Act. State DOT specifications routinely cite AASHTO R50 procedures for geogrid qualification, effectively institutionalising demand. Pavement preservation philosophies in California, Texas, and New York have moved from thickness-addition toward mechanical stabilisation, translating into higher unit uptake even as lane-kilometre growth slows.
APAC Geogrids Market
Asia-Pacific ranks as the fastest-growing territory with a 4.74% CAGR through 2031, buoyed by expressway and rail megaprojects across China, India, Indonesia, and Vietnam. Chinese provinces allocate grids for frost-susceptible embankments on high-speed routes such as the Harbin–Yichun corridor, while India’s National Highways Authority mandates tensile-grade PET geogrids on expansive-clay subgrades within the Bharatmala Pariyojana. Abundant infrastructure pipelines and soil-condition challenges synergize to keep the Asia-Pacific geogrids market on a higher-than-global trajectory.
Europe Geogrids Market
Europe is driven by the rehabilitation of legacy networks and stringent carbon-reduction rules that favour material-efficient reinforcement. France’s Directorate-General for Infrastructure specifies geogrids in full-depth pavement recycling, while the UK Infrastructure Strategy aligns product selection with net-zero goals.
South America and GCC Geogrids Market
Beyond the triad, South America leans on public-private concession models, and Gulf Cooperation Council states fund new-build corridors across desert terrain, both contexts where geogrids counteract weak subgrade stiffness and sand-induced rutting, broadening the global footprint of the geogrids market.
Regulatory Landscape
In the European Union, Regulation (EU) 2024/3110 (the updated Construction Products Regulation, replacing Regulation (EU) No 305/2011) raises the bar on construction product information and introduces mechanisms such as a digital product passport, along with stronger requirements around performance information tied to environmental sustainability. In early 2026, the UK aligned market access through the Construction Products (Amendment) Regulations 2025, which came into force on 8 January 2026 and allows products compliant with the EU-CPR 2024 regime to be placed on the UK market, while it continues to operate under its own evolving construction-product framework.
For public infrastructure, compliance is also enforced through agency and standards pathways rather than a single global rulebook. In the United States, geogrid procurement commonly ties back to ASTM test methods (for example, tensile characterization) and AASHTO procedures, with state DOT submittal and evaluation processes (such as those published by the Kentucky Transportation Cabinet and Oregon DOT) shaping what products can be specified and installed on funded projects. In the UK, the government opened a consultation on a proposed General Safety Requirement for construction products not covered by designated standards (running 25 February 2026 to 20 May 2026), reinforcing the need for manufacturers to manage technical documentation and dual compliance across CE-marked/CPR-aligned products and emerging UK-specific requirements.
Value Chain Analysis
The geogrids value chain begins with petrochemical feedstocks converted into polymers such as polypropylene, polyethylene, and polyester, followed by resin compounding and geogrid manufacture using processes such as extrusion with punching and stretching (uniaxial/biaxial), as well as knitted or woven techniques for selected constructions. Quality control and compliance testing are a key midstream gate, since many highway and civil applications require validated performance data against recognized protocols before products are accepted into DOT or owner specifications.
Downstream, geogrids move through a mix of direct sales and distributor-led channels to civil contractors, design-build firms, and mining operators, where logistics (bulky rolls, freight-rate volatility, and port or container disruptions) can influence delivered cost and lead times. Procurement and specification are increasingly shaped by project documentation needs (ASTM/AASHTO/CE-related compliance) and supply risk management, including supplier diversification and localized sourcing responses to tariff-driven cost inflation in the United States during 2025. Competitive differentiation also extends beyond manufacturing into technical services, including design support and digital tools that help embed a supplier's products into consultant designs and tender packages.
Competitive Landscape
The geogrids industry maintains moderate fragmentation. Commercial Metals Company (CMC) heightened consolidation momentum by purchasing Tensar for USD 550 million, securing polymer extrusion capacity alongside engineering service teams. Technological differentiation stands out as a primary competitive lever. Digital twin compatibility is gaining strategic weight; suppliers offering parameterised product libraries that integrate with finite-element platforms like MIDAS and Plaxis shorten consultant design cycles, thereby embedding their grids into tender packages. On the sustainability front, players are experimenting with mass-balance certified recycled polypropylene and bio-based resin blends to pre-empt tightening EU carbon disclosure rules. Early pilots show that recycled-content grids can achieve 90% of virgin-polymer tensile strength, positioning eco-grades as credible substitutes once durability testing matures.
Geogrids Industry Leaders
-
Commercial Metals Company
-
HUESKER International
-
Maccaferri Spa
-
Naue GmbH & Co. KG
-
Solmax
- *Disclaimer: Major Players sorted in no particular order

Geogrids Market Companies Covered in this Report
- ABG Limited
- ACE Geosynthetics
- Commercial Metals Company
- CTM Technical Textiles Ltd.
- Geofabrics Australasia Pty Ltd.
- HUESKER International
- Maccaferri Spa
- Naue GmbH & Co. KG
- Pietrucha International Sp. z o. o.
- Singhal Industries Pvt. Ltd.
- Solmax
- Strata Systems, Inc.
- Taian Road Engineering Materials
- TECHFABINDIA
- TENAX SpA
- Thrace Group
- Titan Environmental
Market Opportunities and Future Outlook
Quantified carbon and cost accounting at the project level is creating whitespace for suppliers that pair geogrids with credible calculation tools and documentation aligned to owner sustainability scoring. In June 2026, Geoworks launched Geoworks IQ, a design specification platform using Giroud-Han methodology to calculate cost and carbon savings for geogrid-reinforced haul roads, which reinforces the move toward data-backed selection in mining and heavy-haul applications where haul-road performance and Scope 3 considerations are increasingly scrutinized.
Localization of manufacturing and technology development is also widening the addressable opportunity set in fast-building regions and import-sensitive markets. Exeed Geotextile inaugurated a 175,000 sq ft production facility in the Sharjah Airport International Free Zone (SAIF Zone) in June 2026 with annual capacity of 3,125 tons, including geogrid systems, adding regional supply depth for GCC-linked infrastructure and industrial projects. In India, the Ministry of Textiles approved a Rs 14.92 crore project in July 2026 under the National Technical Textiles Mission to develop indigenous geo-grid coating technology with the Man Made Textiles Research Association and Yamuna Machines Pvt. Ltd., reflecting public support to reduce dependence on imported know-how and accelerate domestically qualified products for roads and earthworks.
Recent Industry Developments in Geogrids Market
- July 2026: The Ministry of Textiles (India) approved a Rs 14.92 crore project under the National Technical Textiles Mission to develop indigenous geo-grid coating technology with the Man Made Textiles Research Association and Yamuna Machines Pvt. Ltd. The program strengthens local capability in a critical process step for technical textile-based geogrids, supporting domestic qualification and supply resilience for infrastructure applications.
- September 2025: Naue introduced a new Traverse (crossbar) technology aimed at enabling structured removal and potential reuse of geosynthetics such as Secugrid and Combigrid geogrids. By improving deconstruction and material recovery, it advances circularity workflows that are becoming more relevant as embodied-carbon disclosure and waste minimization rise in public works procurement.
- July 2025: Maccaferri completed the acquisition of CPT Group, an Italian specialist in mechanised tunnelling technologies and robotic prefabrication systems. The deal broadens Maccaferri's integrated underground construction capabilities, supporting bundled solutions where ground support systems and engineered reinforcement products are specified together in complex infrastructure builds.
Geogrids Market Report Scope and Research Methodology
Market Definition and Coverage
The market is defined as revenue generated from geogrid products used to reinforce and stabilize soil and aggregates in civil engineering and construction works, including transportation infrastructure and earth retention projects.
Scope exclusions: We exclude geotextiles, geomembranes, geocells, installation labor, and broader project civil works value that sits outside the geogrid product itself.
Segments Covered in This Report
- By Material
- Polypropylene (PP)
- Polyethylene (HDPE/LDPE)
- Polyester (PET)
- Others Materials (Fiberglass, Composite, etc.)
- By Structural Type
- Uniaxial
- Biaxial
- Triaxial
- By Manufacturing Method
- Extrusion
- Knitted/Woven
- Bonded/Welded
- By Application
- Road Construction
- Soil Reinforcement
- Railroad Stabilisation
- Other Applications (Mining and Tunnel Support, Ports, etc.)
- By Geography
- Asia-Pacific
- China
- Japan
- India
- South Korea
- ASEAN Countries
- Rest of Asia-Pacific
- North America
- United States
- Canada
- Mexico
- Europe
- Germany
- United Kingdom
- France
- Italy
- Spain
- Russia
- NORDIC Countries
- Rest of Europe
- South America
- Brazil
- Argentina
- Rest of South America
- Middle-East and Africa
- Saudi Arabia
- South Africa
- Rest of Middle-East and Africa
- Asia-Pacific
Data Sources, Market Sizing, and Validation
Desk Research
Desk research was used to build the demand context and keep assumptions tied to visible, repeatable signals. We leaned on public infrastructure and construction indicators such as government transport and public works budgets, national statistics on construction output, and road and rail pipeline releases, then used customs and trade statistics to sense-check import reliance where local production is limited.
We also reviewed technical and adoption cues from standards and agencies that influence specifications, plus peer-reviewed papers and conference proceedings on pavement reinforcement performance and design approaches. For supply-side grounding, we used company annual reports, investor presentations, and press releases to track capacity additions and product positioning, and we supported this with paid subscriptions for company financials and intelligence, patent databases, and shipment-level import and export records when available. The sources listed here are illustrative, and many other public references were reviewed for data collection, validation, and clarification.
Primary Interviews and Surveys
Primary work helped pressure-test the desk inputs and convert them into a practical market model. We spoke with manufacturers, distributors, contractors, designers, and procurement teams across APAC, EMEA, and the Americas to validate application mix, typical specification choices, and price movements, including how bids are indexed to resin and freight.
Distribution of primary research fieldwork respondents
| Company type | Respondent position | Region |
|---|---|---|
| Top tier: 33% | CXOs: 15% | APAC: 38% |
| Mid tier: 46% | Functional/Unit leaders: 41% | EMEA: 37% |
| Smaller Players: 21% | Managers: 44% | Americas: 25% |
Market-Sizing & Forecasting
Our sizing starts with a top-down build where infrastructure activity is reconstructed by region using road and rail construction outlays, lane-km additions and rehabilitation cycles, and the share of projects where reinforcement is specified. Once the demand pool is set, it is converted into value using typical geogrid usage rates by application and thickness class, then translated into average selling prices adjusted for material choice.
To keep results realistic, we corroborate totals through selective bottom-up approximations, such as roll-ups from sampled supplier revenues, channel checks on tender volumes, and sampled price per square meter multiplied by installed area. When data is patchy for smaller countries, gaps are handled using proxy indicators like construction spending growth, import dependence from customs data, and similarity-based adoption rates from comparable markets.
Forecasting is done using scenario analysis supported by regression-style checks on key drivers. Inputs we track include public infrastructure capex cycles, asphalt and aggregate demand signals, polymer resin price direction, freight and duty impacts on landed costs, and changes in specification acceptance that can shift adoption in road base and retaining wall projects.
Data Validation & Update Cycle
Validation is done through multiple passes where estimates are compared against independent signals such as construction output trends, trade flows, and capacity announcements, and then reviewed for year-on-year jumps that do not match project cycles. Where large variances show up, we revisit assumptions, re-check the desk sources, and re-contact select interviewees to confirm whether the change is structural or temporary.
Before sign-off, outputs go through a step-by-step analyst review that checks arithmetic, unit conversions, currency timing, and whether the implied adoption rates look practical by region. The report is refreshed annually, and interim updates are made when a material event occurs, followed by a final freshness pass close to delivery so clients receive the latest view.
Mordor Intelligence's Geogrids Market Size Versus Other Published Estimates
Published market sizes for geogrids can look far apart because different studies do not always start from the same demand pool, year, or price basis. The biggest differences usually come from what is counted as market value, how pricing is treated across resin cycles, and whether the update was done before or after a major shift in infrastructure spending.
In this study, the main gap tends to come from counting only geogrid product revenues tied to civil engineering use cases, rather than blending in other geosynthetics or bundled project services. This scope choice is kept consistent through the model and then refreshed in the final numbers by Mordor Intelligence.
Benchmark comparison
| Source | Market Size | Gaps in Research Methodology |
|---|---|---|
| Mordor Intelligence | USD 1.58 B (2026) | |
| Global Consultancy A | USD 2.12 B (2024) | Uses a 2024 base and a faster growth path, and the definition is presented as a geogrid segment inside a broader geosynthetics context, which can pull in adjacent demand and pricing assumptions. |
| Industry Publisher B | USD 1.35 B (2024) | Anchors to a 2024 base year and applies a different adoption and pricing progression, which can understate markets where specification acceptance and infrastructure spends are rising post-2024. |
The spread is explained mostly by base-year choice, how narrowly the product scope is kept, and how pricing is carried forward through resin-driven cycles. By tying the estimate to visible infrastructure activity signals and then confirming assumptions through interviews, our approach stays traceable and easier to reconcile when numbers are compared side by side.
Key Questions Answered in the Report
What is the current size of the geogrids market?
The geogrids market size reached USD 1.58 billion in 2026 and is projected to grow to USD 1.93 billion by 2031.
Which material segment leads the geogrids market?
Polypropylene leads, accounting for 43.78% of 2025 revenue, although polyester is expanding the fastest.
Why are triaxial geogrids gaining popularity?
Triaxial designs distribute loads omnidirectionally, lowering rutting and settlement, and hence are growing at a 5.05% CAGR.
Which region is forecast to post the highest growth?
Asia-Pacific is expected to grow at a 4.74% CAGR through 2031, propelled by large-scale highway and rail projects.
How do geogrids contribute to carbon reduction in road construction?
Reinforced pavements require thinner aggregate layers, cutting embodied emissions by up to 85 tCO₂e per kilometre.