
Gas Pipeline Infrastructure Market Size and Share
Market Overview
| Study Period | 2022 - 2032 |
|---|---|
| Market Size (2027) | USD 3.25 Trillion |
| Market Size (2032) | USD 3.92 Trillion |
| Growth Rate (2027 - 2032) | 3.81 % |
| Fastest Growing Market | Asia-Pacific |
| Largest Market | North America |
| Market Concentration | Medium |
Major Players *Disclaimer: Major Players sorted in no particular order Image © Mordor Intelligence. Reuse requires attribution under CC BY 4.0. | |
Gas Pipeline Infrastructure Market Analysis by Mordor Intelligence
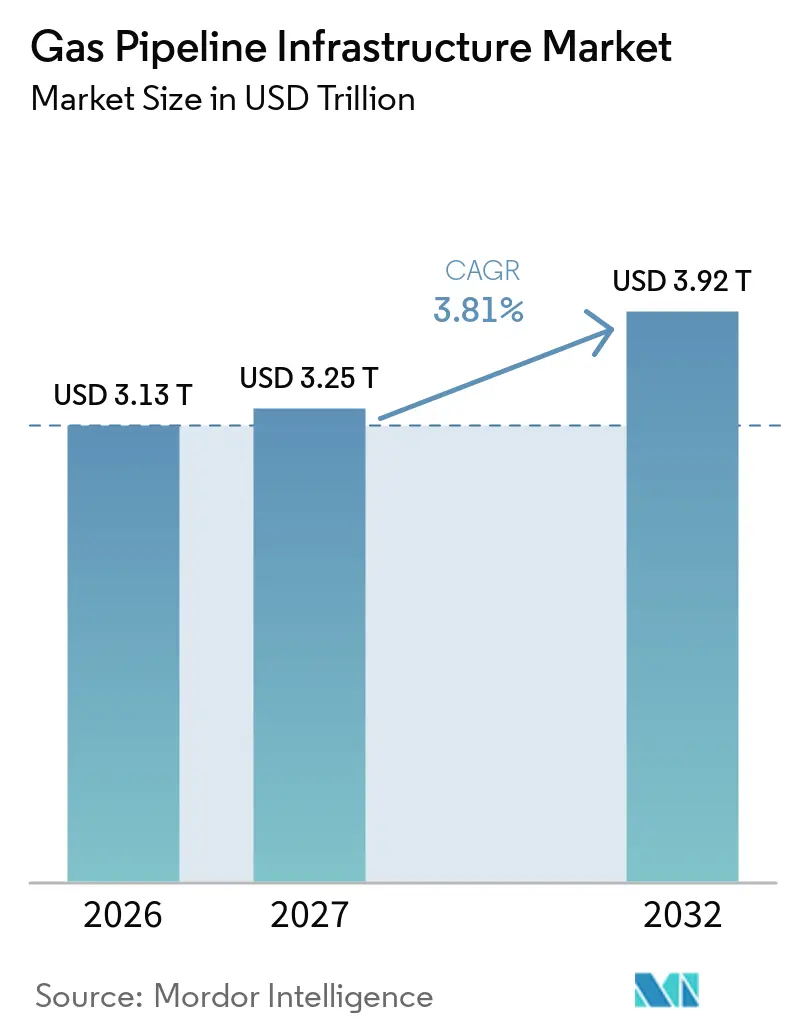
The Gas Pipeline Infrastructure Market size is expected to increase from USD 3.13 trillion in 2026 to USD 3.25 trillion in 2027 and reach USD 3.92 trillion by 2032, growing at a CAGR of 3.81% over 2027-2032. Investment is being supported by new Liquefied Natural Gas (LNG) export corridors, replacement of aging distribution networks, and gas-grid expansion in emerging economies. The gas pipeline infrastructure market also benefits from projects that connect offshore fields, import terminals, and power plants with national transmission systems. Operators are prioritizing expansions within existing rights-of-way because these projects can reduce permitting exposure and make better use of established assets. Hydrogen and biomethane planning is changing equipment specifications, while emissions reporting and digital integrity requirements are adding to operating needs. The outlook remains exposed to permit delays, electrification risk in mature markets, legacy-pipe compatibility, and cybersecurity needs, although contracted capacity and long-duration concessions can reduce project risk.
Key Report Takeaways
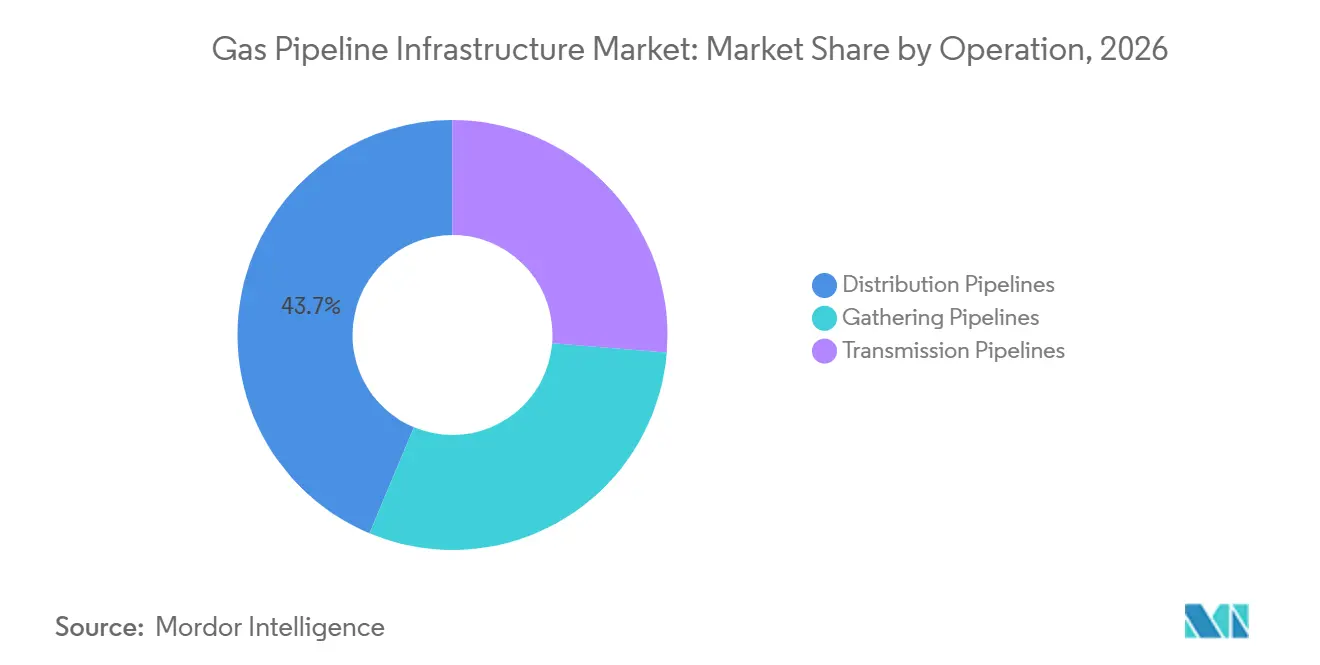
- By operation, Distribution Pipelines held 43.7% of the gas pipeline infrastructure market share in 2026, while Transmission Pipelines are forecast to grow at a 4.4% CAGR through 2032.
- By application, Onshore Pipelines accounted for 87.3% of the gas pipeline infrastructure market share in 2026, while Offshore Gas Pipeline Construction is forecast to grow at a 5.2% CAGR through 2032.
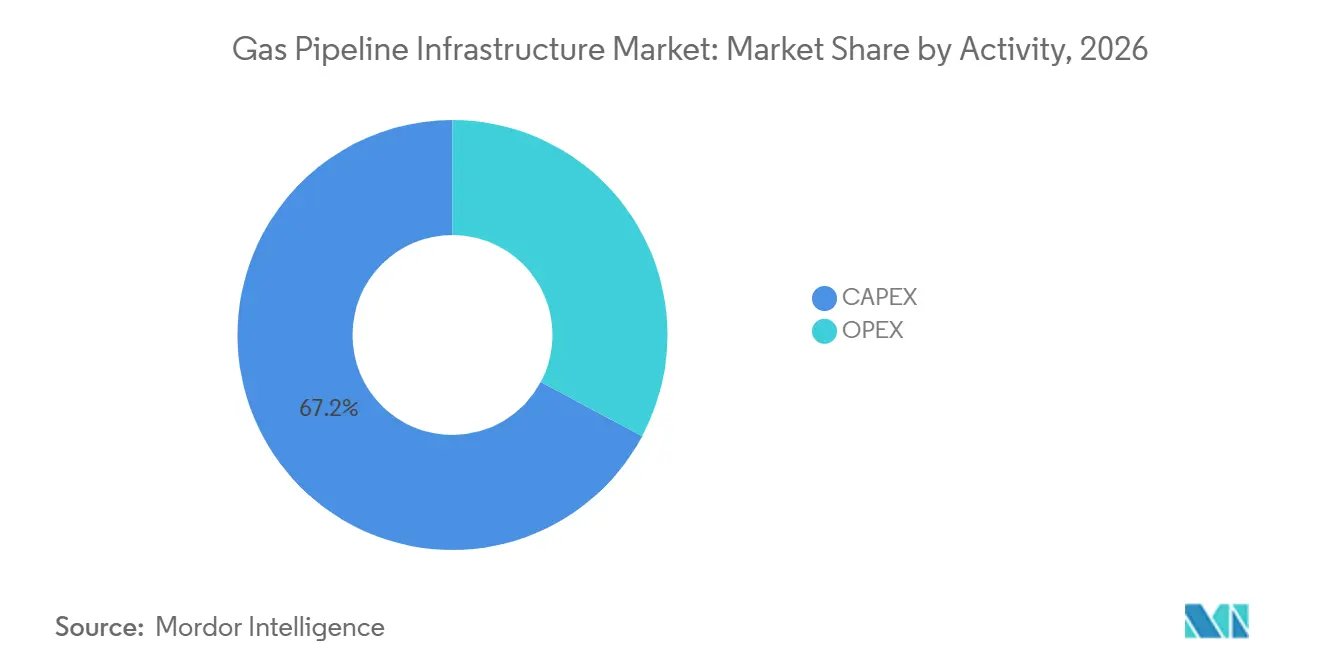
- By activity, Capital Expenditure (CAPEX) accounted for 67.2% of the gas pipeline infrastructure market size in 2026 and is forecast to grow at a 4.8% CAGR through 2032.
- By end user, Midstream Transmission and Distribution Operators held 37.6% share in 2026, while Power Generation is forecast to grow at a 4.6% CAGR through 2032.
- By geography, North America held a 33.7% share in 2026, while Asia-Pacific is forecast to grow at a 5.1% CAGR through 2032.
Note: Market numbers in this report are based on Mordor Intelligence's proprietary estimation framework, which combines nine months of actuals with Q4 projections for base year 2026.
Market Trends and Insights
Drivers Impact Analysis of Gas Pipeline Infrastructure Market*
| Driver | (~) % Impact on CAGR Forecast | Geographic Relevance | Impact Timeline |
|---|---|---|---|
| LNG Export-Linked Pipeline Expansion | +1.2% | Global, concentrated in North America, the Middle East, and Asia-Pacific | Short term (≤ 2 years) |
| Aging Network Replacement and Safety Modernization | +0.7% | North America and Europe, with early gains in Japan and South Korea | Medium term (2-4 years) |
| Gas Grid Expansion in Emerging Economies | +0.7% | Asia-Pacific, with spillover to the Middle East, Africa, and South America | Long term (≥ 4 years) |
| Hydrogen and Biomethane Network Repurposing | +0.4% | European Union, Australia, and Canada | Long term (≥ 4 years) |
| Methane Measurement and Digital Integrity Adoption | +0.3% | North America and the European Union, expanding to the Middle East | Medium term (2-4 years) |
| Multi-Molecule Pipeline Design for Asset Optionality | +0.2% | Global, with early activity in Europe, the United States, and the Middle East | Long term (≥ 4 years) |
| Source: Mordor Intelligence | |||
LNG Export-Linked Pipeline Expansion
LNG export projects are sustaining near-term demand for high-pressure transmission lines. The U.S. Energy Information Administration expects U.S. LNG exports to reach 17.0 billion cubic feet per day (Bcf/d) in 2026 and reported 44.9 Bcf/d of pipeline capacity under development for 2026 and 2027 in Texas and Louisiana.[1] These projects link gas production regions with liquefaction terminals, so capacity additions are tied to defined shipping and export commitments. ADNOC Gas awarded USD 2.1 billion in January 2025 for facilities that include a 1,154.7-kilometer transmission pipeline for the Ruwais LNG project.[2] Mexico is also becoming a transit corridor and LNG export platform, which extends demand for cross-border feed gas connections. This project pipeline gives contractors and pipe suppliers visibility into where capacity has customer commitments before construction begins within the gas pipeline infrastructure market.
Aging Network Replacement and Safety Modernization
Replacement programs are creating work that is less exposed to commodity-price changes than greenfield construction. Pipeline and Hazardous Materials Safety Administration (PHMSA) maintains a public inventory of higher-risk distribution infrastructure and describes replacement as a continuing pipeline-safety priority.[3] CenterPoint Energy allocated USD 55 million in 2025 for the final phase of a 16-year Ohio program that replaced more than 850 miles of aging pipe.[4] NYSEG and RG&E reported more than USD 300 million in gas infrastructure spending since 2023 and more than 100 miles of main replacement. Modern replacement materials can support future gas-blending options when selected and qualified for that service. The gas pipeline infrastructure market therefore has a recurring revenue base alongside its larger construction projects.
Gas Grid Expansion in Emerging Economies
Emerging economies continue to add pipelines where gas networks remain incomplete. India has identified a USD 67 billion infrastructure gap and a need for nearly 9,630 additional miles of pipeline by 2030, based on the input draft. Indian Oil Corp. committed INR 24.49 billion, USD 256 million, to a 424.65-kilometer Kochi to Thoothukudi pipeline in September 2026, based on the input draft. Vietnam’s 431-kilometer Lô B–Ô Môn project entered offshore steel-pipe production in October 2025 and targets first gas in late 2026. New power plants, import terminals, and domestic industrial connections create demand for both transmission and distribution capacity. National energy plans give many of these projects policy support in addition to their commercial purpose. This supports a broader geographic base for the gas pipeline infrastructure market and gives suppliers access to more national procurement programs.
Hydrogen and Biomethane Network Repurposing
European infrastructure planning increasingly considers methane, hydrogen, and renewable gas within the same network. European Network of Transmission System Operators for Gas (ENTSOG) states that methane and hydrogen remain important energy carriers across its net-zero scenarios through 2050. A 2025 scientific review cited 5.2 billion cubic meters of European biomethane production from 1,548 plants in 2024. ENNOH and ENTSOG have published criteria for assessing whether natural gas infrastructure can be repurposed. Operators that account for valves, seals, compressors, and material compatibility during upgrades have more flexibility than operators that defer these choices. Repurposing activity can extend the economic use of selected assets while creating a need for engineering, testing, and interconnection work.
Restraints Impact Analysis of Gas Pipeline Infrastructure Market*
| Restraint | (~) % Impact on CAGR Forecast | Geographic Relevance | Impact Timeline |
|---|---|---|---|
| Permitting and Social-License Delays | -0.5% | North America and the European Union, especially high-density and Indigenous-territory corridors | Short term (≤ 2 years) |
| Stranded-Asset Risk from Electrification and Renewables | -0.5% | North America, Europe, Australia, South Korea, and Japan | Long term (≥ 4 years) |
| Hydrogen Embrittlement and Blending-Compatibility Constraints | -0.3% | Global, especially high-strength steel transmission lines in North America and Europe | Medium term (2-4 years) |
| Cybersecurity Exposure Across Legacy Operational Technology | -0.2% | Global, with particular exposure in North America and Europe | Medium term (2-4 years) |
| Source: Mordor Intelligence | |||
Permitting and Social-License Delays
Permitting can delay pipeline construction even where customers and financing are in place. A National Petroleum Council report published through the U.S. Department of Energy stated that interstate pipeline timelines can exceed 4 years from application to construction authorization. Environmental review, state permits, land access, and consultation processes can move on separate schedules. This raises costs through inflation, financing charges, and contractor remobilization. It also favors expansions within existing corridors because established rights-of-way can reduce some route-related requirements. Project sponsors need early engagement with regulators, communities, and affected landholders to limit schedule uncertainty.
Stranded-Asset Risk from Electrification and Renewables
Electrification can reduce gas throughput in areas where distribution systems carry high fixed costs. A 2025 study in Scientific Reports found that uncoordinated electrification could increase average gas bills for customers who do not electrify as customer numbers decline. That dynamic may place pressure on utility asset values and future network extension decisions. Operators can reduce exposure by limiting greenfield distribution expansion in areas with a high electrification outlook. Transmission investments with contracted industrial, power, or LNG demand have a different risk profile from local distribution additions. Regulatory treatment of depreciation and asset recovery will remain central to capital planning in mature gas systems.
*Our forecasts treat driver/restraint impacts as directional, not additive. The impact forecasts reflect baseline growth, mix effects, and variable interactions.
Gas Pipeline Infrastructure Market Segment Analysis
By Operation:
Distribution Pipelines Lead Spending While Transmission Gains MomentumDistribution Pipelines held 43.7% of global spending in 2026, supported by regulated replacement and network-expansion work. The category includes local mains that deliver gas from high-pressure networks to commercial, industrial, and residential users. North America, Europe, Japan, and South Korea have large installed systems that require continued integrity investment. The Pipeline and Hazardous Materials Safety Administration (PHMSA) safety programs and comparable regional requirements support multi-year spending on replacement projects. Gathering Pipelines connect production areas with processing facilities and remain linked to upstream activity. Their demand is more sensitive to producer capital spending than distribution work. Distribution investment is more stable because utilities must maintain reliable service and meet public-safety obligations. This stability gives the gas pipeline infrastructure market a sizeable base of recurring work. Utilities also need to coordinate replacement work with road access, customer service, and local safety requirements. These practical constraints favor contractors that can deliver work consistently across many small locations.
Transmission Pipelines are forecast to record a 4.4% CAGR through 2032. These long-distance lines are central to LNG feedgas projects, cross-border trade, and large power or industrial connections. The U.S. Energy Information Administration reported significant planned capacity in Texas and Louisiana for 2026 and 2027, where new lines are intended to serve LNG export infrastructure. China and India also have large transmission programs in the input draft. In-corridor looping and compression additions are becoming an important option because they add capacity without creating a completely new route. TC Energy reported approximately CAD 1.1 billion in in-corridor expansion facilities for its NGTL System as of December 2025. This approach can shorten development timelines and lower exposure to land and permit challenges. Gathering lines continue to serve new field development, but their outlook is more tied to upstream economics. The different profiles of the 3 operation types create room for operators with both regulated distribution assets and contracted transmission capacity in the gas pipeline infrastructure market. Pipeline manufacturers can also benefit from replacement orders and large-diameter transmission demand at the same time.

By Application:
Onshore Networks Retain Scale While Offshore Projects Add Technical DemandOnshore Pipelines represented 87.3% of global spending in 2026. Their scale reflects the wide reach of distribution systems, gathering lines, and long-distance transmission routes on land. Onshore construction links producing basins with processing plants, cities, industrial centers, storage sites, and LNG terminals. It is also the setting for most safety replacement programs in mature economies. Line-pipe requirements, welding controls, and pressure testing remain important to project quality. Existing transport corridors can make brownfield onshore projects more practical than new routes. India and China contribute to onshore construction demand as their national gas networks expand. The category remains central to the gas pipeline infrastructure industry because it covers the largest number of end-use connections. Local construction conditions, land access, and environmental controls can vary sharply between projects. Contractors need to manage these differences while maintaining consistent safety and material standards.
Offshore Gas Pipeline Construction is forecast to grow at a 5.2% CAGR through 2032. This segment serves deepwater fields, offshore production hubs, coastal terminals, and cross-water connections. Saipem received a USD 1.5 billion contract in September 2025 for Phase 3 of Türkiye’s Sakarya development, including a 183-kilometer, 24-inch gas export pipeline installed in water depths of up to 2,200 meters. Allseas and Boskalis were awarded a EUR 1.2 billion contract in July 2025 for Taiwan’s 232-kilometer YT2 offshore gas pipeline. These projects need specialized vessels, subsea engineering, and experienced installation teams in the gas pipeline infrastructure market. The limited number of contractors with deepwater pipelay capacity can strengthen pricing for complex work. Offshore developments are also often tied to national supply-security objectives, which can support project continuity. These conditions distinguish the segment from higher-volume onshore construction. Offshore contracts can also bring longer engineering lead times because route surveys and installation planning start well before pipelaying begins. That raises the value of contractor experience and dependable vessel scheduling.
By Activity:
Capital Expenditure Maintains the Largest Spending PositionCAPEX accounted for 67.2% of the gas pipeline infrastructure market size in 2026. This spending covers pipeline construction, compressors, stations, interconnections, and other assets required before service begins. The concentration reflects greenfield grid expansion in Asia-Pacific and Liquefied Natural Gas (LNG)-related transmission projects in North America. Large projects require substantial investment before they generate tariff or transportation revenue. CAPEX also includes replacement initiatives where old systems must be retired and rebuilt. The scale of this activity shows that construction remains more important than routine maintenance in the current spending mix. It also exposes operators to inflation, permitting, and execution risk during the development period. Contracted capacity can reduce this risk by securing customer commitments ahead of final investment decisions. Financing remains more straightforward where projects have identified users, transparent tariff terms, and defined in-service dates. This is particularly important for large cross-border and LNG-connected systems in the gas pipeline infrastructure market.
CAPEX is forecast to grow at a 4.8% CAGR through 2032, faster than total spending. Enbridge disclosed a USD 29 billion secured capital backlog in March 2025, including USD 2 billion in Mainline reliability investments and a brownfield compression expansion on T-North. Brownfield projects can offer lower execution risk because they build on established systems and customer relationships. OPEX represented the remaining 32.8% of spending in 2026. It includes inspection, integrity management, compressor maintenance, and control-system upgrades. Methane reporting and leak detection requirements are increasing the need for monitoring and repair activity. Over time, the installed base of newer pipelines will add to routine OPEX needs. The gas pipeline infrastructure market is therefore expected to retain a high construction share while building a larger base of digital and integrity spending. Operators will need to balance new-build investment with maintenance of assets already in service. This will make the relationship between CAPEX and OPEX more important as the installed network expands.
By End User:
Midstream Operators Lead Demand While Power Generation AcceleratesMidstream Transmission and Distribution Operators held 37.6% of end-user demand in 2026. These operators connect producers, processing systems, storage facilities, import terminals, power plants, industrial users, and local distribution companies. Their position gives them demand exposure across several customer groups rather than one end-use sector. Long-duration tariffs, ship-or-pay agreements, and regulated returns can support investment decisions. Upstream Oil and Gas Producers use gathering systems to move production to processing and transport networks. Industrial and Manufacturing users need reliable supply for process heat and feedstock. Residential and Commercial Utilities depend on local distribution capacity, but they face more direct electrification risk in some locations. This structure supports a broad customer base for the gas pipeline infrastructure market. It also means that capacity planning must account for different load profiles across producers, utilities, industrial plants, and power stations. Long-distance networks have particular value where they can link several of these demand points across the gas pipeline infrastructure market.
Power Generation is forecast to grow at a 4.6% CAGR through 2032. Gas-fired power stations require dependable pipeline supply, particularly where gas is used for flexible or baseload generation. Growth is supported by coal replacement in some mature regions and new capacity development in South and Southeast Asia. TC Energy said bids in a January 2026 Columbia Gas Transmission open season reached 1.5 Bcf/d, compared with 0.5 Bcf/d offered, with data-center-related power demand among the drivers. This demand can create new connection requirements near large power campuses. Operators that can provide timely connections and firm capacity may be better placed to serve this customer group. Residential and commercial demand remains material, although it faces longer-term change as building electrification advances. Industrial users remain important because their fuel and feedstock needs are harder to replace in the near term. Power connections can require timely development because electricity demand projects often have fixed commissioning schedules. This can reward pipeline systems with available capacity or practical expansion options.
Geography Analysis
North America Gas Pipeline Infrastructure Market
North America held 33.7% of global spending in 2026. The region is supported by LNG export infrastructure, large producing basins, and extensive regulated distribution systems. Texas and Louisiana account for more than 85% of planned U.S. capacity additions for 2026 and 2027, according to the Energy Information Administration (EIA). Canada adds demand through west-coast LNG corridors and expansion of established transmission assets. U.S. interstate projects remain shaped by federal certificate review and permitting requirements.
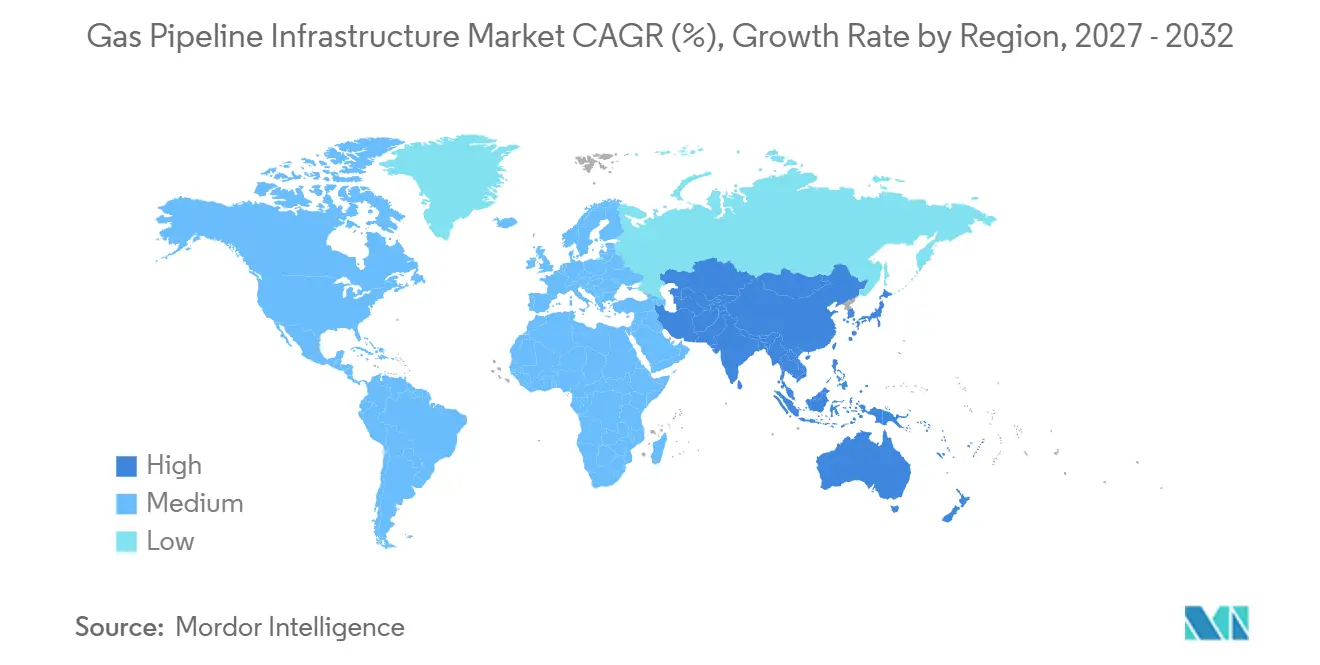
APAC Gas Pipeline Infrastructure Market
Asia-Pacific is forecast to grow at a 5.1% CAGR through 2032, the fastest regional rate in the gas pipeline infrastructure market. China, India, Indonesia, Vietnam, and Thailand are expanding gas systems to link production, import capacity, power generation, and industrial demand. The input draft identifies roughly 22,000 kilometers of active construction in China and 15,000 kilometers in India. Vietnam’s Lô B–Ô Môn project shows offshore and power-linked activity in the region. This group of national programs broadens the opportunity base for the gas pipeline infrastructure market.
Europe, Middle East and South America Gas Pipeline Infrastructure Market
Europe is focusing more on network repurpose, hydrogen readiness, and alternative supply routes. ENTSOG continues to include methane and hydrogen in net-zero pathways. South America is emerging through Argentina’s Vaca Muerta corridor, while the Middle East is supported by state-backed projects such as Ruwais LNG infrastructure. These regions can offer long-duration work but have distinct permitting, local-content, and financing conditions.
Competitive Landscape
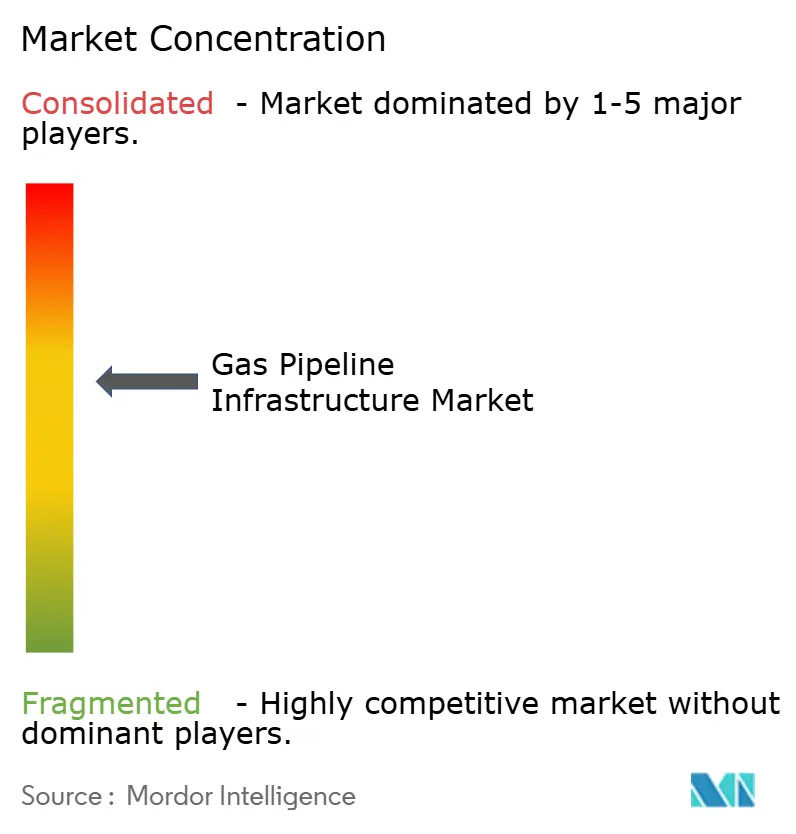
The gas pipeline infrastructure market is moderately consolidated among transmission operators and more fragmented among contractors and suppliers. Enbridge, TC Energy, Kinder Morgan, Williams, Energy Transfer, Snam, Enagás, GAIL, Gazprom, Pembina, APA Group, and National Gas operate or manage major pipeline assets in their respective markets. In the gas pipeline infrastructure market, their advantages include established rights-of-way, regulatory approvals, operating data, and long-term transportation arrangements. Enbridge’s 2025 secured backlog included Mainline reliability investment and the T-North brownfield expansion. TC Energy also reported strong interest in added capacity associated with power demand in 2026.
Construction competition is led by firms with engineering, procurement, installation, and commissioning capability. Saipem, TechnipFMC, Subsea 7, JGC, Bechtel, and McDermott compete for large projects, while offshore work places more weight on vessel access and deepwater experience. Saipem’s Phase 3 Sakarya award followed earlier work on the same field and demonstrates the value of experience on complex projects. Allseas and Boskalis secured the Taiwan YT2 project in 2025, another example of specialized offshore contracting. Tenaris, Vallourec, and Nippon Steel compete in high-specification line pipe.
Material qualification, delivery reliability, and compliance with standards such as API 5L shape supplier competition. Digital integrity services add a separate field around leak detection, supervisory control and data acquisition analytics, and methane monitoring. Operators are directing capital toward contracts and expansions within existing corridors where possible. This approach supports more disciplined project selection across the gas pipeline infrastructure market.
Gas Pipeline Infrastructure Industry Leaders
-
Gazprom PJSC
-
Kinder Morgan Inc.
-
Enbridge Inc.
-
China National Petroleum Corporation
-
GAIL (India) Limited
- *Disclaimer: Major Players sorted in no particular order
Gas Pipeline Infrastructure Market Companies Covered in this Report
- APA Group
- Bechtel Corporation
- China National Petroleum Corporation
- Enagás S.A.
- Enbridge Inc.
- Energy Transfer LP
- GAIL (India) Limited
- Gazprom PJSC
- JGC Corporation
- Kinder Morgan Inc.
- McDermott International, Ltd.
- National Gas
- Nippon Steel Corporation
- Pembina Pipeline Corporation
- Saipem S.p.A.
- Snam S.p.A.
- Subsea 7 S.A.
- TC Energy Corporation
- TechnipFMC plc
- Tenaris S.A.
- Vallourec S.A.
- Williams Companies
Recent Industry Developments in Gas Pipeline Infrastructure Market
- May 2026: The U.S. Energy Information Administration reported that Texas and Louisiana account for more than 85% of planned U.S. natural gas pipeline capacity additions scheduled for 2026 and 2027. The additions are intended to connect natural gas supply with LNG export projects, illustrating the importance of Gulf Coast feedgas demand
- May 2026: NYSEG and Rochester Gas and Electric disclosed more than USD 300 million invested in gas infrastructure since 2023. Their Infrastructure Replacement Program had replaced more than 100 miles of main with materials designed to provide more than 60 years of service life, supporting continued compliance with evolving PHMSA safety standards.
- February 2026: TC Energy reported that bids in the January 2026 Columbia Gas Transmission open season totaled 1.5 Bcf/d, compared with 0.5 Bcf/d of capacity offered. The company identified power-generation load growth from data centers in Indiana, Illinois, Iowa, and South Dakota as major demand driver. The potential expansion is part of TC Energy’s USD 6 billion annual net capital expenditure program through 2030.
- October 2025: PV GAS PIPE commenced production of 32,756 tonnes of steel pipe for the offshore section of the USD 1.27 billion, 431-kilometer Lô B–Ô Môn pipeline. Production was targeted for completion by March 2026, and first gas is expected in late 2026.
Global Gas Pipeline Infrastructure Market Report Scope
Gas pipeline infrastructure is an interconnected network of high-strength steel or plastic pipes, compressor stations, and storage facilities used to transport natural gas safely and economically from production sites and wells to processing plants and end-use markets.
The global gas pipeline infrastructure market is segmented by operation, application, activity, end user, and geography. By operation, the market is segmented into gathering pipelines, transmission pipelines, and distribution pipelines. By application, the market is segmented into onshore and offshore. By activity, the market is segmented into capital expenditure (CAPEX) and operating expenditure (OPEX). By end user, the market is segmented into upstream oil and gas producers, midstream transmission and distribution operators, power generation, industrial and manufacturing, residential and commercial utilities, and other end users. The report also covers the market size and forecasts for the global gas pipeline infrastructure market across 26 countries in key regions. For each segment, the market sizing and forecasts have been provided on the basis of value (USD).
Segmentation Overview
| Gathering Pipelines |
| Transmission Pipelines |
| Distribution Pipelines |
| Onshore |
| Offshore |
| CAPEX |
| OPEX |
| Upstream Oil and Gas Producers |
| Midstream Transmission and Distribution Operators |
| Power Generation |
| Industrial and Manufacturing |
| Residential and Commercial Utilities |
| Other End Users |
| North America | United States |
| Canada | |
| Mexico | |
| Europe | Germany |
| France | |
| Italy | |
| Spain | |
| United Kingdom | |
| Poland | |
| Russia | |
| Rest of Europe | |
| Asia-Pacific | China |
| India | |
| Japan | |
| South Korea | |
| Australia | |
| Indonesia | |
| Vietnam | |
| Thailand | |
| Rest of Asia-Pacific | |
| South America | Brazil |
| Argentina | |
| Chile | |
| Rest of South America | |
| Middle East and Africa | Saudi Arabia |
| United Arab Emirates | |
| Egypt | |
| South Africa | |
| Morocco | |
| Rest of Middle East and Africa |
| By Operation | Gathering Pipelines | |
| Transmission Pipelines | ||
| Distribution Pipelines | ||
| By Application | Onshore | |
| Offshore | ||
| By Activity | CAPEX | |
| OPEX | ||
| By End User | Upstream Oil and Gas Producers | |
| Midstream Transmission and Distribution Operators | ||
| Power Generation | ||
| Industrial and Manufacturing | ||
| Residential and Commercial Utilities | ||
| Other End Users | ||
| By Geography | North America | United States |
| Canada | ||
| Mexico | ||
| Europe | Germany | |
| France | ||
| Italy | ||
| Spain | ||
| United Kingdom | ||
| Poland | ||
| Russia | ||
| Rest of Europe | ||
| Asia-Pacific | China | |
| India | ||
| Japan | ||
| South Korea | ||
| Australia | ||
| Indonesia | ||
| Vietnam | ||
| Thailand | ||
| Rest of Asia-Pacific | ||
| South America | Brazil | |
| Argentina | ||
| Chile | ||
| Rest of South America | ||
| Middle East and Africa | Saudi Arabia | |
| United Arab Emirates | ||
| Egypt | ||
| South Africa | ||
| Morocco | ||
| Rest of Middle East and Africa | ||
Key Questions Answered in the Report
What is the forecast growth rate for global gas pipeline infrastructure?
The global gas pipeline infrastructure market is forecast to grow at a 3.81% CAGR from 2027 to 2032 and reach USD 3.92 trillion by 2032.
Which operation type holds the largest share?
Distribution Pipelines held 43.7% of spending in 2026, supported by regulated replacement and local network investment.
Which pipeline application is growing fastest?
Offshore Gas Pipeline Construction is forecast to grow at a 5.2% CAGR through 2032, supported by deepwater field developments and coastal connections.
Why are LNG projects important for pipeline investment?
LNG terminals require feedgas pipelines that connect production areas with liquefaction capacity, including planned projects in Texas and Louisiana.
Which region has the fastest forecast growth?
Asia-Pacific is forecast to grow at a 5.1% CAGR through 2032, driven by national gas-grid expansion in China, India, Indonesia, Vietnam, and Thailand.
What are the main risks facing pipeline operators?
Permitting delays, electrification-related asset risk, hydrogen compatibility, and operational technology cybersecurity are the key risks discussed in this report.