
Gas Mixtures Market Size and Share
Market Overview
| Study Period | 2022 - 2032 |
|---|---|
| Market Size (2027) | USD 41.34 Billion |
| Market Size (2032) | USD 53.70 Billion |
| Growth Rate (2027 - 2032) | 5.37 % |
| Fastest Growing Market | Asia-Pacific |
| Largest Market | Asia-Pacific |
| Market Concentration | High |
Major Players *Disclaimer: Major Players sorted in no particular order Image © Mordor Intelligence. Reuse requires attribution under CC BY 4.0. | |
Gas Mixtures Market Analysis by Mordor Intelligence
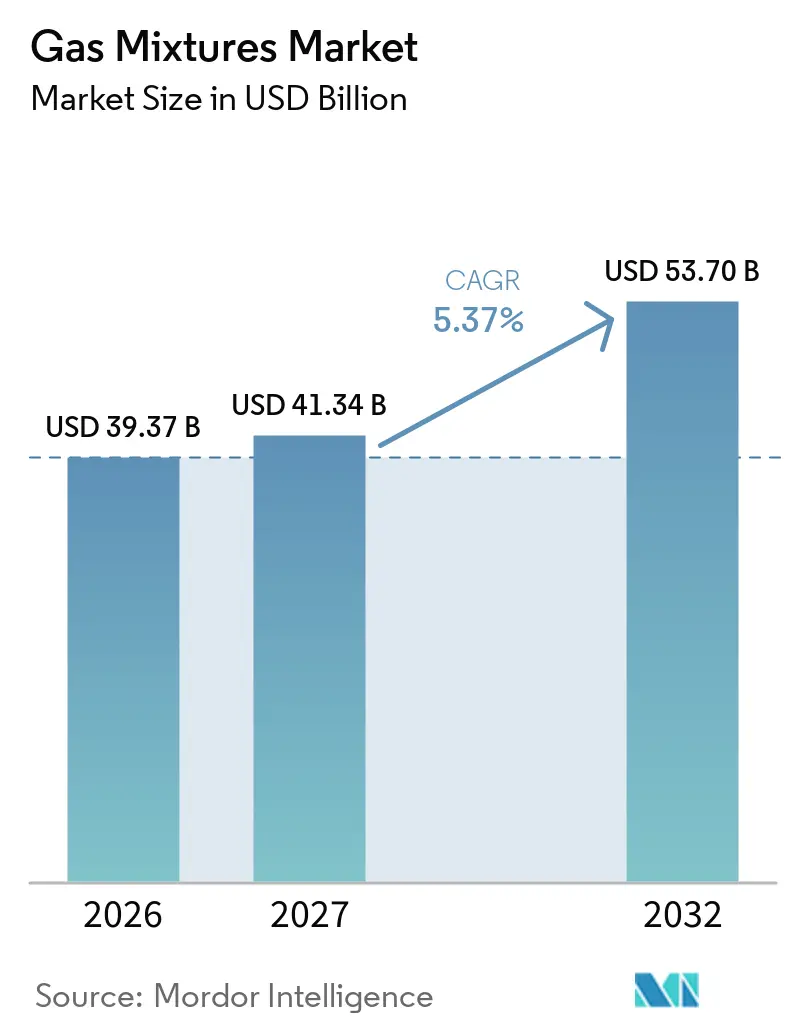
The gas mixtures market size was valued at USD 39.37 billion in 2026 and is estimated to grow from USD 41.34 billion in 2027 to USD 53.70 billion by 2032, at a CAGR of 5.37% during the forecast period (2027-2032). The gas mixtures market is supported by semiconductor capacity additions, certified medical gas systems, modified-atmosphere packaging, and decarbonization projects that use hydrogen and carbon dioxide. These applications require defined compositions, reliable delivery, traceable certification, and continuous quality checks, which makes the market less exposed to short-term spot demand than several commodity chemical categories. Long-term on-site contracts are becoming increasingly important as chipmakers and steel producers seek dependable gas supplies at their operating sites to reduce the risk of production disruptions. This trend gives major suppliers opportunities to integrate production equipment, blending capabilities, testing, storage, and distribution into a single customer relationship, while also creating demand for regional supply systems that meet verified specifications. Energy costs, rare-gas availability, and tighter composition-verification requirements remain important constraints for the gas mixtures market, as they affect cost, lead time, and the ability of smaller suppliers to meet specialized customer requirements. Energy-intensive cryogenic production, concentrated rare-gas supply chains, and certification work favor suppliers with diversified sourcing, accredited laboratories, and reliable local production networks.
Key Report Takeaways
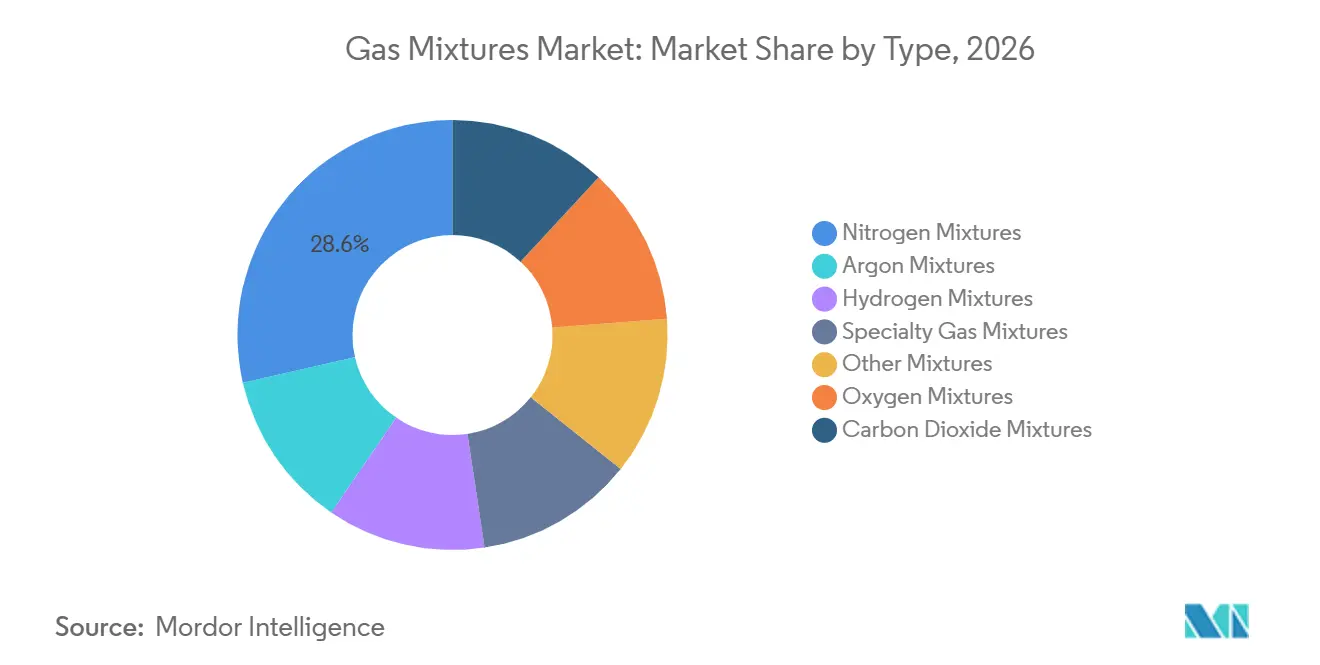
- By type, Nitrogen Mixtures held 28.56% of the gas mixtures market share in 2026, while Specialty Gas Mixtures are projected to grow at a 5.89% CAGR through 2032.
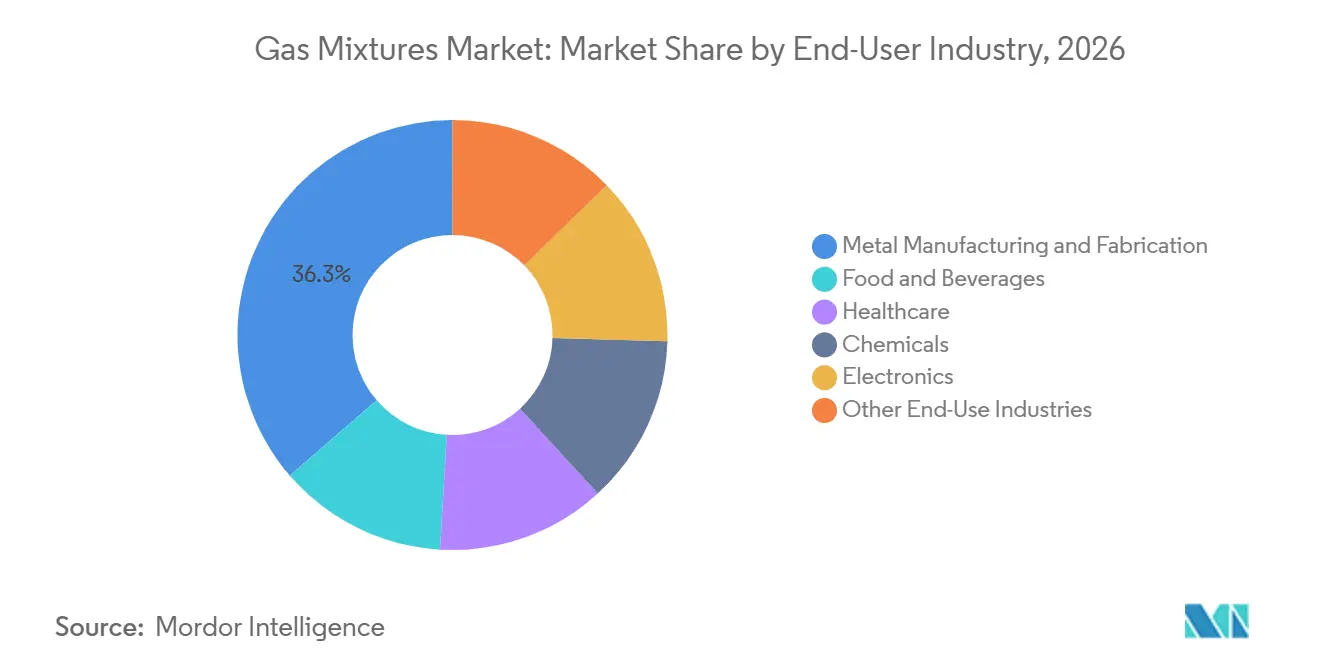
- By end-user industry, Metal Manufacturing and Fabrication held 36.34% of the gas mixtures market share in 2026, while Electronics is projected to grow at a 6.13% CAGR through 2032.
- By geography, Asia-Pacific held 42.71% of the market share in 2026 and is projected to grow at a 5.92% CAGR through 2032.
Note: Market numbers in this report are based on Mordor Intelligence's proprietary estimation framework, which combines nine months of actuals with Q4 projections for base year 2026.
Market Trends and Insights
Drivers Impact Analysis of Gas Mixtures Market*
| Drivers | (~) % Impact on CAGR Forecast | Geographic Relevance | Impact Timeline |
|---|---|---|---|
| Semiconductor Fab Expansion and Ultra-High-Purity Gas Demand | +1.50% | Asia-Pacific core, including South Korea, Taiwan, Japan, and China, North America, and Europe | Medium term (2-4 years) |
| Medical Gas Infrastructure Modernization | +0.80% | Global, concentrated in Asia-Pacific, the European Union, and the Middle East | Short term (≤ 2 years) |
| Food Preservation and Modified-Atmosphere Packaging Adoption | +0.70% | Global, led by Asia-Pacific and North America, with spillover to the Middle East, Africa, and South America | Medium term (2-4 years) |
| Hydrogen, Carbon Capture, and Industrial Decarbonization Projects | +1.00% | Global, including North America, the European Union, Japan, and South Korea | Long term (≥ 4 years) |
| Digital Certification and Regionalized Calibration-Gas Supply | +0.50% | Global, with early adoption in the European Union and North America | Medium term (2-4 years) |
| Source: Mordor Intelligence | |||
Semiconductor Fab Expansion and Ultra-High-Purity Gas Demand
Advanced chip production requires ultra-high-purity blends for deposition, etching, purging, and other process steps where trace contamination can affect production quality. This requirement makes semiconductor investment a major driver of demand in the gas mixtures market, as gas specifications must remain consistent throughout fab operations, from initial qualification through high-volume manufacturing. In July 2026, Linde committed USD 1 billion to expand its Phoenix, Arizona, complex with 2 SPECTRA air separation units. The units supply ultra-high-purity nitrogen, oxygen, and argon to 2 semiconductor fabrication facilities. Such projects require local production assets near customers, making regional capacity across North America, Europe, Japan, India, and Southeast Asia a central competitive requirement for suppliers serving chipmakers, particularly where national policy seeks to establish domestic semiconductor manufacturing capability.
Medical Gas Infrastructure Modernization
Hospital construction and legacy-system upgrades support demand for certified medical gas mixtures and related pipeline systems. The gas mixtures market benefits because each installation requires compliant supply arrangements and regular verification of gas quality over a long operating period. Medical infrastructure projects require systems that comply with EN ISO 7396-1 and National Fire Protection Association (NFPA) 99 requirements, increasing the value of qualified suppliers. This demand extends beyond large hospitals to outpatient facilities and home respiratory care. Portable oxygen-helium and carbon dioxide-oxygen blends require smaller cylinders, reliable distribution, and appropriate remote monitoring capability. The move toward decentralized care also underscores the importance of certification and distribution capabilities in the gas mixtures market, while creating entry barriers for commodity distributors lacking specialty credentials or systems designed for regulated healthcare supply.
Food Preservation and Modified-Atmosphere Packaging Adoption
Modified-atmosphere packaging uses controlled concentrations of nitrogen, carbon dioxide, and oxygen to extend product shelf life. It is an established application for the gas mixtures market across protein, dairy, and fresh produce supply chains. A 2025 Scientific Reports study found that a closed-loop, IoT-connected ternary mixing system maintained a headspace concentration error below 1%[1]. This level of control supports packaging lines that require digitally verified gas composition and remote process monitoring across cold-chain networks. Food processors can therefore place greater value on precision blends than on basic gas filling arrangements. Argon-carbon dioxide and nitrogen-carbon dioxide blends account for much of the demand for modified-atmosphere packaging, while Asia-Pacific exporters use the technology to meet import-quality requirements, reduce food waste, and manage longer cold-chain transit periods.
Hydrogen, Carbon Capture, and Industrial Decarbonization Projects
Hydrogen and carbon dioxide handling adds a new layer of demand to the gas mixtures market without replacing established industrial uses. In June 2025, Linde signed a long-term agreement to invest more than USD 400 million in industrial gas supply to the Blue Point low-carbon ammonia project in Louisiana. These projects require controlled hydrogen and carbon dioxide-rich streams for feed management and conditioning before transport or use. Carbon capture facilities also require reliable processes for the separation, purification, conditioning, and transportation of carbon dioxide. Large projects create long operating periods and can support contracted demand for qualified suppliers with specialized operating capability. The opportunity is strongest where low-carbon ammonia, steel, hydrogen, and carbon capture projects move from planning to construction, as each project requires gas management across several stages of its operating cycle.
Restraints Impact Analysis of Gas Mixtures Market*
| Restraints | (~) % Impact on CAGR Forecast | Geographic Relevance | Impact Timeline |
|---|---|---|---|
| Energy-Intensive Blending and Purification Costs | -0.80% | Global, most acute in the European Union and the Asia-Pacific emerging markets | Short term (≤ 2 years) |
| Specialty-Gas Feedstock and Logistics Volatility | -0.60% | Global, with concentrated exposure for rare-gas-dependent Asia-Pacific fabrication plants and European calibration-gas producers | Medium term (2-4 years) |
| Mixture-Specific Safety, Traceability, and Compliance Burden | -0.50% | Global, particularly in healthcare, electronics, and emission monitoring | Long term (≥ 4 years) |
| Source: Mordor Intelligence | |||
Energy-Intensive Blending and Purification Costs
Cryogenic air separation is the primary production method for many nitrogen, oxygen, and argon mixtures. Electricity can account for 30-40% of operating costs for a typical air separation unit, making exposure to electricity prices a significant operational concern. The gas mixtures market is therefore sensitive to differences in power costs across production regions and to changes in local grid reliability. European producers can face a cost disadvantage in commodity-grade blends when regional power prices remain high relative to Asian production locations. Premium specialty products can recover more of their costs through value-based pricing, but high-output welding gas products can face margin pressure during periods of rising energy prices. Messer invested EUR 747 million (USD 835.54 million) in fiscal year 2025, including investment in new air separation capacity in the United States, China, and Vietnam, which supported a broader production base with lower exposure to European electricity volatility and access to markets where industrial customers continue to add capacity.
Specialty-Gas Feedstock and Logistics Volatility
Neon, krypton, xenon, and helium availability remains a supply risk for the specialty segment of the gas mixtures market. Neon is used in deep ultraviolet laser gas mixtures for advanced lithography, while helium is required in several specialty applications. Historical dependence on Ukraine-based steel-plant byproduct streams demonstrated how quickly supply disruptions can affect semiconductor gas portfolios. Suppliers have diversified procurement and invested in rare-gas recovery equipment at their own production locations. Smaller producers may still face higher unit costs because they cannot spread recovery-asset costs across large output quantities or fund comparable recovery systems. Helium remains exposed to outages at major natural-gas processing facilities, which can raise spot prices, disrupt logistics, and complicate supply planning for producers and customers that require uninterrupted deliveries.
*Our forecasts treat driver/restraint impacts as directional, not additive. The impact forecasts reflect baseline growth, mix effects, and variable interactions.
Gas Mixtures Market Segment Analysis
By Type:
Nitrogen Mixtures Lead, Specialty Gas Mixtures Define the Growth FrontierNitrogen Mixtures held a 28.56% share of the gas mixtures market in 2026, making them the largest segment by type across a broad range of industrial applications. Their position reflects use in semiconductor wafer processing, metal heat treatment, food flushing, and chemical reactor blanketing. Nitrogen serves as a carrier gas, purge medium, and inerting agent across multiple applications, reducing the need for customers to change gas systems for each use. Oxygen Mixtures support electric arc furnace steelmaking, respiratory therapy, and wastewater treatment, while Carbon Dioxide Mixtures serve food packaging and beverage carbonation. Argon Mixtures are used in welding stainless steel, aluminum, and other nonferrous metals, including in automotive, aerospace, and precision fabrication.
Specialty Gas Mixtures are projected to expand at a 5.89% CAGR from 2027 to 2032, the fastest growth rate by type. This growth is linked to new semiconductor plants, analytical instrument calibration, and pulmonary diagnostic applications in healthcare. Specialty blends certified to ISO/IEC 17025 can command prices 3-10 times higher than commodity nitrogen or argon blends per unit, giving the segment value beyond its smaller physical output. Messer expanded its electronics specialty gases center in Coolbaugh, Pennsylvania, and operates electronic-gas production facilities and specialty gas centers in China. EN ISO 6143:2025 introduces tighter composition-verification requirements, favoring producers with accredited testing capability while increasing the challenge for smaller suppliers without comparable laboratory resources.

By End-User Industry:
Metal Manufacturing Anchors Share, While Electronics Records Fastest GrowthMetal Manufacturing and Fabrication held a 36.34% share of the gas mixtures market in 2026, the largest share by end-user industry. Electric arc furnace steelmaking uses oxygen for combustion optimization and nitrogen for stirring at higher rates per metric ton of steel than traditional blast-furnace processes. Lower-carbon steelmaking policies support continuing demand for welding and shielding gases even as the sector reduces its carbon footprint. Messer introduced Ferroline C6 X1, a blend of argon, carbon dioxide, and oxygen for unalloyed steels, at Schweissen & Schneiden 2025. Food and beverages, healthcare, chemicals, and other end-user industries require different compositions, delivery formats, and compliance protocols.
Electronics is projected to grow at a 6.13% CAGR from 2027 to 2032, the fastest rate among end-user industries. Higher purity and tighter composition control are required as semiconductor process nodes advance below 3 nanometers. Atomic layer deposition, reactive ion etching, and chemical vapor deposition increase gas requirements per fabrication process, even when wafer output does not rise at the same rate. Air Products will supply nitrogen, oxygen, argon, and hydrogen to Samsung facilities in Pyeongtaek, South Korea, through a project scheduled to come onstream in phases from 2028 to 2030. Supplier qualification can take 12-18 months, and installed suppliers face high switching costs once on-site systems are embedded in fab operations.
Geography Analysis
APAC Gas Mixtures Market
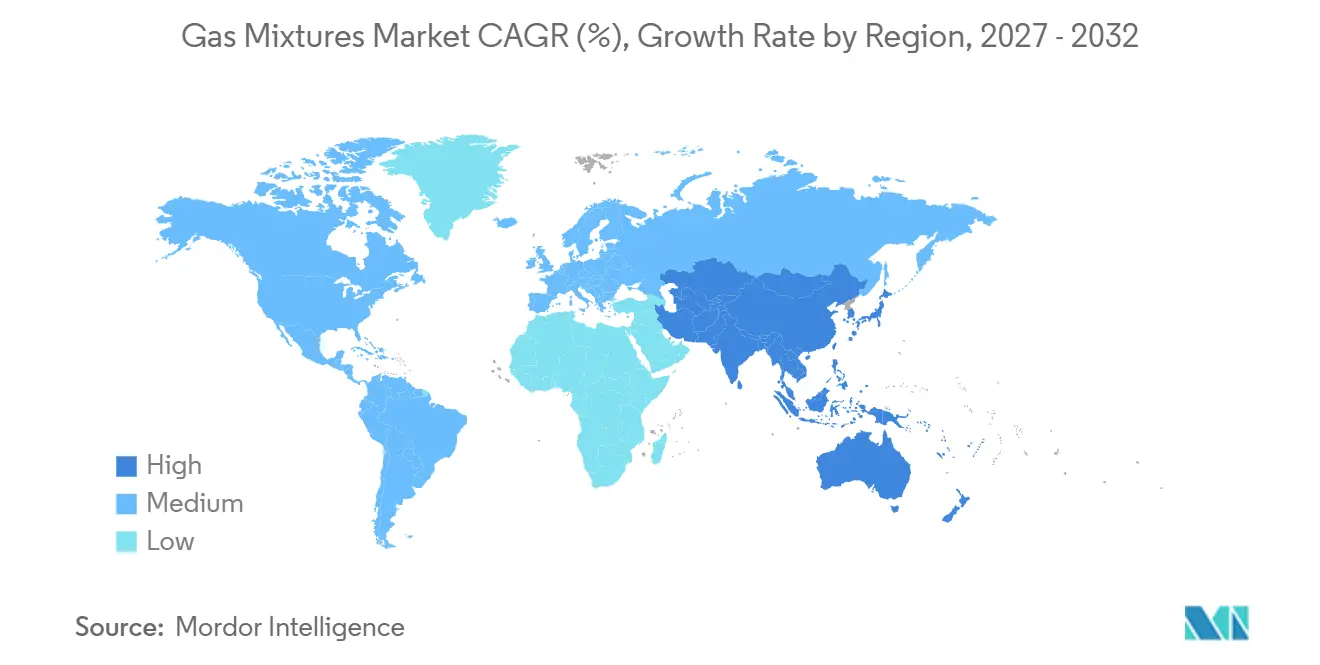
Asia-Pacific accounted for 42.71% of the gas mixtures market in 2026 and is projected to grow at a 5.92% CAGR through 2032. The region holds the largest market share and the fastest regional growth rate, as South Korea, Taiwan, Japan, and mainland China concentrate semiconductor manufacturing capacity, foundry activity, and advanced industrial production. These production centers require an on-site ultra-high-purity gas supply, stable delivery, verified quality, and production capacity that scales with the addition of fabrication lines. India is developing its first domestic semiconductor fabrication project and related outsourced semiconductor assembly and test units, creating an additional source of regional demand for equipment and gas. INOX Air Products began construction of an INR 500 crore specialty gas hub in Dholera, Gujarat, to supply ultra-high-purity nitrogen, oxygen, argon, and hydrogen. Southeast Asia is also attracting investment as electronics manufacturing shifts from higher-cost locations.
ASEAN Gas Mixtures Market
Messer announced a USD 40 million expansion in Thai Nguyen Province, Vietnam, adding 900 metric tons per day of liquid-gas capacity. This capacity is intended to support the growing electronics and semiconductor base in the region as production networks expand across Southeast Asia and customers seek shorter, more secure supply chains. The wider adoption of medical-gas and calibration-gas certification frameworks across several national systems further supports the gas mixtures market in the Asia-Pacific. These frameworks are increasingly aligning with EN ISO and ISO/IEC requirements, supporting more consistent product verification across regional customer industries and increasing the value of accredited supply arrangements.
The Americas and EMEA Gas Mixtures Market
North America is experiencing increased demand driven by semiconductor fabrication projects and low-carbon industrial development along the Gulf Coast. Linde's USD 1 billion Phoenix project and Air Products' USD 250 million Arizona investment indicate a substantial expansion of the regional electronics supply chain, with multi-year contract commitments and large on-site infrastructure requirements. Europe combines advanced manufacturing needs with climate targets, with Germany's Silicon Saxony cluster and automotive base remaining important to suppliers, and Air Liquide's Dresden investment reflecting this focus. Nordic countries and France support food-grade packaging and healthcare demand, while Italy is expanding air separation capacity with a new Nippon Sanso unit in Caserta, which began operations in October 2025. South America relies on food, beverages, mining, and industrial applications, while the Middle East and Africa offer long-term potential in industrial diversification, metals and mining, healthcare development, and Saudi Arabia's Vision 2030 programs.
Competitive Landscape
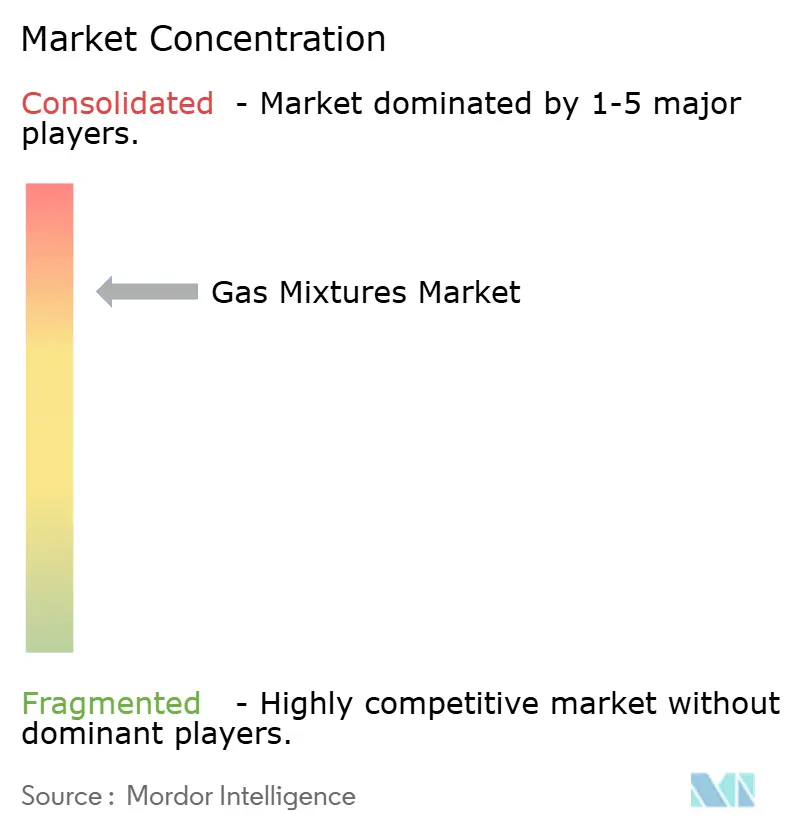
The gas mixtures market is consolidated because major suppliers operate capital-intensive production systems, testing facilities, distribution fleets, and on-site networks that smaller firms cannot easily replicate. Their principal strategy involves long-term on-site supply agreements that place production capability close to the customer and link gas supply with customer production schedules. These arrangements can convert a gas sale into an infrastructure relationship lasting 15-25 years, reduce exposure to open-market price competition, provide customers with a dedicated source of critical gases, and create a more predictable base of contracted revenue for the supplier.
Air Liquide launched its BEYOND plan in October 2026, targeting EUR 24 billion (USD 26.84 billion) in industrial investment decisions through 2030, with electronics and artificial intelligence semiconductor infrastructure as the largest focus. Linde's SPECTRA air separation technology supports semiconductor supply, while Air Products uses PRISM hydrogen-generation systems for dedicated customer applications and integrated industrial gas projects. These capabilities help you qualify with electronics customers who audit suppliers under ISO/IEC 17025 and require reliable, verified gas quality throughout a production line. Linde reported a USD 8.1 billion sale-of-gas project backlog in the second quarter of 2026, reflecting the value of contracted supply projects to major suppliers and the scale of commitments associated with new industrial facilities.
Digital calibration and decentralized supply are areas where regional companies can build specialized positions in the gas mixtures market without matching the scale of on-site electronics investment. EN ISO 6143:2025 increases the need for traceable verification of calibration gas composition and clearer documentation of analytical performance, making accredited testing more relevant to customer selection. Westfalen and SOL Group focus on calibration gases and food-grade blends, where smaller suppliers can develop specialized capabilities and local customer relationships. Messer's EUR 747 million (USD 835.54 million) fiscal year 2025 investment program indicates that second-tier suppliers are expanding geographic coverage rather than ceding large regions to the top three suppliers, with additional production capacity being added in the United States, China, and Vietnam[2]. Regional rare-gas recovery specialists in Asia-Pacific can also recapture neon and argon from existing air separation operations, thereby reducing import dependence and strengthening supply security for semiconductor customers.
Gas Mixtures Industry Leaders
-
Linde plc
-
Air Liquide
-
Air Products and Chemicals, Inc.
-
Messer SE & Co. KGaA
-
Iwatani Corporation
- *Disclaimer: Major Players sorted in no particular order
Gas Mixtures Market Companies Covered in this Report
- Air Liquide
- Air Products and Chemicals, Inc.
- AIR WATER INC
- Coregas
- Ellenbarrie Industrial Gases Limited
- Gruppo SIAD
- Gulfcryo
- Iwatani Corporation
- Linde PLC
- Messer SE & Co. KGaA
- Nippon Sanso Holdings Corporation
- Nippon Sanso Holdings Corporation
- PT Samator Indo Gas Tbk
- SOL Group
- Westfalen
Recent Industry Developments in Gas Mixtures Market
- October 2026: Air Liquide launched its "BEYOND" strategic plan for 2030, committing approximately EUR 24 billion (USD 26.84 billion) in industrial investment through the plan period. Electronics and AI infrastructure supply were identified as the largest single investment focus, reflecting the company's plans to expand ultra-high-purity gas supply to next-generation semiconductor fabs globally.
- September 2026: Air Products announced a long-term agreement to supply high-purity industrial gases to a semiconductor manufacturer in the United States, representing its second major semiconductor contract win in 2026. Combined investment across the two contracts exceeds USD 900 million, with the Arizona project alone committing approximately USD 250 million in hydrogen generation, carbon dioxide purification, and bulk-gas infrastructure.
Global Gas Mixtures Market Report Scope
A gas mixture is a physical combination of two or more gases that occupy the same space and share the same temperature while retaining their individual chemical identities. Gas mixtures are commonly used in industrial, medical, and environmental applications, where precise gas combinations are required to meet specific operational or regulatory standards.
The gas mixtures market is segmented by type, end-user industry, and geography. By type, the market is segmented into nitrogen mixtures, oxygen mixtures, carbon dioxide mixtures, argon mixtures, hydrogen mixtures, specialty gas mixtures, and other mixtures. By end-user industry, the market is segmented into metal manufacturing and fabrication, food and beverages, healthcare, chemicals, electronics, and other end-use industries. The report also covers market sizes and forecasts for the gas mixtures across 16 countries in major regions. The market sizes and forecasts are provided in terms of value (USD).
Segmentation Overview
| Nitrogen Mixtures |
| Oxygen Mixtures |
| Carbon Dioxide Mixtures |
| Argon Mixtures |
| Hydrogen Mixtures |
| Specialty Gas Mixtures |
| Other Mixtures |
| Metal Manufacturing and Fabrication |
| Food and Beverages |
| Healthcare |
| Chemicals |
| Electronics |
| Other End-Use Industries |
| Asia-Pacific | China |
| India | |
| Japan | |
| South Korea | |
| ASEAN Countries | |
| Rest of Asia-Pacific | |
| North America | United States |
| Canada | |
| Mexico | |
| Europe | Germany |
| United Kingdom | |
| France | |
| Italy | |
| NORDIC Countries | |
| Russia | |
| Rest of Europe | |
| South America | Brazil |
| Argentina | |
| Rest of South America | |
| Middle East and Africa | Saudi Arabia |
| South Africa | |
| Rest of Middle East and Africa |
| By Type | Nitrogen Mixtures | |
| Oxygen Mixtures | ||
| Carbon Dioxide Mixtures | ||
| Argon Mixtures | ||
| Hydrogen Mixtures | ||
| Specialty Gas Mixtures | ||
| Other Mixtures | ||
| By End-User Industry | Metal Manufacturing and Fabrication | |
| Food and Beverages | ||
| Healthcare | ||
| Chemicals | ||
| Electronics | ||
| Other End-Use Industries | ||
| By Geography | Asia-Pacific | China |
| India | ||
| Japan | ||
| South Korea | ||
| ASEAN Countries | ||
| Rest of Asia-Pacific | ||
| North America | United States | |
| Canada | ||
| Mexico | ||
| Europe | Germany | |
| United Kingdom | ||
| France | ||
| Italy | ||
| NORDIC Countries | ||
| Russia | ||
| Rest of Europe | ||
| South America | Brazil | |
| Argentina | ||
| Rest of South America | ||
| Middle East and Africa | Saudi Arabia | |
| South Africa | ||
| Rest of Middle East and Africa | ||
Key Questions Answered in the Report
What is current market size of Gas Mixtures Market?
The gas mixtures market size was valued at USD 39.37 billion in 2026 and is estimated to grow from USD 41.34 billion in 2027 to USD 53.70 billion by 2032, at a CAGR of 5.37% during the forecast period (2027-2032).
Which gas mixture type has the largest share?
Nitrogen Mixtures led with a 28.56% share in 2026 because they serve the electronics, metal fabrication, food processing, and chemicals sectors. Their role as carrier, purge, and inerting gases supports broad, recurring demand, while oxygen, carbon dioxide, and argon mixtures serve more application-specific requirements across regulated and industrial settings, including steel production, respiratory therapy, food preservation, beverage carbonation, and high-performance metal joining.
Which end-user application is growing fastest?
Electronics is projected to grow at a 6.13% CAGR through 2032 as advanced semiconductor processes require more precise gas supply. Deposition, etching, and related steps increase purity, traceability, and on-site supply requirements, while customer qualification makes established supply relationships more difficult to replace at operating fabrication facilities.
Which region leads global demand?
Asia-Pacific held a 42.71% share in 2026 and is projected to grow at a 5.92% CAGR through 2032. Its leading position reflects semiconductor capacity in South Korea, Taiwan, Japan, and mainland China, alongside emerging investment in India and Southeast Asia and wider adoption of quality standards for regulated medical and calibration uses.