France LED Lighting Market Size and Share
Market Overview
| Study Period | 2020 - 2031 |
|---|---|
| Forecast Data Period | 2026 - 2031 |
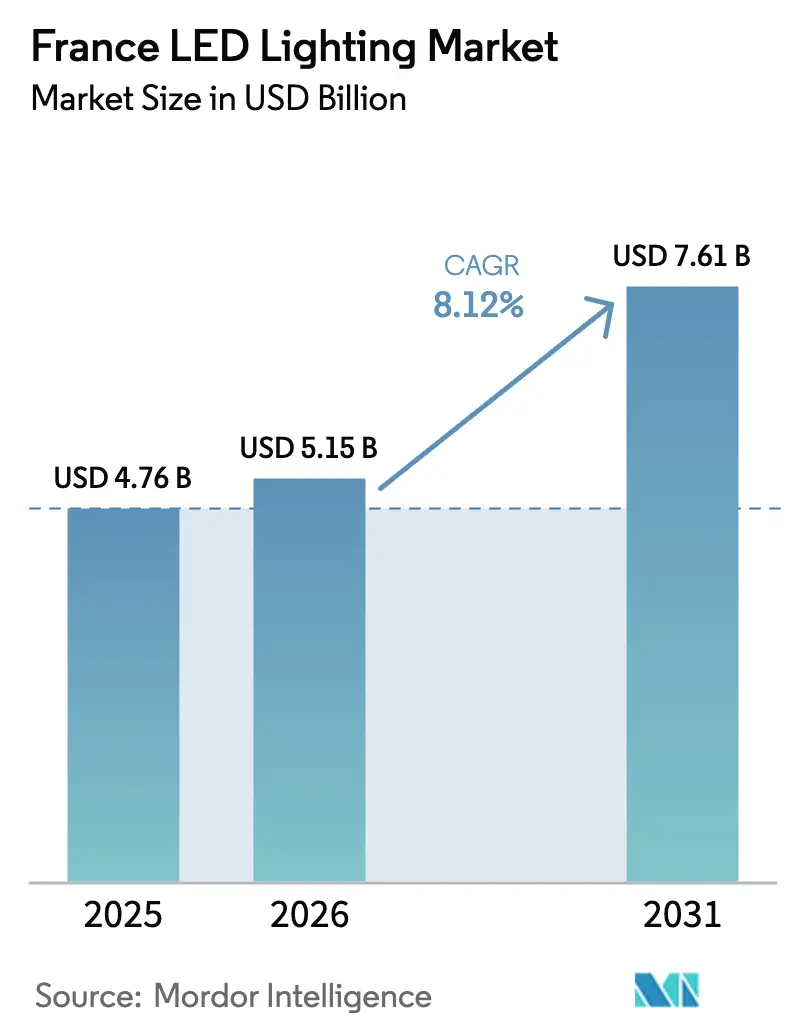
| Base Year Market Size (2025) | USD 4.76 Billion |
| Market Size (2026) | USD 5.15 Billion |
| Market Size (2031) | USD 7.61 Billion |
| Growth Rate (2026 - 2031) | 8.12% CAGR |
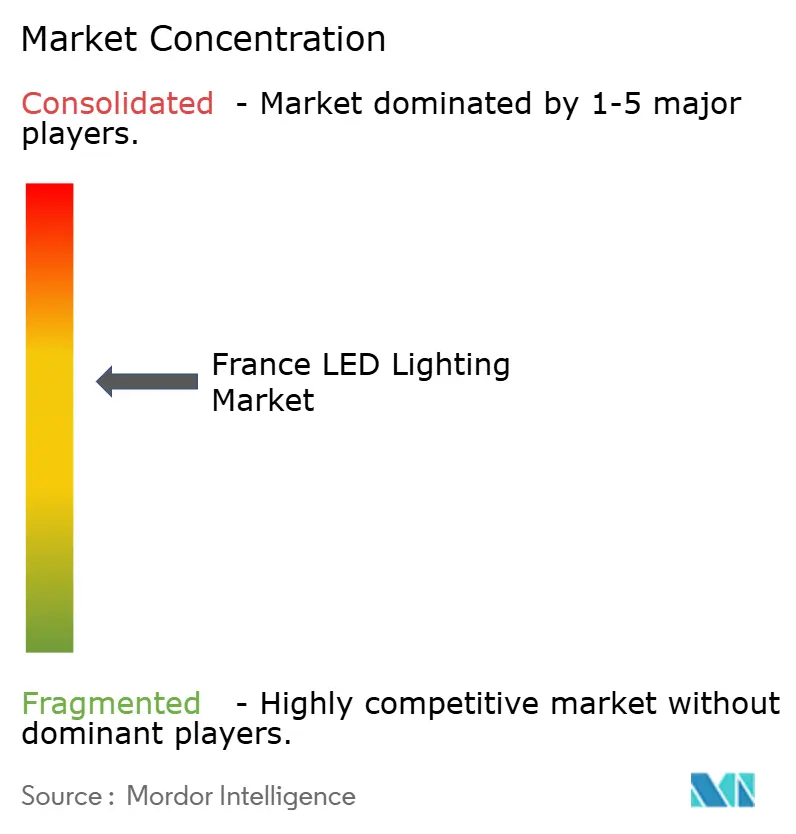
| Market Concentration | Medium |
Major Players *Disclaimer: Major Players sorted in no particular order Image © Mordor Intelligence. Reuse requires attribution under CC BY 4.0. | |
France LED Lighting Market Analysis by Mordor Intelligence
The France LED lighting market size is expected to grow from USD 4.76 billion in 2025 to USD 5.15 billion in 2026 and is forecast to reach USD 7.61 billion by 2031 at 8.12% CAGR over 2026-2031. Energy-transition policies, rising electricity prices, and mandatory eco-design rules collectively anchor the current demand base, while nationwide building renovation subsidies sustain forward momentum. Competitive intensity remains moderate as incumbents pivot toward connected luminaires; however, supply-chain exposure to gallium and indium continues to present procurement risks. Public procurement for smart-city upgrades, the adoption of Matter-enabled controls, and the shift toward circular-economy take-back schemes widen addressable opportunities across residential, commercial, and municipal segments.[1]Gouvernement, “Ce qu'il faut savoir sur le plan sobriété énergétique,” info.gouv.fr
Key Report Takeaways
- By product type, luminaires held 61.48% of the France LED lighting market share in 2025, whereas lamps are forecast to expand at a 10.05% CAGR through 2031.
- By distribution channel, wholesale and retail accounted for 53.68% of the French LED lighting market size in 2025, and e-commerce is projected to post the highest CAGR of 8.35% to 2031.
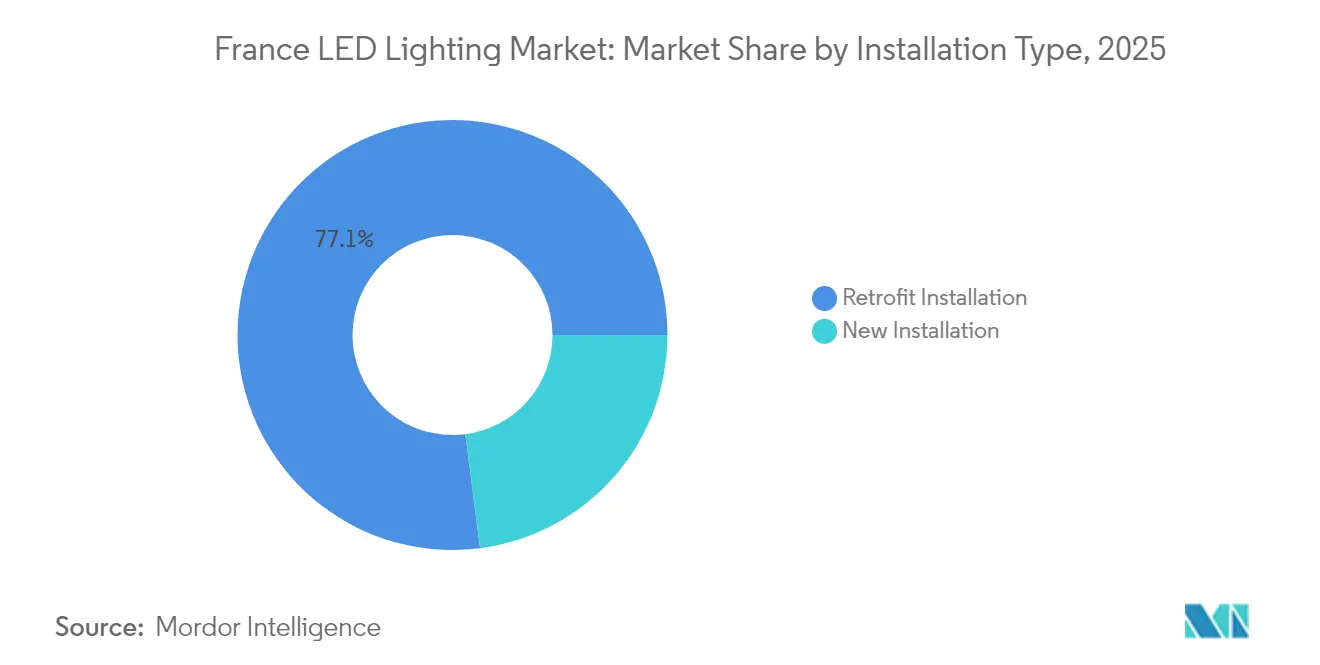
- By installation type, retrofit projects captured a 77.05% share of the French LED lighting market size in 2025, while new installations advanced at a 9.02% CAGR between 2026 and 2031.
- By application, residential usage accounted for 19.22% of the French LED lighting market share in 2025; highway and roadway lighting is expected to grow at a 10.78% CAGR through 2031.
- By end user, indoor settings accounted for 62.12% of the French LED lighting market share in 2025, whereas outdoor projects are expected to rise at a 10.44% CAGR during the forecast period.
Note: Market size and forecast figures in this report are generated using Mordor Intelligence’s proprietary estimation framework, updated with the latest available data and insights as of 2026.
France LED Lighting Market Trends and Insights
Drivers Impact Analysis*
| Driver | (~) % Impact on CAGR Forecast | Geographic Relevance | Impact Timeline |
|---|---|---|---|
| Stringent French and EU-wide energy-efficiency regulations | +2.1% | National, with EU-wide harmonization | Long term (≥ 4 years) |
| Rapid decline in LED component costs and improving luminous efficacy | +1.8% | Global, with a strong impact on France | Medium term (2-4 years) |
| Surge in commercial retrofit projects (offices and retail) | +1.5% | National, concentrated in urban centers | Medium term (2-4 years) |
| Expansion of smart-city public-lighting programs | +1.2% | National, with early adoption in major municipalities | Long term (≥ 4 years) |
| Rising adoption of horticultural LEDs in peri-urban vertical farms | +0.8% | National, concentrated in peri-urban areas | Long term (≥ 4 years) |
| Growing demand for human-centric lighting in healthcare and education | +0.6% | National, institutional focus | Medium term (2-4 years) |
| Source: Mordor Intelligence | |||


Stringent French and EU Energy-Efficiency Regulations
The mandatory adoption of NF C15-100 version 2024, effective from September 2025, embeds energy-sobriety thresholds that effectively exclude legacy lamps and channel demand toward LED fixtures.[2]Apave, “La nouvelle norme NF C15-100 version 2024 est publiée,” apave.com In parallel, Décret Tertiaire compels buildings above 1,000 m² to cut energy use by 40% by 2030, making lighting retrofits a low-friction compliance lever. EU Ecodesign rules have already removed low-efficiency lamps from the market and are expected to increase the average efficacy to 165 lm/W by 2030. Energy-saving certificates (CEE) further sweeten investment cases through standardized incentives that cover interior and exterior luminaires. Together, these measures provide a predictable, multi-year regulatory runway for the France LED lighting market.
Rapid Decline in LED Component Costs and Improving Luminous Efficacy
Global LED exports reached USD 43.3 billion in 2023, reflecting the scaling of manufacturing that compresses component pricing. French R&D advances, such as CEA-Leti’s InGaN quantum-well breakthrough, which enables native RGB emission, promise additional performance gains and cost relief. Horticultural luminaires now aim for 50-60% system efficiency, curbing operational energy that accounts for up to two-thirds of vertical-farm costs. Simultaneously, Matter protocol 1.3 introduces device-level energy monitoring, enabling facility managers to validate payback in real-time. The convergence of falling hardware prices with granular control capability strengthens total-cost-of-ownership (TCO) propositions across segments.
Surge in Commercial Retrofit Projects
Property owners respond to Décret Tertiaire penalties and increased electricity tariffs by accelerating the adoption of LED upgrades. Unibail-Rodamco-Westfield targets a 37% reduction in energy intensity compared to 2015 baselines across its EUR 12.585 billion (USD 13.7 billion) French portfolio, positioning lighting as the first wave of efficiency measures. Legrand reports that clients avoided 9.5 million tons of CO₂ between 2022 and 2023 through its LED-centric solutions, quantifying emissions benefits that complement the payback math. Government stimulus, including EUR 6.2 billion for public‐building refurbishments under France Relance, enlarges the retrofit tender pipeline. The combined regulatory and financial tailwind elevates retrofit volume, sustaining the France LED lighting market through 2030.
Expansion of Smart-City Public-Lighting Programs
Municipalities blend climate goals with citizen-safety mandates via connected lighting. Strasbourg’s phased nighttime switch-off now covers 8,500 luminaires, proving energy cuts up to 40% without measurable security compromise. National mapping shows 62% of surveyed communes have adopted total or partial extinction policies. Deployments such as Signify BrightSites in Chatou combine gigabit backhaul with LED poles, enabling telecom revenue streams that improve project economics. Citizen-triggered apps like Grand-Quevilly’s “J’allume ma rue” illustrate participative models for selective illumination. Energy-performance contracts, exemplified by Niort’s 57% savings, confirm the fiscal logic for large‐scale upgrades.
Restraints Impact Analysis*
| Restraint | (~) % Impact on CAGR Forecast | Geographic Relevance | Impact Timeline |
|---|---|---|---|
| High upfront CAPEX for quality luminaires in price-sensitive segments | -1.4% | National, particularly affecting the SME and residential sectors | Short term (≤ 2 years) |
| Complexities in WEEE recycling and circular-economy compliance | -0.9% | National, with EU-wide regulatory harmonization | Medium term (2-4 years) |
| Proliferation of low-quality imports is affecting buyer confidence | -0.7% | National, concentrated in price-sensitive segments | Short term (≤ 2 years) |
| Supply-chain exposure to critical materials (gallium, indium) | -0.5% | Global, with particular impact on France's manufacturing base | Long term (≥ 4 years) |
| Source: Mordor Intelligence | |||
High Upfront CAPEX for Quality Luminaires
Despite favorable TCO, small enterprises and tenants often hesitate to finance premium luminaires. Antitrust fines totaling EUR 470 million (USD 512.3 million) against Schneider Electric, Rexel, Sonepar, and Legrand revealed distribution practices that may have kept prices artificially elevated. Split incentives in rental housing shift savings to tenants, weakening owners’ investment appetite. Low-quality imports also erode buyer confidence when early failures occur, delaying replacement cycles. Public tenders that prioritize minimal upfront cost further penalize specification-grade products, tempering early-phase adoption momentum within the France LED lighting industry.
Complexities in WEEE Recycling and Circular-Economy Compliance
LED lamps entering waste streams are expected to rise eightfold to approximately 4,000 tons by 2030, but current processing lines struggle to separate diodes, drivers, and optics profitably. As of January 2025, France will ban exports of electronic waste outside OECD countries, prompting upgrades to domestic treatment capacity and increased producer fees. The economic recovery of gallium and rare earths remains marginal at today’s scale, constraining the development of closed-loop business models. Extended Producer Responsibility schemes add administrative burden, particularly for niche brands with limited compliance infrastructure.[3]Barco, “WEEE Compliance France,” barco.com These factors weigh on profitability and could slow product turnover, curbing near-term growth in the France LED lighting market.
*Our forecasts treat driver/restraint impacts as directional, not additive. The impact forecasts reflect baseline growth, mix effects, and variable interactions.
Segment Analysis
By Product Type – Luminaires Drive Market Value Creation
Luminaires captured 61.48% of the French LED lighting market size in 2025, driven by integrated controls, architectural aesthetics, and compliance documentation that simplify audit processes for large projects. Vendors embed Matter or DALI drivers that report energy and occupancy metrics, creating data streams valued by facilities managers seeking real-time dashboards. Smart-city pilots further elevate demand for pole-mounted luminaires capable of hosting sensors and antennas, broadening revenue per installation.
The lamps segment grows at a 10.05% CAGR as incumbent CFL and halogen sockets transition in homes and small offices. The average LED lifespan of 5-7 years triggers a replacement wave from earlier retrofit waves, which began in 2016. Regulatory bans on fluorescent tubes, effective as of September 2025, will also shift procurement toward high-flux LED T8 alternatives, thereby solidifying sustained unit sales. Price erosion accelerates this switch, preserving the France LED lighting market expansion pace across value and premium tiers.


By Distribution Channel – E-commerce Reshapes Procurement
Wholesale retail retained a 53.68% share of the French LED lighting market in 2025, due to entrenched installer relationships and project credit facilities. Branch networks provide just-in-time availability, which is crucial for meeting retrofit deadlines and ensuring timely warranty service. Yet digital transformation pressures wholesalers to develop robust web catalogs, integrate BIM objects, and offer next-day delivery to stay relevant.
E-commerce advances at 8.35% CAGR through 2031 as contractors embrace mobile ordering and homeowners compare SKUs online. Manufacturers like Legrand aim to achieve over 15% of their revenue online in the mid-term, investing in direct-to-site fulfillment capabilities. Transparent pricing and customer ratings erode information asymmetry, encouraging smaller firms to bypass intermediaries. While complex projects still favor distributor support, digital procurement steadily siphons small and mid-ticket orders, reshaping channel margins across the France LED lighting industry.
By Installation Type – Retrofit Commanding but New-Build Rising
Retrofit projects held 77.05% of the France LED lighting market share in 2025 as government incentives and fast paybacks attracted commercial landlords and city councils. Demonstrated savings of 57% in Niort underscore ROI clarity when aging sodium fixtures are replaced. Energy‐performance-contract models shift upfront cost to service providers, reducing capital hurdles for municipalities and schools.
New installations are projected to increase at a 9.02% CAGR, driven by a cyclical rebound in housing starts and stricter building codes that will compel LED in every new dwelling starting in 2025. The France 2030 plan allocates EUR 8 billion to energy assets, with a portion earmarked for industrial site lighting upgrades integrated during the construction phase. Over time, construction momentum will rebalance volume toward new builds, tempering the dominance of retrofit while sustaining aggregate demand in the French LED lighting market.
By Application – Highway Infrastructure Propels Growth
Residential lighting led with a 19.22% share of the French LED lighting market in 2025, reflecting the acceleration of mass-market bulb replacements driven by soaring electricity bills. Consumer preference for warm-tone, dimmable A-class bulbs drives premiumization even within DIY channels. Home-energy-management apps now bundle lighting controls, further normalizing the adoption of connected LED lighting.
Highway and roadway projects are registering the fastest 10.78% CAGR as cities digitize their outdoor grids. Strasbourg’s extinction scheme and Chatou’s BrightSites poles exemplify upgrades that blend safety with telecom franchising. Government-backed infrastructure budgets cover pole-replacement cycles, including the embedding of LED arrays with IoT gateways. The result is robust forward visibility for outdoor vendors, reinforcing expansion of the France LED lighting market across transport corridors.
By End User – Outdoor Investments Accelerate Smart-City Integration
Indoor environments accounted for 62.12% of the France LED lighting market share in 2025, spanning offices, retail, hospitals, and logistics hubs. Human-centric lighting pilots in hospitals aim to enhance patient recovery metrics, while offices deploy tunable-white panels to align with hybrid work patterns. The steady retrofit stream maintains a high indoor baseline volume.
Outdoor projects are projected to grow at a 10.44% CAGR, driven by the combined goals of carbon neutrality and digital service enablement. Municipalities leverage connected streetlights to host environmental sensors, CCTV, and 5G micro-cells, boosting asset monetization. Automotive plants also upgrade their exterior yards to high-mast LEDs that integrate with autonomous-vehicle navigation systems. Consequently, outdoor adoption widens and diversifies, cementing long-term breadth in the France LED lighting market.
Geography Analysis
The Paris region leads in LED penetration due to its dense commercial real estate and early smart-city pilots. Île-de-France municipalities deploy selective dimming and citizen-triggered lighting to balance safety with the Sobriété Énergétique plan. Auvergne-Rhône-Alpes and Occitanie follow, helped by strong industrial clusters and active regional energy-saving grants. Provence-Alpes-Côte-d’Azur’s tourism reliance spurs hospitality upgrades to enhance guest experience while meeting new NF C15-100 requirements.
Rural departments adopt complete nighttime extinction as a cost tactic, illustrating divergent policy mixes across territories. Over 40% of communes in the south-east now practice total shutdown, positioning retrofit demand toward adaptive luminaires capable of stepped dimming. Domestic manufacturing footprints in Limoges and Grenoble shorten supply chains and support regional employment, aligning with France 2030’s industrial-sovereignty objective.
Cross-border opportunities arise as French-made luminaires qualify for EU public procurement sustainability scores, enabling exports to the Benelux and Iberia regions. However, the sourcing risk of gallium and indium, concentrated at 84% in China, remains a strategic vulnerability that regional clusters monitor through dual-sourcing strategies. Overall, geography-specific policy instruments and industrial capabilities together shape demand granularity within the France LED lighting market.
Competitive Landscape
Market concentration is moderate. Signify France, Legrand, and Schneider Electric collectively benefit from broad catalogs, embedded installer networks, and compliance expertise. The 2024 antitrust ruling exposed pricing collusion but also reaffirmed these firms’ scale in distribution. Legrand commits to deriving 80% of its revenue from eco-responsible products by 2030 and applies an internal carbon price of EUR 80 (USD 87) per ton to capital decisions, aligning sustainability targets with its portfolio refresh.
Signify leverages BrightSites to bundle lighting with communications infrastructure, offering municipalities a dual-revenue model that smaller rivals struggle to replicate. Schneider Electric integrates LED systems within EcoStruxure Energy Hub, enabling single-pane monitoring across HVAC, security, and lighting. Niche innovators such as Libu target human-centric lighting, attracting EUR 1 million (USD 1.09 million) seed funding to develop biomimetic spectrums for 24/7 operations.[4]ADI Nouvelle-Aquitaine, “Libu raises €1 M,” adi-na.fr Competitive positioning, therefore, hinges on the depth of the software stack, readiness for the circular economy, and regulatory navigation capacity within the French LED lighting industry.
France LED Lighting Industry Leaders
Signify France (Philips Lighting)
Osram GmbH / LEDvance France
Legrand SA
Schneider Electric SE
Lucibel SA
- *Disclaimer: Major Players sorted in no particular order

Recent Industry Developments
- May 2025: Legrand posted 11.2% Q1 sales growth and 20.7% operating margin, confirming its 6-10% CAGR ambition to 2030 and two acquisitions in the Netherlands and Australia.
- January 2025: Signify announced that CEO Eric Rondolat will depart after April 2025, concluding a tenure during which LED constituted 90% of the product mix.
- October 2024: The French authority levied EUR 470 million (USD 512.3 million) in fines on Schneider Electric, Rexel, Sonepar, and Legrand for coordinated pricing within the electrical distribution sector.
- September 2024: The NF C15-100 version 2024 took effect, with a one-year grace period, embedding mandatory energy-sobriety clauses in new and renovated buildings.


France LED Lighting Market Report Scope
Agricultural Lighting, Commercial, Industrial and Warehouse, Residential are covered as segments by Indoor Lighting. Public Places, Streets and Roadways, Others are covered as segments by Outdoor Lighting. Daytime Running Lights (DRL), Directional Signal Lights, Headlights, Reverse Light, Stop Light, Tail Light, Others are covered as segments by Automotive Utility Lighting. 2 Wheelers, Commercial Vehicles, Passenger Cars are covered as segments by Automotive Vehicle Lighting.| Lamps |
| Luminaires / Fixtures |
| Direct Sales |
| Wholesale Retail |
| E-commerce |
| New Installation |
| Retrofit Installation |
| Commercial Offices |
| Retail Stores |
| Hospitality |
| Industrial |
| Highway and Roadway |
| Architectural |
| Public Places |
| Hospitals |
| Horticulture Gardens |
| Residential |
| Automotive |
| Others (Chemicals, Oil and Gas, Agriculture) |
| Indoor |
| Outdoor |
| Automotive |
| By Product Type | Lamps |
| Luminaires / Fixtures | |
| By Distribution Channel | Direct Sales |
| Wholesale Retail | |
| E-commerce | |
| By Installation Type | New Installation |
| Retrofit Installation | |
| By Application | Commercial Offices |
| Retail Stores | |
| Hospitality | |
| Industrial | |
| Highway and Roadway | |
| Architectural | |
| Public Places | |
| Hospitals | |
| Horticulture Gardens | |
| Residential | |
| Automotive | |
| Others (Chemicals, Oil and Gas, Agriculture) | |
| By End User | Indoor |
| Outdoor | |
| Automotive |


Market Definition
- INDOOR LIGHTING - It incorporates all LED based lamps and fixtures/luminaire that are used to illuminate indoor section of residential, commercial, industrial buildings and agricultural lighting. LED offers efficient brightness with higher durability in comparison to other lighting technology.
- OUTDOOR LIGHTING - It incorporates the LED lighting fixtures that is used for illumination for exterior/outdoor illumination. For instance, LED lighting fixtures used to illuminate streets and highways, transport hubs, stadiums and other public places such as parking spaces.
- AUTOMOTIVE LIGHTING - It refers to the lighting fixtures installed for illumination and signaling purposes. It is used in both exterior and interior lighting of the vehicle. Headlamps, fog lamp, daytime running light (DRLs) are examples of exterior light whereas cabin light are interior lights.
- END USER - It refers to the end use application area where the LED fixture will be installed. For instance, in terms of indoor lighting, we have residential, commercial and industrial as end user category. For automotive lighting, primary end user considered are automotive manufacturers and aftermarket sale
| Keyword | Definition |
|---|---|
| Lumen | Lumen is a unit of luminous flux in the International System of Units that is equal to the amount of light given out through a solid angle by a source of one-candela intensity radiating equally in all directions. |
| Footcandle | A foot-candle (or foot-candle, fc, lm/ft2, or ft-c) is a measurement of light intensity. One foot-candle is defined as enough light to saturate a one-foot square with one lumen of light. |
| Colour Rendering Index (CRI) | Color Rendering Index (CRI) is a measurement of how natural colors render under an artificial white light source when compared with sunlight. The index is measured from 0-100, with a perfect 100 indicating that colors of objects under the light source appear the same as they would under natural sunlight. |
| Luminous flux | Luminous flux is a measure of the power of visible light produced by a light source or light fitting. It is measured in lumens (lm). |
| Annual Energy Cost | Annual Energy Cost means the average daily energy consumption multiplied by 365 (days per year), expressed in kilowatt hour per year (kWh/a). |
| Constant voltage drivers | Constant voltage drivers are designed for a single direct current (DC) output voltage. Most common constant voltage drivers (or Power Supplies) are 12VDC or 24VDC. An LED light that is rated for constant voltage usually specifies the amount of input voltage it needs to operate correctly. |
| Constant Current Driver | Constant current LED drivers are designed for a designated range of output voltages and a fixed output current (mA). LEDs that are rated to operate on a constant current driver require a designated supply of current usually specified in milliamps (mA) or amps (A). These drivers vary the voltage along an electronic circuit which allows current to remain constant throughout the LED system. |
| Minimum Energy Performance Standards (MEPS) | Minimum Energy Performance Standards specify the minimum level of energy performance that appliances and equipment must meet or exceed before they can supply or used for commercial purposes. |
| Luminous Efficacy | Luminous efficacy is a measurement commonly used in the lighting industry that indicates the ability of a light source to emit visible light using a given amount of power. |
| Solid State Lighting | Solid-state lighting (SSL) is a type of lighting that uses semiconductor light-emitting diodes (LEDs), organic light-emitting diodes (OLED), or polymer light-emitting diodes (PLED) as sources of illumination rather than electrical filaments, plasma (used in arc lamps such as fluorescent lamps), or gas. |
| Rated Lamp Life | Lamp life, also referred to as rated life, is the time in hours a lamp will last before a percentage of lamps will burn out. |
| Color Temperature | Colour temperature is a scale that measures how ‘warm’ (yellow) or ‘cool’ (blue) the light from a particular source is. It is measured in degrees of the Kelvin scale (abbreviated to K), and the higher the number, the ‘cooler’ the light. The lower the ‘K’ number, the ‘warmer’ the light. |
| Ingress Protection rating (IP rating) | The IP (Ingress Protection) rating of a bulb or light fixture declares the level of protection it has against dirt and water. |
| Fidelity Index | The general colour fidelity index, Rf, represents how closely the colour appearances of the entire sample set are reproduced (rendered) on average by a test light as compared to those under a reference illuminant. |
| Gamut Index | The gamut area is defined as “the area enclosed by a set of test color samples illuminated by a light source, in a two-dimensional chromaticity diagram or a plane of color space.”1 Within a defined color space, a “gamut” describes the subset of colors that can be perceived under specific lighting conditions. |
| Binning | In the lighting industry, the act of "binning" of LEDs is the process of sorting LEDs by certain characteristics, such as color, voltage, and brightness. |
| Accent lighting | Accent lighting, also called highlighting, emphasizes objects by focusing light directly on them. Accent lighting is used inside and outside the home to feature locations such as an entrance or to create dramatic effects. |
| Dimmable driver | A dimming driver has two functions: As a driver, it converts the 230V AC mains input to a low voltage DC output. As a dimmer, it reduces the amount of electrical energy flowing to the LEDs, thereby causing them to dim. |
| Flicker | Flicker is the repeated and frequent variation in the output of a light source over time. |
| Fluorescent | A property of materials defined as the ability to emit light after absorbing electromagnetic radiation such as visible or UV light. |
| Candela | The candela is the unit of luminous intensity in the International System of Units. It measures the light output per unit solid angle emitted from a light source in a specific direction. |
| LUX | Lux is used to measure the amount of light output in a given area - one lux is equal to one lumen per square meter. It enables us to measure the total "amount" of visible light present and the intensity of the illumination on a surface. |
| Uniformity (U0) | The uniformity of lighting has significant effects on visual performance in both indoor and outdoor areas. Uniformity (represented as U0) value can be found by dividing the minimum brightness (Emin) resulting from calculations according to the current lighting order, to the average brightness value (Eavg). |
| Visible Light Spectrum | The visible light spectrum is the segment of the electromagnetic spectrum that the human eye can view. More simply, this range of wavelengths is called visible light. Typically, the human eye can detect wavelengths from 380 to 700 nanometers. |
| Ambient Temperature | Ambient Temperature is the temperature of the air surrounding an electrical enclosure. |
| Current-controlled dimming control | Current-controlled dimming controls LED brightness by varying the applied current using a 0-10V dimmer. Current-controlled dimming is smooth and HD-video friendly. It can only dim to a minimum of 5% of light output. |
| Design Light Consortium | It is a partnership of energy efficiency stakeholders in the United States and Canada to “promote quality, performance and energy efficient lighting solutions for the commercial sector”. |
| Pulse Width Modulation | Pulse-width modulation, or pulse-duration modulation, is a method of controlling the average power delivered by an electrical signal. |
| Surface Mounted Device | A surface mount device (SMD) is an electronic device whose components are mounted or placed directly on the surface of a printed circuit board. |
| Alternating Current | Alternating current is an electric current which periodically reverses direction and changes its magnitude continuously with time, in contrast to direct current, which flows only in one direction. |
| Direct Current | Direct current (DC) is an electric current that is uni-directional, so the flow of charge is always in the same direction. |
| Beam Angle | Beam angle (also called beam spread) is a measure of how light is distributed. On any plane perpendicular to the centerline of the light, the beam angle is the angle between two rays where the light intensity is 50% of the maximum light intensity. |
| LED Based Solar High Mast Lighting Systems | A Solar LED High Mast Light is a raised source of High illumination lights (6~8 lights) and with high intensity on the middle of major junctions (Ring roads, Outer Ring roads), turned on or lit automatically in the absence of light (at specified timings or at periodic times, every night). |
| Surface Mounted Diode (SMD) LEDs | A surface mount diode is a type that emits light and is flat mounted and soldered onto a circuit board. |
| Chip on Board (COB) LEDs | A COB LED is basically multiple LED chips (usually 9 or more) glued directly onto a substrate by the manufacturer to form a single module. |
| Dual In-Line Package (DIP) LEDs | A dual in-line package (DIP or DIL) is an electronic component package with a rectangular case and two parallel rows of electrical connector pins. |
| Graphene LED Lights | A graphene LED light bulb is simply an LED light bulb where the filament has been coated in graphene. A graphene LED bulb is reported to be 10% more efficient than regular LED light bulbs and they are cheaper to manufacture and buy. |
| LED Corn Bulbs | LED Corn lights are designed as an energy efficient alternative to high intensity discharge (HID) and SON lamps. It uses a large number of LEDs on a metal structure to provide sufficient light. This arrangement of LEDs looks a lot like a corn cob, hence the name "corn light". |
| Per Capita Income | Per capita income or total income measures the average income earned per person in a given area in a specified year. It is calculated by dividing the area's total income by its total population. Per capita income is national income divided by population size. |
| Charging Stations | A charging station, also known as a charging station or electric vehicle utility, is a power supply that provides electrical energy for charging plug-in electric vehicles. |
| Headlight | A headlight is a light that is mounted on the front of a car and illuminates the road in front of it. Low beam and high beam LED headlights are additional categories for these LED headlights. |
| Day Time Running Light (DRLs) | A daytime running lamp is a white, yellow, or amber lighting device mounted on the front of a road-going motor vehicle or bicycle. |
| Directional Signal Light | Directional signal lights are the front and rear lights on an automobile that flash to show the direction of a turn. |
| Stop Light | A red light that is mounted to the back of a car and turns on when the brakes are used to show that the car is stopped. |
| Reverse Light | The reverse light is at the back of the vehicle to indicate its backward motion. |
| Tail Light | A red light that can be seen in the dark is mounted on the rear of a road vehicle. Stop, reverse, and directional signal lights are all part of it. |
| Fog Light | Bright lights in automobiles used to increase visibility on the road in foggy conditions or to warn other drivers of the presence of the vehicle. |
| Passenger Vehicle | A passenger vehicle is a road vehicle, other than a moped or a motorcycle, intended for the transportation of people and designed for up to 8 to 9 seats. |
| Commercial Vehicle | A commercial vehicle (Bus, Truck, Van) is any type of motor vehicle used to transport goods or pay passengers. |
| Two Wheelers (2W) | A two-wheeler is a vehicle that runs on two wheels. |
| Streets & Roadways | Both roads and streets refer to hard, flat surfaces on the ground on which vehicles, people, and animals can travel. Since streetways are usually in cities and towns, they often have houses and buildings on both sides. The roadway is in the countryside and sometimes passes through forests and fields |
| Horticulture Lighting | Horticulture is the science and art of sustainably growing, producing, marketing and using high quality, intensively cultivated food and ornamental plants. |


Research Methodology
Mordor Intelligence has followed the following methodology in all our data center reports.
- Step 1: Raw Data Collection: To understand the market, initially, all crtical data points were identified. Critical information about countries and regions of interest including Per-capita Income, Population, Automotive Production, Interest rate on Auto-Loans, Number of Automobiles on Road, Total LED Import, Lighting Electricity Consumption among others were recorded or estimated based on internal calculations.
- Step 2: Identify Key Variables: To build a robust forecasting model, key variables such as Number of Households, Automotive Production, Road Networks among others were identified. Through an iterative process, the variables required for the market forecast were set, and the model was built using these variables.
- Step 3: Build a Market Model: Based on data and critical industry trend data (variables), including LED pricing, LED penetration rate, and project macro and micor economic factors were utilized for building the market forecasting.
- Step 4: Validate and Finalize: In this crucial step, all market numbers and variables derived through an internal mathematical model were validated through an extensive network of primary research experts from all the markets studied. The respondents are selected across levels and functions to generate a holistic picture of the market studied.
- Step 5: Research Outputs: Syndicated Reports, Custom Consulting Assignments, Databases & Subscription Platforms


