
Fluorescence Cell Market Size and Share
Market Overview
| Study Period | 2020 - 2031 |
|---|---|
| Market Size (2026) | USD 2.29 Billion |
| Market Size (2031) | USD 3.14 Billion |
| Growth Rate (2026 - 2031) | 6.54 % |
| Fastest Growing Market | Asia-Pacific |
| Largest Market | Asia-Pacific |
| Market Concentration | Medium |
Major Players *Disclaimer: Major Players sorted in no particular order Image © Mordor Intelligence. Reuse requires attribution under CC BY 4.0. | |
Fluorescence Cell Market Analysis by Mordor Intelligence
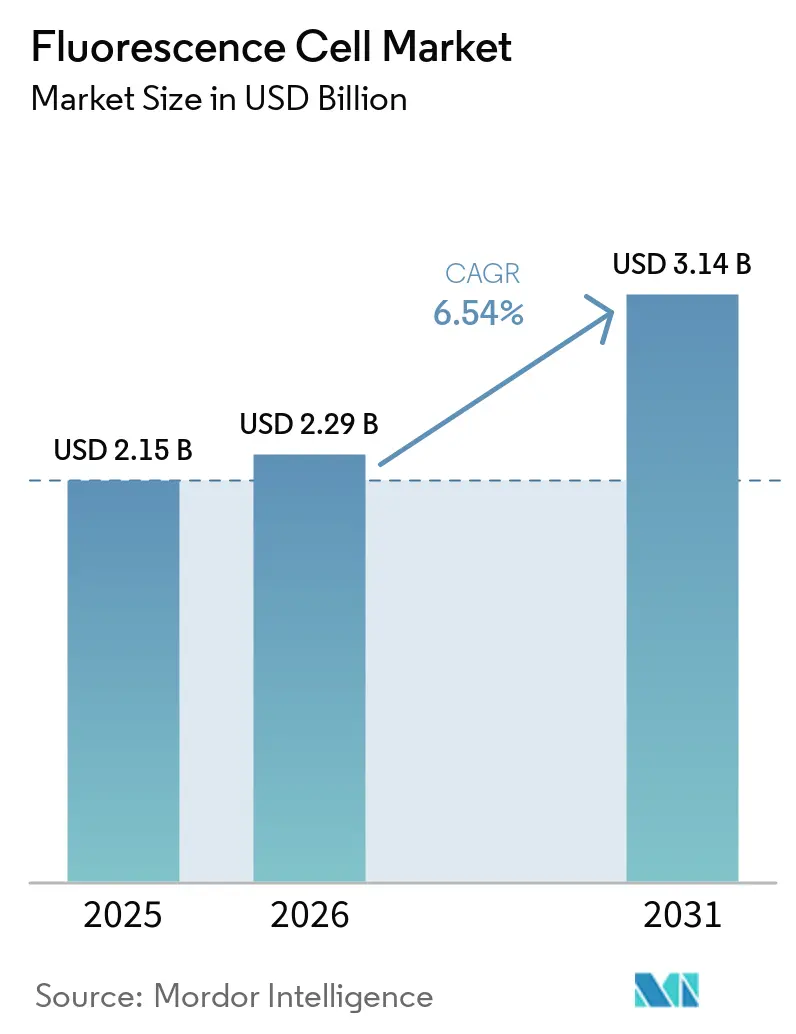
The Fluorescence Cell Market size is expected to increase from USD 2.15 billion in 2025 to USD 2.29 billion in 2026 and reach USD 3.14 billion by 2031, growing at a CAGR of 6.54% over 2026-2031.
The fluorescence cells market is transitioning from single-parameter brightfield workflows to advanced solutions that enable the simultaneous evaluation of multiple cellular features. Demand includes microscopes, fluorescence-activated cell sorters, imaging systems, probes, dyes, and consumables that support an expanding installed base. Research institutions, pharmaceutical developers, and clinical laboratories increasingly require solutions that facilitate cell characterization, screening, and quantitative analysis. Companies are addressing these requirements by integrating instruments with software, automation, reagents, and service offerings. However, capital constraints and signal-quality limitations continue to affect purchasing decisions, particularly in regions with limited public funding and technical expertise.
Key Report Takeaways
- By product type, fluorescence microscopes held 37.54% of the fluorescence cells market share in 2025, while accessories and consumables are forecast to grow at an 8.65% CAGR through 2031.
- By technology, fluorescence lifetime imaging microscopy held 31.65% of 2025 revenue, while super-resolution microscopy is forecast to grow at a 7.84% CAGR through 2031.
- By application, cell biology held 43.76% of 2025 revenue, while pharmaceutical research is forecast to grow at an 8.49% CAGR through 2031.
- By end user, academic and research institutes held 44.76% of 2025 revenue, while pharmaceutical and biotechnology companies are forecast to grow at a 9.32% CAGR through 2031.
- By geography, North America held 41.65% of 2025 revenue, while Asia-Pacific is forecast to grow at a 7.65% CAGR through 2031.
Note: Market size and forecast figures in this report are generated using Mordor Intelligence’s proprietary estimation framework, updated with the latest available data and insights as of January 2026.
Global Fluorescence Cell Market Trends and Insights
Drivers Impact Analysis*
| Driver | (~) % Impact on CAGR Forecast | Geographic Relevance | Impact Timeline |
|---|---|---|---|
| Biomedical Research and Diagnostic Adoption | +1.70% | Global | Medium term (2-4 years) |
| Oncology, Infectious-Disease and Immunology Workflows | +1.30% | North America and Europe, with emerging Asia-Pacific spillover | Short term (≤ 2 years) |
| High-Content Screening and Cell-Based Drug Discovery | +1.00% | North America and Europe | Medium term (2-4 years) |
| Multiplexed Spectral and Spatial Cell Analysis | +0.70% | Global | Long term (≥ 4 years) |
| AI-Enabled Image Analysis and Laboratory Automation | +0.90% | Global | Medium term (2-4 years) |
| Cell and Gene Therapy Characterization | +0.60% | North America, Europe, and core Asia-Pacific markets | Long term (≥ 4 years) |
| Source: Mordor Intelligence | |||
Biomedical Research and Diagnostic Adoption: Instrumentation Grants Sustain Capital Procurement
Biomedical research continues to drive purchases in the fluorescence cells market through shared facilities and equipment grants. In July 2026, the University of Texas at Austin is expected to receive a National Institutes of Health (NIH) S10 award for a ZEISS Lightsheet 7 microscope. The system is expected to be the first light-sheet microscope in the Austin region, supporting 17 research teams and 29 NIH-sponsored projects. Shared procurement models enable multiple laboratories to access advanced instruments that may be difficult for individual laboratories to fund independently. Although clinical adoption is progressing at a slower pace, clinical certification and quality requirements can benefit established suppliers with validated systems.
High-Content Screening and Cell-Based Drug Discovery: 3D Models Reset the Assay Standard
High-content fluorescence imaging is increasingly being applied to 3D tumor spheroids, organoids, and organ-on-chip models. Compared with conventional 2D cell cultures, these models require more sophisticated imaging capabilities. A 2025 Nature Communications study is expected to report that the HCS-3DX platform delivers single-cell resolution in coculture tumor models and demonstrates how AI-guided 3D screening can improve the consistency of high-content screening. These workflows require specialized plates, reagents, and microfluidic chambers in addition to imaging instruments. Consequently, consumables and software are becoming increasingly important in the fluorescence cells Market[1]Fadi Elsadek et al., “HCS-3DX, a Next-Generation AI-Driven Automated 3D-oid High-Content Screening System,” Nature Communications.
Oncology, Infectious-Disease and Immunology Workflows: Multi-Disease Burden Expands the Addressable Base
Oncology research requires laboratories to assess tumor-immune interactions, pathway activity, and spatial variation within tissues, supporting the adoption of multi-marker fluorescence workflows. Cell and gene therapy manufacturing also requires identity, purity, potency, and safety testing at Good Manufacturing Practice (GMP) scale. This requirement is driving demand for instruments and analytical methods that can operate in controlled production environments. In addition, infectious disease serology and immune monitoring are increasing the demand for broader cytokine and surface-marker panels. As panel complexity increases, spectral coverage, panel design, and reliable data interpretation become critical considerations in the fluorescence cells market.
AI-Enabled Image Analysis and Laboratory Automation: The Operator Bottleneck Is Being Structurally Resolved
AI-supported analysis and laboratory automation are reshaping fluorescence imaging workflows. Automated high-content screening platforms can reduce hands-on time by 50–70%, allowing laboratories to manage complex assays with fewer trained personnel. In April 2026, Carl Zeiss AG and EDGE Biotechnologies are expected to announce a collaboration focused on AI-accelerated bioimaging and quantitative biology for biopharmaceutical research and development. A 2025 Nature Photonics study is expected to demonstrate eight-channel camera-based acquisition and the simultaneous imaging of up to seven spectrally distinct fluorophore species on a standard confocal platform. These capabilities can reduce the hardware complexity associated with multiplexed experiments, making spectral and spatial analysis more accessible to mid-sized laboratories[2]Carl Zeiss AG, “ZEISS and EDGE Leverage AI To Transform Bioimaging in the Biopharma Industry,” ZEISS Newsroom.
Restraints Impact Analysis*
| Restraint | (~) % Impact on CAGR Forecast | Geographic Relevance | Impact Timeline |
|---|---|---|---|
| High Capital and Lifecycle Cost | -1.50% | Global, most acute in South America and the Middle East and Africa | Medium term (2-4 years) |
| Photobleaching, Phototoxicity and Autofluorescence | -0.80% | Global | Medium term (2-4 years) |
| Skilled-Operator and Quantitative-Analysis Gap | -0.60% | Emerging Asia-Pacific markets and South America | Long term (≥ 4 years) |
| Reproducibility, Interoperability and Clinical-Validation Burden | -0.50% | Global, with particular importance in clinical settings | Long term (≥ 4 years) |
| Source: Mordor Intelligence | |||
High Capital and Lifecycle Cost: Access Asymmetry Shapes Market Geography
High-end fluorescence systems typically cost between USD 200,000 and more than USD 1 million. In addition, service agreements, laser replacements, and reagent expenses can add 10%-20% of the list price annually. Consequently, total ownership costs over a five-year period can significantly exceed the initial capital investment. This cost burden is particularly pronounced in South America, the Middle East, and Africa, where research budgets may not accommodate high-cost instruments. Shared-use facilities and instrument-as-a-service models can help expand access beyond major research centers. However, the need for trained operators, reproducible methodologies, and clinical validation further increases implementation costs and may constrain adoption in the fluorescence cells market.
Photobleaching, Phototoxicity and Autofluorescence: Illumination Intensity Limits Live-Cell and Tissue Workflows
Photobleaching, phototoxicity, and tissue autofluorescence continue to present significant challenges for live-cell and thick-tissue imaging workflows. A 2025 study found that reactive oxygen species generated during fluorophore excitation contribute to both phototoxicity and photobleaching. These effects are more pronounced in super-resolution imaging approaches, which require higher illumination intensities. A Journal of Pain study reported that lipofuscin can occupy up to 80% of neuronal cytoplasm in dorsal root ganglion sections, interfering with marker detection in 45% of neurons. In addition, a 2025 Scientific Reports study found that fluorescence lifetime imaging microscopy differentiated autofluorescence more consistently than photobleaching and hyperspectral approaches across multiple tissue types. These limitations reinforce the continued importance of fluorescence lifetime imaging microscopy in the fluorescence cells market.
*Our forecasts treat driver/restraint impacts as directional, not additive. The impact forecasts reflect baseline growth, mix effects, and variable interactions.
Segment Analysis
By Product Type: Installed Base Supports Recurring Consumable Demand
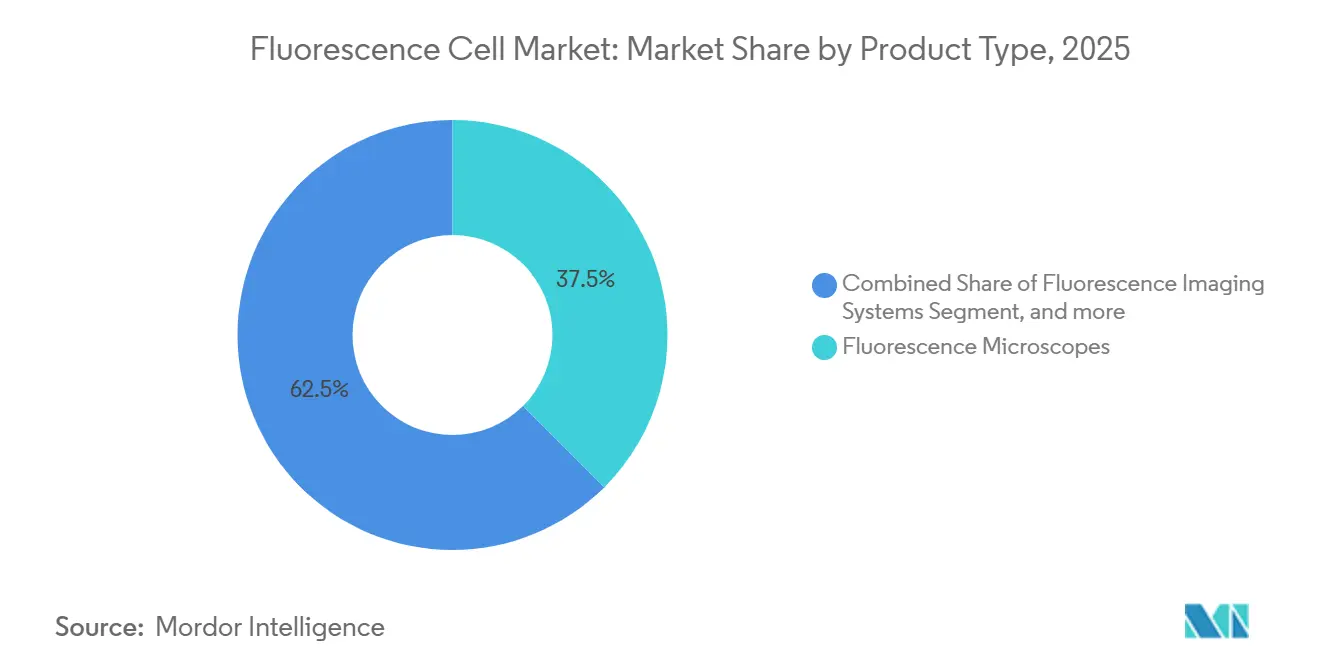
Fluorescence microscopes are projected to account for 37.5% of the fluorescence cells market revenue in 2025. Academic laboratories, pharmaceutical preclinical facilities, and hospital pathology departments widely use these instruments. Their leading position reflects a well-established installed base and broad applicability across cell biology, oncology, and neuroscience research. Product offerings range from entry-level benchtop instruments to confocal and super-resolution systems, allowing suppliers to address laboratories with varying technical requirements and capital budgets.
Fluorescence-activated cell sorters remain a high-value product category in the fluorescence cells market, particularly as cell therapy manufacturing increasingly requires controlled sorting and quality-control workflows. Fluorescence imaging systems also play an important role in spatial biology and drug discovery programs. In addition, probes and dyes generate recurring purchases across these instrument categories.
Accessories and consumables are forecast to grow at a CAGR of 8.6% through 2031, making them the fastest-growing product group in the fluorescence cells market. Growth is supported by the expanding installed base, as complex experiments require recurring purchases of reagents, plates, and related supplies. Automated imaging systems further integrate imaging stages, incubation, liquid handling, and analysis tools, creating continued demand for compatible reagents and software.
Thermo Fisher Scientific launched the Invitrogen EVOS S1000 Spatial Imaging System in February 2025. The system is designed to capture up to nine fluorescent targets simultaneously while supporting broad reagent compatibility. This capability links capital equipment sales with ongoing reagent demand. Suppliers can leverage compatible consumables to establish recurring revenue streams after the initial system sale.



By Technology: FLIM Leads While Super-Resolution Expands
Fluorescence lifetime imaging microscopy (FLIM) is projected to hold 31.7% of market revenue in 2025. Its market position reflects its analytical depth and ability to distinguish autofluorescence from probe signals without chemical pretreatment. This capability is valuable in tissue samples where endogenous signals can interfere with conventional intensity-based methods. Confocal microscopy remains widely adopted due to its optical sectioning, multichannel detection, and established protocols.
Multispectral imaging is gaining traction as AI-based unmixing improves spectral separation in the fluorescence cells market. Quantum dots also remain relevant for long-duration live-cell experiments due to their photostability. Together, these technologies address distinct requirements for resolution, throughput, and signal quality. As a result, the fluorescence cells market comprises multiple technology pathways rather than a single replacement cycle.
Super-resolution microscopy is forecast to grow at a CAGR of 7.8% through 2031. STED, STORM, and PALM technologies have progressed beyond specialist physics laboratories and are now available through commercial platforms. A 2025 Nature Biotechnology study evaluated CombPlex, which reconstructed 22-protein imaging panels from five imaging channels using combinatorial staining and deep learning. The approach increased the information density available from each experiment and demonstrated the potential of advanced imaging to support multiplexed biological analysis.
Carl Zeiss Microscopy is expected to receive a U.S. patent in July 2026 for a broadband-excitation fluorescence microscope. The patent indicates continued proprietary development across clinical and research imaging applications. However, super-resolution systems continue to face phototoxicity and photobleaching challenges in demanding live-cell applications.
By Application: Pharmaceutical Research Advances Beyond the Cell Biology Core
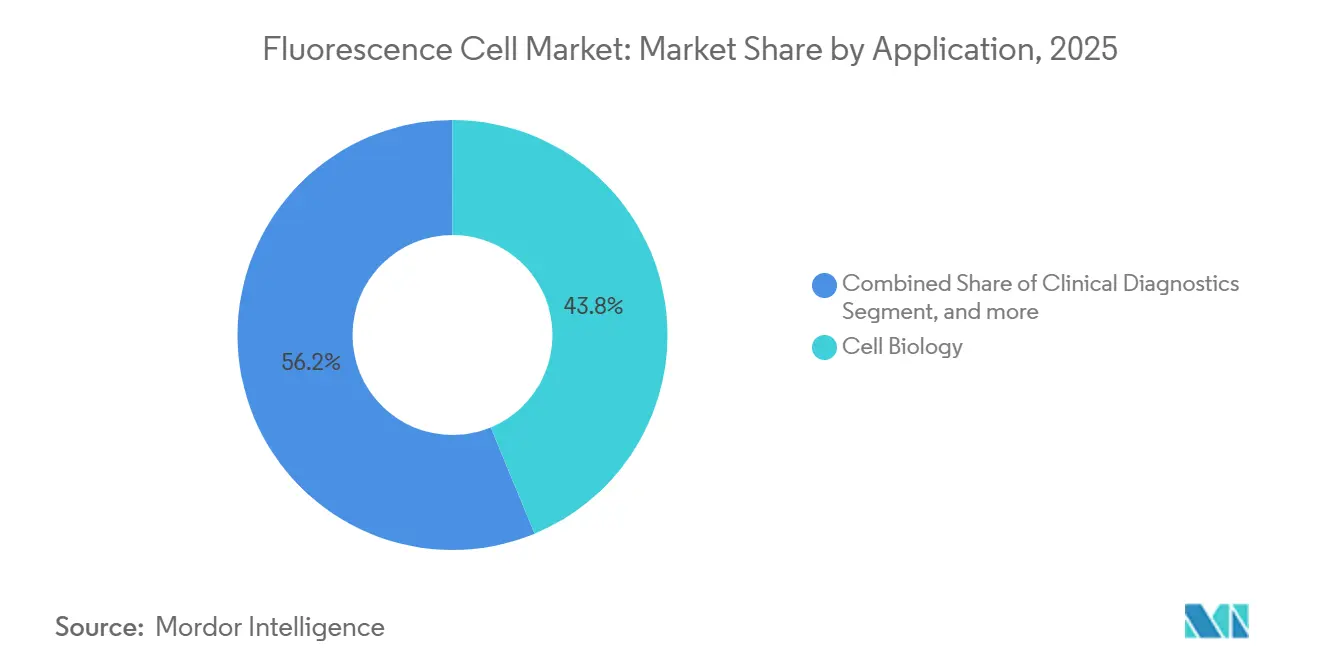
Cell biology is projected to account for 43.8% of application revenue in 2025. Its continued relevance stems from its central role in research involving organelle dynamics, protein interactions, apoptosis, and cell-cycle progression. This broad range of use cases positions cell biology as a core application area in the fluorescence cells market. Although clinical diagnostics represents a smaller market share, it remains strategically important. Fluorescence immunophenotyping is well established for hematology and immunodeficiency diagnostics, while spatial fluorescence pathology for solid tumors continues to progress through clinical validation. Materials science, environmental sensing, and forensic applications further contribute to demand, expanding the customer base beyond biological research laboratories.
Pharmaceutical research is forecast to grow at a CAGR of 8.5% through 2031, the highest among all application segments. Drug developers are increasingly adopting fluorescence-based phenotypic screening to generate spatial and multiparameter readouts across large compound libraries. The Endo-GeneScreen platform, reported in Nature Communications in 2025, combines endogenous protein detection, laboratory automation, and commercially available libraries. It enables genome-scale fluorescence high-throughput screening while preserving native cellular contexts. These capabilities allow researchers to evaluate drug effects with greater physiological relevance. Pharmaceutical development programs are also increasingly using 3D cell culture and organoid models, which require sensitive imaging and reproducible quantitative analysis. Consequently, pharmaceutical research is expected to generate incremental demand for fluorescence instruments and consumables.
By End User: Pharmaceutical and Biotechnology Companies Drive Buyer Mix Changes
Academic and research institutes are projected to account for 44.8% of end-user revenue in 2025. Public funding, equipment grants, and the requirement for high-performance imaging in published research support their leading position. Shared core facilities allow multiple users to access systems acquired through a single capital investment. These facilities also create recurring demand for services and consumables after installation. Additionally, academic facilities help standardize methods that commercial laboratories may subsequently adopt. Hospitals and diagnostic laboratories currently represent a smaller share of demand; however, their contribution may increase as clinical fluorescence imaging receives broader regulatory acceptance. Nevertheless, academic institutions are expected to remain the largest end-user segment in the fluorescence cells market.
Pharmaceutical and biotechnology companies are forecast to expand at a CAGR of 9.3% through 2031. Growth is driven by the increasing use of fluorescence-based characterization in Good Manufacturing Practice (GMP) drug development workflows. Cell and gene therapy manufacturers require assays to assess identity, purity, potency, and adventitious agents. Compared with traditional research buyers, these customers may require higher-value instruments and longer-term service agreements. In January 2025, Sartorius launched the Incucyte CX3 Live-Cell Analysis System, which combines confocal fluorescence imaging with capacity for up to six 96-well plates simultaneously. The company developed the system for 3D cell culture and live-cell kinetic assays in drug discovery and development. This product profile aligns with pharmaceutical companies' requirements for high-throughput, walk-away workflows.
Geography Analysis
North America is projected to account for a 41.7% share of the fluorescence cells market in 2025. The region benefits from a strong concentration of academic medical centers, National Institutes of Health (NIH)-funded research infrastructure, and commercial biopharmaceutical activity. Federal instrumentation grants and academic hospital capital budgets support system procurement, while instrument-as-a-service models enable laboratories to upgrade installed equipment. Close collaboration between suppliers, reagent providers, and major research clusters further strengthens the regional ecosystem. These factors support demand for imaging, sorting, analysis software, and consumables. Canada’s genomics and precision medicine networks also contribute to demand in the fluorescence cells market. [Source: NIH.gov]
Europe has a well-balanced demand base across academic research, clinical diagnostics, and pharmaceutical applications. Germany, the United Kingdom, France, and the Netherlands represent the most active national markets in the analysis. Multi-year research consortia facilitate coordinated equipment upgrades across university networks. Carl Zeiss AG is expected to introduce the Axioscan 7 Clinical in July 2026 for routine clinical diagnostic settings. The system will support transmitted-light, brightfield, and fluorescence modalities, with multiple magnification and z-stacking options. This development underscores the growing importance of validated clinical workflows in Europe. Sartorius is also targeting cell therapy manufacturing through its Eveo Cell Therapy Platform. Consequently, Europe combines sustained research demand with increasing requirements for analysis in regulated production environments.
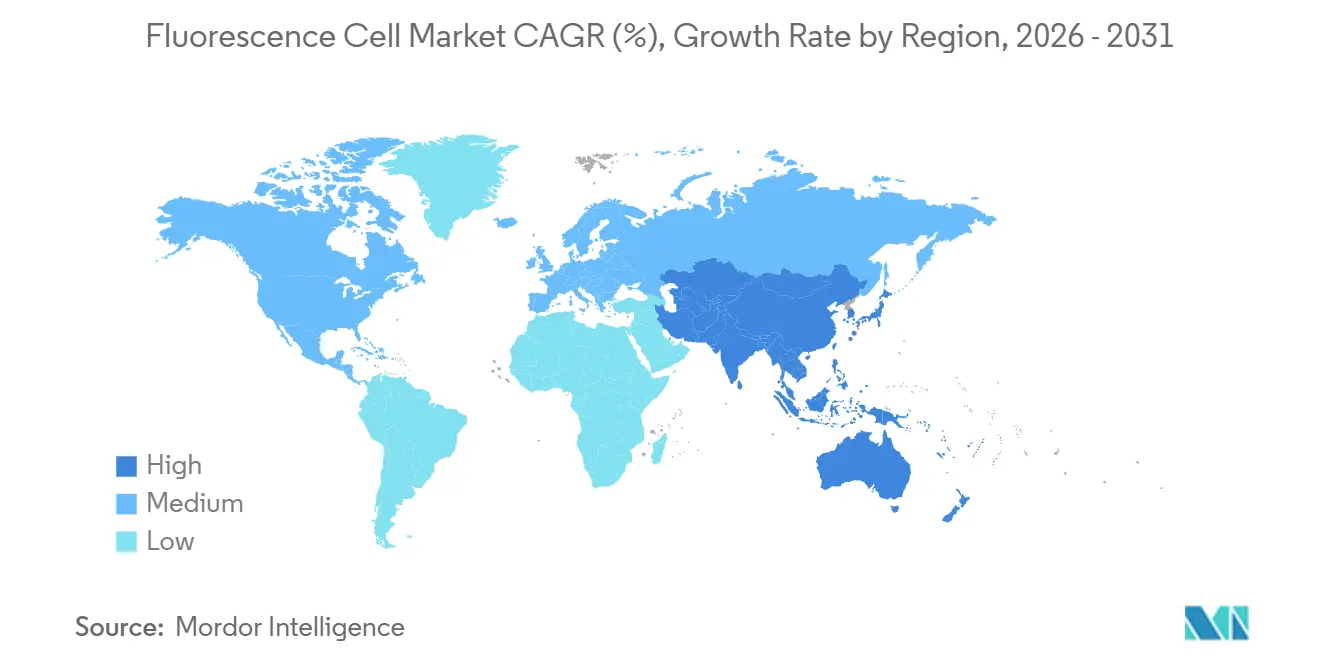
Asia-Pacific is forecast to grow at a CAGR of 7.7% through 2031, making it the fastest-growing region in the fluorescence cells market. China’s state-supported biomedical research infrastructure and genomics programs support purchases by academic hospitals and contract research organizations. In India, pharmaceutical manufacturing and contract research activities drive demand for identity and purity testing tools. Japan contributes significant precision optics capabilities through Hamamatsu Photonics, Nikon, Olympus, and Shimadzu. Japanese universities also deploy advanced platforms for regenerative medicine and materials science research. South America and the Middle East and Africa remain at earlier stages of adoption. Brazil and Gulf Cooperation Council research centers serve as the key demand anchors; however, infrastructure gaps and import dependence continue to limit the pace of procurement.

Competitive Landscape
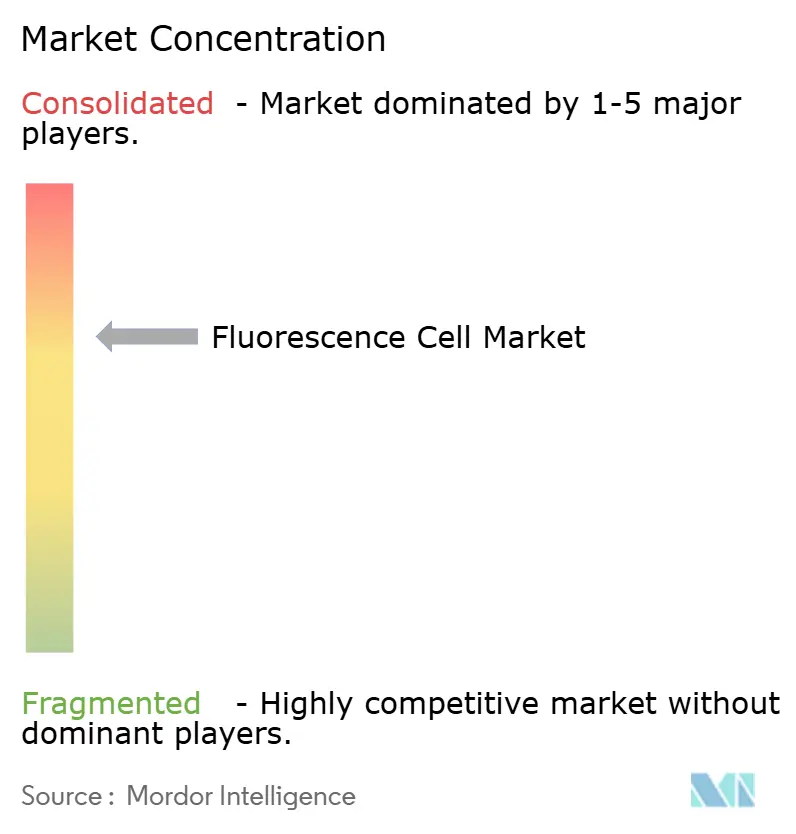
The fluorescence cells market exhibits moderate-to-high concentration among leading instrument and reagent suppliers. Thermo Fisher Scientific, Danaher Corporation, through Leica Microsystems and Beckman Coulter, and Becton, Dickinson and Company lead broad product ecosystems. These companies compete by providing integrated workflows that span sample preparation, imaging, sorting, and data analysis. Their established service networks and regulatory documentation provide a competitive advantage, particularly for large laboratories. Cytek Biosciences, Bruker Corporation, and Revvity differentiate their offerings through specialized capabilities in full-spectrum cytometry, spatial multi-omics, and high-content screening. Competition in the fluorescence cells market therefore depends on both the breadth of a supplier’s workflow and the depth of its specialized technology. The market also includes smaller suppliers of optical cells and calibration components.
Cytek is expected to introduce the Aurora Evo full-spectrum flow cytometer in May 2025. According to the company, the system will deliver two-times-faster sample acquisition, integrated small-particle detection, and automated plate loading. The launch will expand the Aurora platform’s capabilities for high-throughput and automation-focused applications. In April 2026, Bruker Spatial Biology is expected to present integrated GeoMx DSP, CellScape XR, and CosMx SMI workflows. The company also plans to introduce 208-plex subcellular proteomics datasets from CellScape XR. These developments illustrate how spatial multi-omics is emerging as a competitive area beyond traditional flow cytometry and microscopy. Companies are increasingly integrating instruments with data interpretation capabilities and end-to-end workflow solutions.
Carl Zeiss AG and EDGE Biotechnologies are expected to establish a collaboration in April 2026 to advance AI-accelerated bioimaging for biopharmaceutical research and development. The collaboration will focus on converting imaging outputs into quantitative biology workflows, highlighting the increasing role of analysis software within product offerings. Thermo Fisher Scientific’s planned February 2025 launch of the EVOS S1000 will similarly link spatial imaging with compatible reagent ecosystems. Hellma GmbH and Starna Scientific operate in a distinct niche, supplying precision optical cells and quartz cuvettes for fluorescence spectroscopy calibration and dye characterization. Their products support the reagent and probe segment of the fluorescence cells market.
Fluorescence Cell Industry Leaders
Thermo Fisher Scientific Inc.
Danaher Corporation
Becton, Dickinson and Company
Bio-Rad Laboratories, Inc.
PerkinElmer Inc.
- *Disclaimer: Major Players sorted in no particular order

Recent Industry Developments
- April 2026: Bruker Spatial Biology debuted cross-platform workflows linking GeoMx DSP, CellScape XR, and CosMx SMI at AACR 2026, alongside new 208-plex subcellular proteomics datasets from CellScape XR, enabling multi-modal spatial biology integration for quantitative oncology phenotyping.
- April 2026: Carl Zeiss AG and EDGE Biotechnologies (Denmark) announced a collaboration to integrate AI-accelerated bioimaging and quantitative biology workflows for biopharma R&D, with EDGE converting fluorescence imaging outputs into decision-enabling data across drug development programs.
- February 2026: Revvity launched the Opera Phenix OptIQ high-content screening system at SLAS2026, delivering a peak camera quantum efficiency of 95% versus 60% previously, purpose-built for 3D organoid, live-cell, and organ-on-chip fluorescence imaging in advanced drug discovery workflows.
- January 2026: BD commercially launched BD Research Cloud 7.0, featuring the AI-powered BD Horizon Panel Maker that automates flow cytometry panel design to reduce experimental errors, wasted samples, and irreproducible data across immunology and cancer research workflows.


Global Fluorescence Cell Market Report Scope
According to the report’s scope, a fluorescence cell refers to a cell that has been labeled with fluorescent dyes or proteins, allowing it to emit light when exposed to specific wavelengths. It is commonly used in microscopy to study cell structure and function.
The fluorescence cell market is segmented into product type, technology, application, end user, and geography. By product type, the market is segmented into fluorescence microscopes, fluorescence-activated cell sorters (FACS), fluorescence imaging systems, fluorescent probes and dyes, and accessories and consumables. By technology, the market is segmented into super-resolution microscopy, fluorescence lifetime imaging microscopy (FLIM), Confocal microscopy, multispectral imaging, quantum dot technology, and other technologies. By application, the market is segmented into cell biology, clinical diagnostics, pharmaceutical research, and other applications. By end user, the market is segmented into academic and research institutes, pharmaceutical and biotechnology companies, hospitals and diagnostic laboratories, and other end users. By geography, the market is segmented into North America, Europe, Asia-Pacific, the Middle East and Africa, and South America. The report also covers the estimated market sizes and trends for 17 countries across major regions globally. The report offers values (USD) for all the above segments.
| Fluorescence Microscopes |
| Fluorescence Activated Cell Sorters (FACS) |
| Fluorescence Imaging Systems |
| Fluorescent Probes and Dyes |
| Accessories and Consumables |
| Super-Resolution Microscopy |
| Fluorescence Lifetime Imaging Microscopy (FLIM) |
| Confocal Microscopy |
| Multispectral Imaging |
| Quantum Dot Technology |
| Other Technologies |
| Cell Biology |
| Clinical Diagnostics |
| Pharmaceutical Research |
| Other Applications |
| Academic and Research Institutes |
| Pharmaceutical and Biotechnology Companies |
| Hospitals and Diagnostic Laboratories |
| Other End Users |
| North America | United States |
| Canada | |
| Mexico | |
| Europe | Germany |
| United Kingdom | |
| France | |
| Italy | |
| Spain | |
| Rest of Europe | |
| Asia-Pacific | China |
| Japan | |
| India | |
| Australia | |
| South Korea | |
| Rest of Asia-Pacific | |
| Middle East and Africa | GCC |
| South Africa | |
| Rest of Middle East and Africa | |
| South America | Brazil |
| Argentina | |
| Rest of South America |
| By Product Type | Fluorescence Microscopes | |
| Fluorescence Activated Cell Sorters (FACS) | ||
| Fluorescence Imaging Systems | ||
| Fluorescent Probes and Dyes | ||
| Accessories and Consumables | ||
| By Technology | Super-Resolution Microscopy | |
| Fluorescence Lifetime Imaging Microscopy (FLIM) | ||
| Confocal Microscopy | ||
| Multispectral Imaging | ||
| Quantum Dot Technology | ||
| Other Technologies | ||
| By Application | Cell Biology | |
| Clinical Diagnostics | ||
| Pharmaceutical Research | ||
| Other Applications | ||
| By End User | Academic and Research Institutes | |
| Pharmaceutical and Biotechnology Companies | ||
| Hospitals and Diagnostic Laboratories | ||
| Other End Users | ||
| Geography | North America | United States |
| Canada | ||
| Mexico | ||
| Europe | Germany | |
| United Kingdom | ||
| France | ||
| Italy | ||
| Spain | ||
| Rest of Europe | ||
| Asia-Pacific | China | |
| Japan | ||
| India | ||
| Australia | ||
| South Korea | ||
| Rest of Asia-Pacific | ||
| Middle East and Africa | GCC | |
| South Africa | ||
| Rest of Middle East and Africa | ||
| South America | Brazil | |
| Argentina | ||
| Rest of South America | ||


Key Questions Answered in the Report
What is the forecast for fluorescence cells through 2031?
The Fluorescence cells market is expected to reach USD 3.14 billion by 2031 from USD 2.29 billion in 2026, at a 6.5% CAGR. This outlook reflects growing use of multiplexed cell analysis in research, pharmaceutical development, and laboratory workflows that need detailed cellular information for screening, characterization, and imaging.
Which product type has the largest revenue share?
Fluorescence microscopes led product revenue with 37.5% in 2025, supported by use across research, pharmaceutical, and pathology settings. Accessories and consumables are projected to be the fastest-growing product group at an 8.6% CAGR because installed instruments require compatible dyes, probes, plates, and supplies for repeated experimental work.
Which technology is growing fastest?
Super-resolution microscopy is forecast to expand at a 7.8% CAGR through 2031 because it supports detailed, high-information imaging applications. Fluorescence lifetime imaging microscopy was the largest technology group with a 31.7% share in 2025 and can distinguish probe signals from difficult tissue autofluorescence in complex samples.
Why are pharmaceutical users increasing their fluorescence purchases?
Pharmaceutical research is forecast to grow at an 8.5% CAGR, supported by phenotypic screening, organoid models, and quantitative cell analysis. Pharmaceutical and biotechnology companies are projected to grow at a 9.3% CAGR as controlled testing needs increase across drug development, cell therapy, manufacturing, purity assessment, and potency testing workflows.
Which region is expanding most quickly?
Asia-Pacific is forecast to grow at a 7.7% CAGR through 2031, supported by biomedical research and pharmaceutical activity in China and India. North America remained the largest region with 41.7% share in 2025 because of its research infrastructure, grant programs, biopharmaceutical base, established equipment procurement channels, and linked supplier networks.
What limits wider adoption of fluorescence cell analysis?
High capital and lifecycle costs, photobleaching, phototoxicity, autofluorescence, operator needs, and validation demands can slow adoption. Shared facilities, laboratory automation, software-supported analysis, compatible service arrangements, and established laboratory protocols can help laboratories manage access barriers, technical constraints, and complex workflow requirements across many laboratory settings with difficult samples.
Page last updated on:





