
Flue Gas Desulfurization (FGD) Market Size and Share
Market Overview
| Study Period | 2021 - 2031 |
|---|---|
| Market Size (2026) | USD 27.61 Billion |
| Market Size (2031) | USD 37.03 Billion |
| Growth Rate (2026 - 2031) | 6.05 % |
| Fastest Growing Market | Asia Pacific |
| Largest Market | Asia Pacific |
| Market Concentration | Medium |
Major Players *Disclaimer: Major Players sorted in no particular order Image © Mordor Intelligence. Reuse requires attribution under CC BY 4.0. | |
Flue Gas Desulfurization (FGD) Market Analysis by Mordor Intelligence
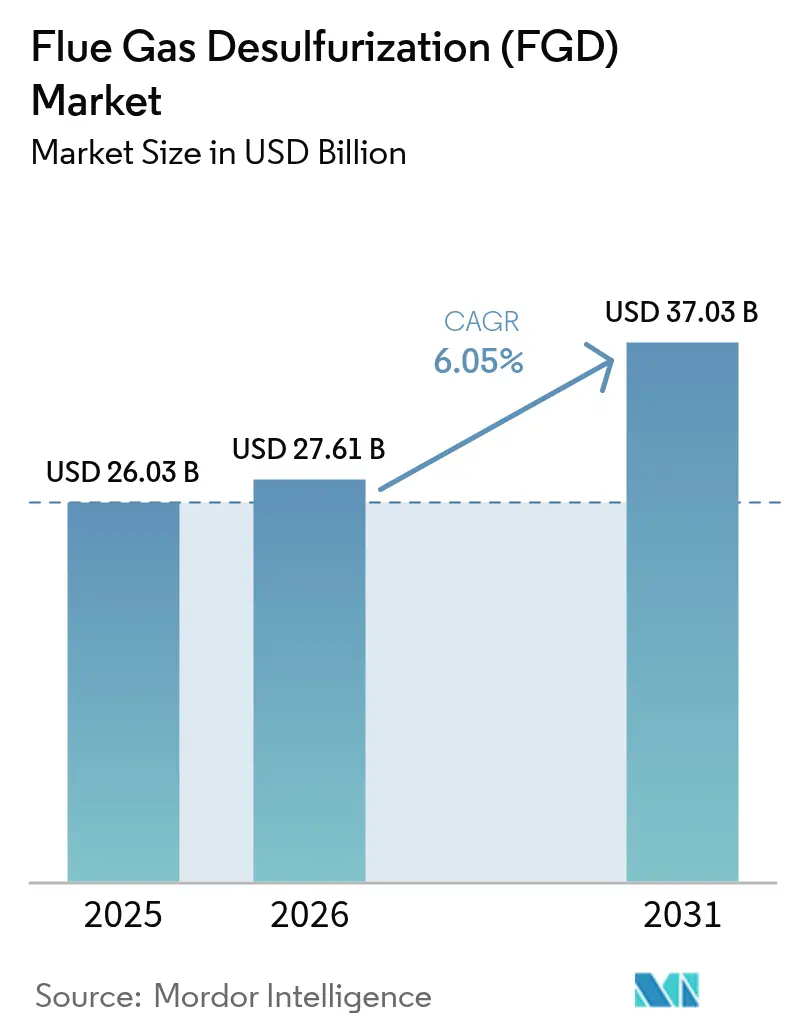
The Flue Gas Desulfurization Market size in 2026 is estimated at USD 27.61 billion, growing from 2025 value of USD 26.03 billion with 2031 projections showing USD 37.03 billion, growing at 6.05% CAGR over 2026-2031.
A tightening regulatory landscape, expanding industrial retrofits, and early integration with carbon-capture equipment sustain growth even as coal capacity retreats worldwide. Power utilities remain the primary adopters, yet cement, iron, steel, and shipping fuel have incremental demand. Suppliers able to bundle wet and dry systems with data-driven services and carbon-capture modules are positioned to capture addressable revenue pools widening across Asia-Pacific, Europe, and selective North American industrial clusters. Coupled with a rising trade in high-purity synthetic gypsum and widening maritime scrubber deployment, the flue gas desulfurization market continues demonstrating durable resilience.
Key Report Takeaways
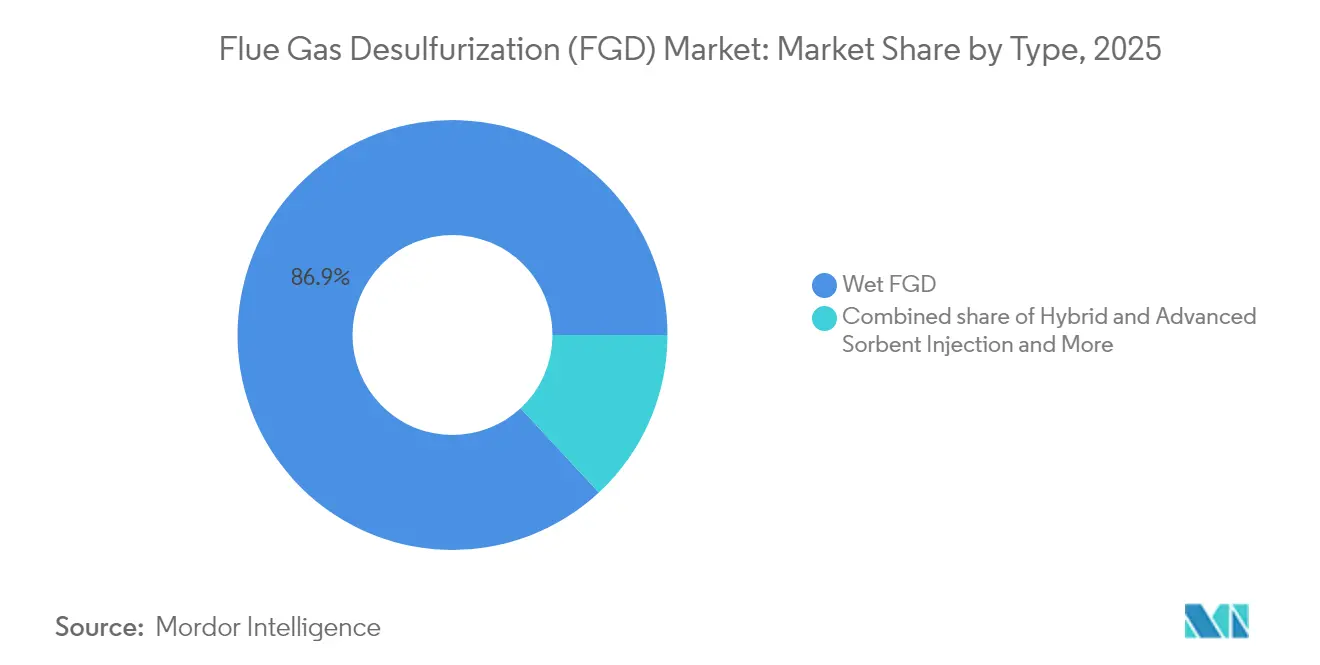
- By type, wet FGD captured 86.92% of the flue gas desulfurization market share in 2025; hybrid and sorbent-injection configurations are forecast to lead growth at 9.65% CAGR through 2031.
- By reagent, limestone commanded 62.95% share of the flue gas desulfurization market size in 2025, whereas sodium-based sorbents are poised to deliver an 8.22% CAGR to 2031.
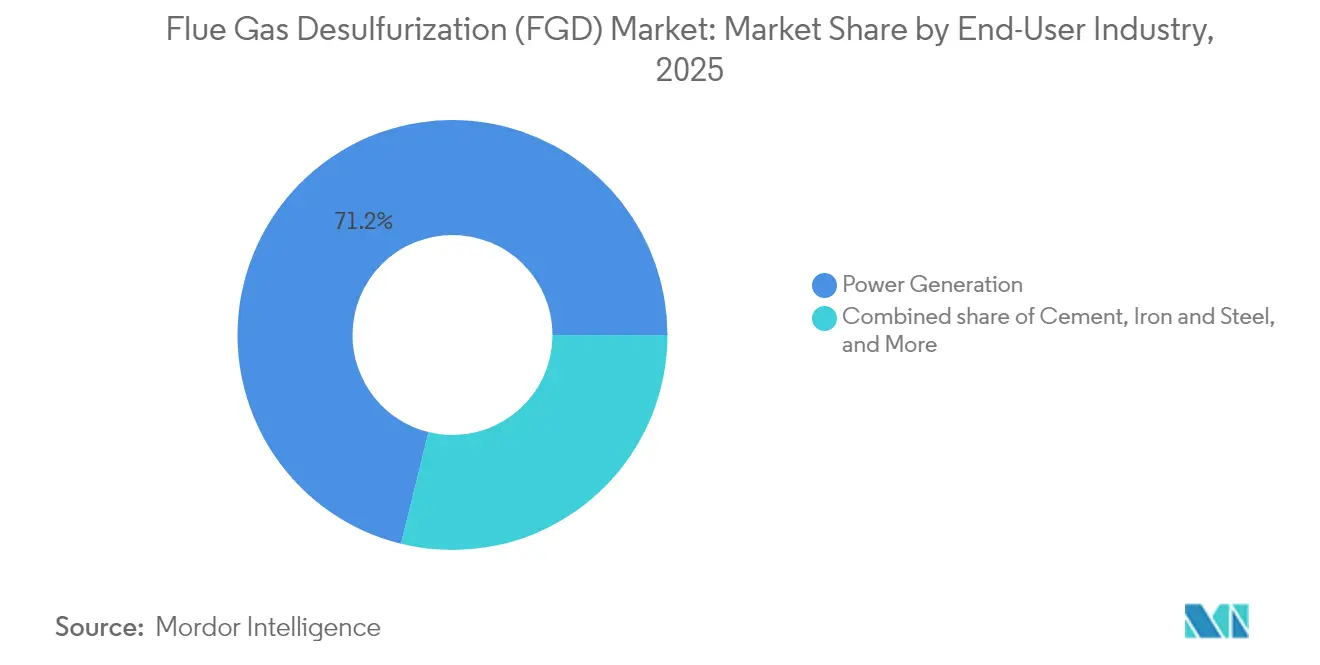
- By end-user, power generation accounted for 71.15% of the flue gas desulfurization market size in 2025, while the cement segment is projected to post the fastest 7.86% CAGR to 2031.
- By geography, Asia-Pacific held 61.70% revenue share of the flue gas desulfurization market in 2025; Europe is set to expand at a 6.98% CAGR through 2031.
Note: Market size and forecast figures in this report are generated using Mordor Intelligence’s proprietary estimation framework, updated with the latest available data and insights as of 2026.
Global Flue Gas Desulfurization (FGD) Market Trends and Insights
Drivers Impact Analysis*
| Driver | ( ~ ) % Impact on CAGR Forecast | Geographic Relevance | Impact Timeline |
|---|---|---|---|
| Stringent SO₂-emission caps in coal-fired power plants | +2.10% | China, EU, North America | Medium term (2-4 years) |
| Mandatory retrofits of aging industrial boilers & kilns | +1.80% | APAC core, Europe, North America | Long term (≥ 4 years) |
| Rising demand for FGD-derived synthetic gypsum | +1.20% | North America, Europe | Short term (≤ 2 years) |
| Integration of FGD with carbon-capture retrofits | +0.90% | Europe, North America opening to APAC | Long term (≥ 4 years) |
| IMO rules driving high-sulfur marine fuel scrubbers | +0.70% | Global maritime corridors | Medium term (2-4 years) |
| Predictive-maintenance analytics lowering OPEX | +0.50% | OECD markets, spreading to emerging economies | Medium term (2-4 years) |
| Source: Mordor Intelligence | |||
Stringent SO₂-Emission Caps in Coal-Fired Power Plants
Global alignment on sulfur-oxide limits is reshaping procurement calendars. China’s ultra-low emission code caps SO₂ at 35 mg/Nm³ and achieves 99% capture through limestone-gypsum loops. The EU’s revised Industrial Emissions Directive imposes tighter benchmarks for large combustion plants, compelling upgrades across legacy fleets.[1] European Commission, “Revision of the Industrial Emissions Directive,” eur-lex.europa.eu The US Environmental Protection Agency finalized a 2024 rule obligating residual coal units to meet stringent hourly sulfur ceilings, catalyzing retrofits in Midwest and Appalachian stations.[2]US Environmental Protection Agency, “Effluent Limitation Guidelines 2024 Update,” epa.gov In Poland, mandated installations lifted limestone use from negligible in 1994 to 3.4 million t/y by 2019 as capture efficiencies passed the 90% mark. Compliance accelerators such as automatic reagent optimization, modular absorber sections, and dual-alkali loops reduce downtime, reinforcing a replacement cycle that lengthens the economic life of installed reactors even as coal dispatch inches downward.
Mandatory Retrofits of Aging Industrial Boilers & Kilns
Industrial point sources below 50 MW thermal capacity now fall under the EU Medium Combustion Plant Directive, multiplying the addressable base by thousands of lignite dryers, kilns, and refinery heaters. Cement plants reveal favorable economics because flue moisture can be reused for raw-meal conditioning, offsetting utility costs. Heidelberg Materials’ USD 500 million Mitchell upgrade in Indiana targets a 2 million t/y CO₂ capture plateau, pairing amine absorption with a new FGD pretreatment train. Similar archetypes materialize in non-ferrous smelters, where elemental-sulfur recovery couples revenue streams with compliance credit sales. Retrofits therefore gravitate toward multi-contaminant kits delivering incremental mercury and NOₓ abatement, making the flue gas desulfurization market a cross-sector platform for integrated pollution control.
Rising Demand for FGD-Derived Synthetic Gypsum
Coal retirements shrink gypsum output even as wallboard and soil conditioner demand rise in North America and parts of Europe. FGD gypsum’s uniform particle size and low radionuclide trace align with green-building protocols, allowing wallboard plants to displace natural mined feedstock and cut logistics expenditure. Producers monetize the by-product by installing dewatering presses that yield 96% solids and marketable granules. Transportation radius remains the limiting factor, pressing operators to forge local offtake pacts and enhance bulk-terminal handling. Consequently, waste-treatment costs decline, raising the internal rate of return for limestone-gypsum facilities and cushioning the flue gas desulfurization market against fuel-mix volatility.
Integration of FGD with Carbon-Capture Retrofits
FGD absorbers and carbon-capture columns share fans, ducts, and mist-elimination gear; repurposing hardware can shave 12–18% from combined capital outlays. Norway’s Brevik CCS project demonstrates synergy: an existing absorber front-ends a 400,000 t/y solvent train, exploiting waste heat for regeneration. Mitsubishi Heavy Industries' CO₂MPACT™ modules capture 1–200 t CO₂/d and bolt onto limestone-gypsum loops without major civil works, targeting cement, steel, and waste-to-energy sites. Proof points spur utilities to future-proof units by oversizing fans and piping to accommodate later carbon capture connections, extending revenue certainty under evolving decarbonization legislation.
Restraints Impact Analysis*
| Restraint | (~) % Impact on CAGR Forecast | Geographic Relevance | Impact Timeline |
|---|---|---|---|
| High CAPEX & disposal costs of wet FGD sludge | –1.4% | Emerging economies | Short term (≤ 2 years) |
| Coal-to-renewables shift curbing new installations | –1.1% | OECD power markets | Long term (≥ 4 years) |
| Limestone supply-chain bottlenecks & price volatility | –0.8% | Regional high-demand pockets | Medium term (2-4 years) |
| Zero-liquid-discharge rules inflating water-use costs | –0.6% | North America, EU | Medium term (2-4 years) |
| Source: Mordor Intelligence | |||
High CAPEX & Disposal Costs of Wet FGD Sludge
Installation expenses near INR 12 million/MW hinder India’s rollout, prompting advisory panels to question blanket mandates. Disposal charges escalate where sludge requires thermal drying or leachate sealing, lifting the levelized cost of electricity by up to USD 3/MWh in emerging grids. Zero-liquid-discharge prescriptions magnify water treatment capital; Pennsylvania’s Homer City power station invested USD 750 million in a compliant evaporator crystallizer train before closing in 2024. As a result, dry sorbent injection garners interest despite lower capture efficiency, creating a price ceiling for the flue gas desulfurization market in capital-constrained regions.
Coal-to-Renewables Shift Curbing New Installations
US utilities will retire 8.1 GW of coal in 2025, sliding to 145 GW by 2028. An average unit age of 50 years dampens retrofit appetite because payback periods exceed remaining asset lives, steering managers toward accelerated closure. European operators follow a similar path, retiring over 10 GW since 2023 as carbon prices surge. Yet India’s USD 33 billion slate of new coal builds, coupled with Indonesia’s 30 GW pipeline, offsets OECD softness, reallocating the growth center of the flue gas desulfurization market eastward.
*Our forecasts treat driver/restraint impacts as directional, not additive. The impact forecasts reflect baseline growth, mix effects, and variable interactions.
Segment Analysis
By Type: Wet Systems Dominate Despite Hybrid Innovation
Wet limestone-gypsum reactors represented 86.92% of the flue gas desulfurization market share in 2025, cemented by >95% SO₂ capture efficiencies under ultra-low emission codes in China. At a flue gas desulfurization market size of USD 22.63 billion, the type thrives on established vendor ecosystems and stable sorbent supply chains. Hybrid and sorbent-injection variants, while accounting for a modest revenue slice, clocked a 9.65% CAGR and attracted industrial retrofits where space or water scarcity constrains wet designs.
Operators favor proven wet loops for high-sulfur, high-volume stacks, yet innovation accelerates around circulating fluidized bed scrubbers that fold in particulate removal, cutting electrostatic precipitator capital outlay. Tri-Mer’s SorbSaver system, for example, integrates dry sorbent dispersion with low-energy baghouses and lowers reagent overdosing by up to 40%, aligning with budgets in sub-25 MW industrial boilers. The coexistence of established and novel designs expands supplier addressable revenue as users layer hybrid kits onto legacy absorbers, sustaining healthy competition within the flue gas desulfurization market.



By Reagent/Sorbent: Limestone Leads While Sodium Systems Accelerate
Limestone captured 62.95% of the flue gas desulfurization market size in 2025, reflecting abundant reserves and low delivered cost in major coal belts. Premium 53% CaO grades fetch higher prices in steelmaking regions, yet utilities typically secure multi-year quarry supply, stabilizing OPEX. Lime, seawater alkalinity, and magnesium hydroxide fill niche duty cycles, particularly along coastal refineries.
Sodium-based sorbents are growing at an 8.22% CAGR as maritime and small industrial users prioritize compact, simple hardware. Hitachi Zosen Inova’s Xerosorp dry reactor posts 94% SO₂ capture on sodium bicarbonate, requiring minimal water input and producing a salable reacted salt cake. Comparative research shows sodium bicarbonate achieves lower residual emissions than limestone under low-temperature spray conditions. Thus, reagent diversification mitigates supply shocks and gives plant owners a menu of sorbents calibrated to site logistics, a trend reshaping future competitive positioning across the flue gas desulfurization market.
By End-User Industry: Power Generation Stable While Cement Surges
The power sector retained 71.15% of 2025 revenue, underpinned by mandatory retrofits in India, Indonesia, and Vietnam. Although coal dispatch wanes in OECD grids, integration with carbon-capture systems sustains retrofit appetite where capacity remains indispensable for grid inertia. Cement kilns, however, post the sharpest 7.86% CAGR as direct-process emissions necessitate stack scrubbing regardless of fuel mix. The segment’s flue gas desulfurization market size is projected to double by 2030 as producers pair SO₂ removal with CO₂ capture to hedge future carbon fees.
Steelmakers rank next, with sinter plants and hot-strip mills installing wet scrubbers that dovetail with limestone flux logistics. Chemicals and petrochemicals adopt corrosion-resistant alloys and dual-alkali designs that withstand chlorine and sulfuric acid traces, extracting higher average selling prices for vendors. Collectively, industrial diversification lessens reliance on the utility cycle, reinforcing stable mid-single-digit expansion across the flue gas desulfurization market.
Geography Analysis
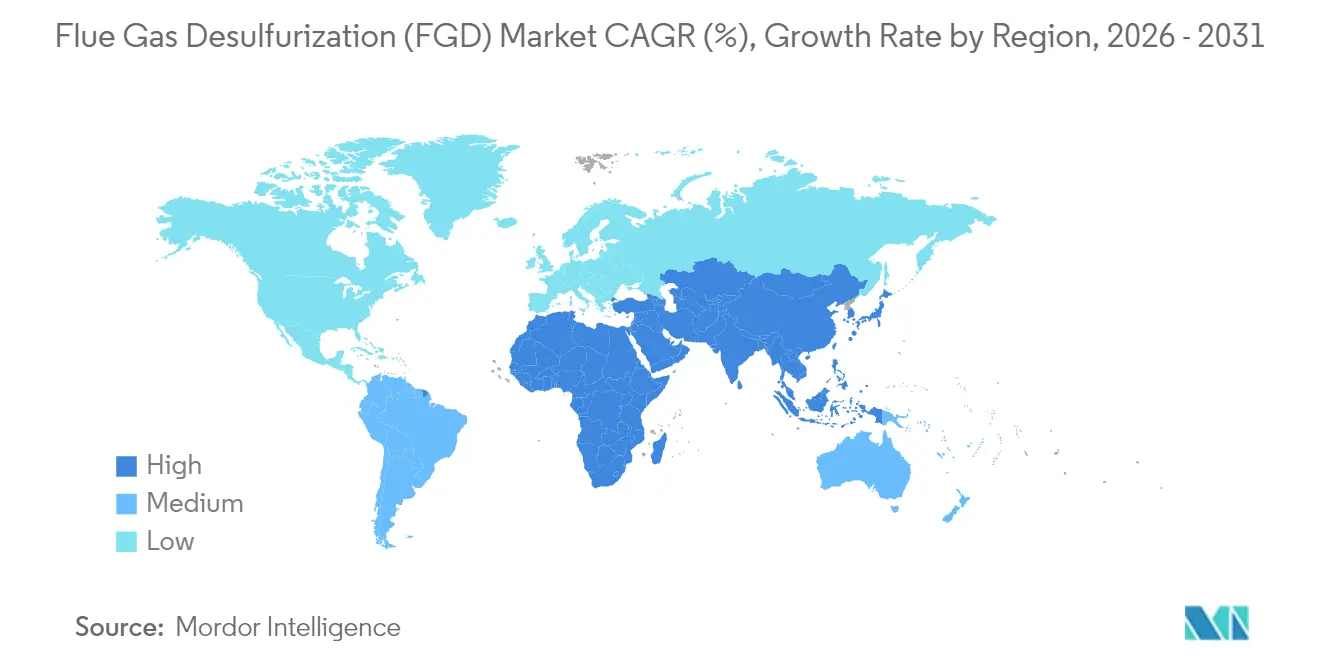
Asia-Pacific commands 61.70% of 2025 revenue and will tack on a 6.98% CAGR through 2031, anchored by China’s >95% wet-system penetration and India’s multi-gigawatt pipeline despite intermittent policy debate. Vietnam, Indonesia, and the Philippines incentivize SO₂ control upgrades via concessional lending, adding density to regional vendor service networks. Japan and South Korea specialize in marine scrubber supply, leveraging shipyard ecosystems to export turnkey kits across global fleets.
Europe enforces the world’s strictest emission ceilings, spurring retrofits in small-to-medium industrial plants. Germany, Belgium, and Poland invest heavily in absorber upgrades linked to carbon-capture pilots under the EU Innovation Fund, positioning the region as a technology incubator. Nordic maritime regulations accelerate the adoption of closed-loop scrubbers, export regulatory templates worldwide, and sustain European equipment backlogs.
North America experiences structural attrition in utility coal capacity, yet industrial adopters buoy order intake. Cement plants in the United States advance with USD 500 million-plus CCUS retrofits that assume FGD bleeds for solvent protection. Canada tightens sulfur limits in oil-sands boilers, stimulating fresh package-plant bids, while Mexican utilities outline modernization roadmaps aligning with updated NOM-085-SEMARNAT limits. South America and the Middle East & Africa contribute single-digit revenue shares but deliver sporadic large orders tied to refinery expansions, fertiliser complexes, and copper smelters, offering long-cycle prospects for globally active OEMs.

Regulatory Landscape
SO2 compliance requirements continue to be shaped by tightening frameworks and selective policy recalibration across major regions. In the European Union, the revised Industrial Emissions Directive, Directive (EU) 2024/1785, entered into force in August 2024 and retains a Best Available Techniques (BAT) basis for emission performance under the Large Combustion Plants BREF. Member States face a July 2026 transposition deadline, and the European Commission is required to update the implementing decision for the type, format, and frequency of Member State reporting by August 5, 2026. These milestones support permitting and monitoring activity, and they are also expected to keep retrofits for large combustion and other industrial point sources moving where high-efficiency SO2 control is required.
In the United States, the regulatory picture has a notable near-term shift for affected coal and oil-fired utility units after the US Environmental Protection Agency finalized a repeal in February 2026 of the May 2024 amendments to the Mercury and Air Toxics Standards (MATS), removing the revised filterable particulate matter and mercury standards for lignite-fired units, with the action taking effect April 27, 2026. Although MATS is not an SO2 rule, changes in multi-pollutant compliance posture can affect how utilities sequence and bundle control upgrades at residual thermal fleets, alongside ongoing water and effluent constraints that shape wet FGD wastewater handling and zero-liquid-discharge driven cost inflation in some jurisdictions.
Value Chain Analysis
The flue gas desulfurization value chain runs from upstream materials and reagents to engineered components, system integration, and lifecycle services. Key inputs include limestone, lime, and sodium-based sorbents, along with high-alloy steels, corrosion-resistant linings, fiberglass-reinforced plastics, and specialized concrete for absorber islands and ductwork. Core components include slurry pumps, spray headers and nozzles, mist eliminators, oxidation air systems, instrumentation, and control systems, with performance increasingly tied to automation for reagent optimization and reliability.
Downstream, original equipment manufacturers and specialist air-pollution-control providers execute projects through EPC-led delivery, often combining custom absorber design, onsite fabrication, and modular skids depending on site constraints. Active players across the chain include ANDRITZ AG, Marsulex Environmental Technologies, Wheelabrator Air Pollution Control, and Clean Gas Systems, alongside large conglomerates such as Mitsubishi Heavy Industries, Siemens Energy, and Babcock & Wilcox. Typical friction points involve lead times and cost volatility for corrosion-resistant materials, plus the availability of skilled EPC labor for retrofits that must fit within tight outage windows, which raises the value of local partnerships and service hubs in major coal and industrial clusters.
Competitive Landscape
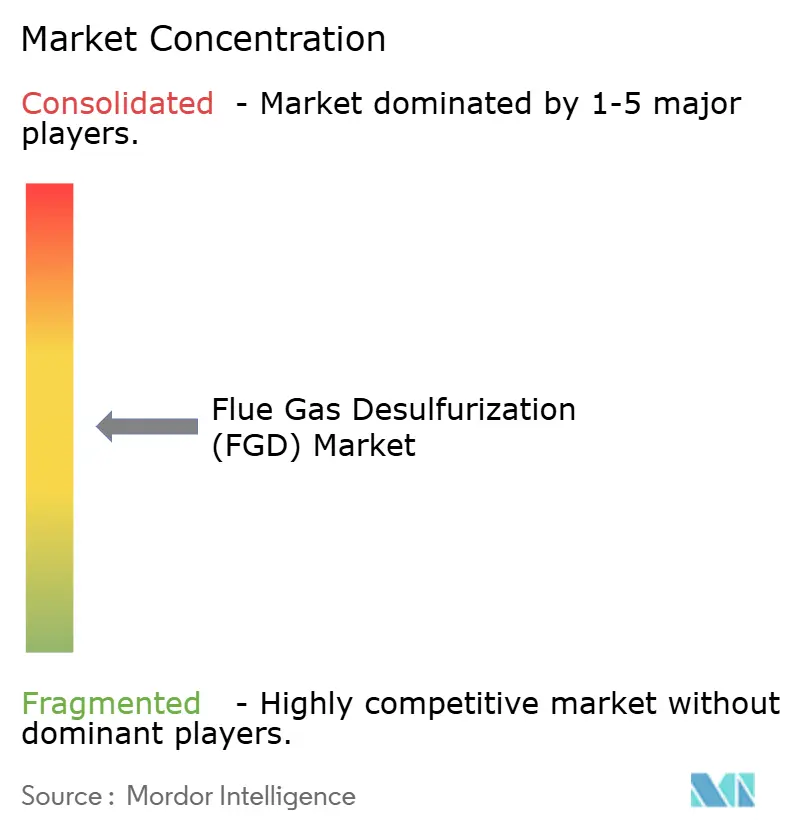
The flue gas desulfurization market presents a moderately concentrated structure where the top five suppliers control 55–60% of installed capacity revenues. Mitsubishi Heavy Industries recorded a record ¥7,071.2 billion order intake in FY 2024, buoyed by turbine upgrades and CCUS-ready scrubbers.[4]Mitsubishi Heavy Industries, “MHI Report 2024,” mhi.com ANDRITZ’s USD 100 million acquisition of LDX Solutions in February 2025 broadens its wet electrostatic and thermal oxidizer lineup, strengthening cross-sell potential into pulp, mining, and power segments.[5]ANDRITZ AG, “Acquisition of LDX Solutions,” andritz.com
GE Vernova collaborates with Svante on carbonate looping and is studying exhaust-gas recirculation under a US Department of Energy grant, signaling convergence of sulfur and carbon mitigation on modular skids GEVernova.com. Alfa Laval and Wärtsilä dominate maritime scrubbers, leveraging thousands of reference installations and robust global service stations. Chinese heavy-machinery integrators such as Dongfang Boiler and Babcock & Wilcox Beijing supply cost-optimized wet loops that secure domestic share yet increasingly bid on Southeast-Asian tenders.
Competitive levers hinge on lifecycle support, digital twins, and reagent-optimization software that reduce operating expense rather than headline capex alone. Suppliers with a wide portfolio spanning wet, dry, and hybrid designs and carbon-capture attachments enjoy a hedge against changing fuel mixes and regulatory escalations.
Flue Gas Desulfurization (FGD) Industry Leaders
Mitsubishi Heavy Industries Environmental & Chemical Engg.
GE Vernova (incl. Alstom legacy)
Babcock & Wilcox Enterprises Inc.
Fujian Longking Co. Ltd
Andritz AG
- *Disclaimer: Major Players sorted in no particular order

Market Opportunities and Future Outlook
Integration of FGD with carbon-capture retrofits is a clear whitespace, since plant owners and suppliers are already aligning design choices around shared ducting, fans, and mist elimination, and because pretreatment requirements can protect solvents in cement and other hard-to-abate industries. Project archetypes show where budgets are moving, including Heidelberg Materials upgrade activity at Mitchell in Indiana that pairs CO2 capture with an FGD pretreatment train, and Norway's Brevik CCS configuration demonstrating how an existing absorber can front-end a large solvent system. This supports FGD upgrade demand that prioritizes chloride control, aerosol management, corrosion resistance, and tighter operational stability, rather than focusing only on incremental SO2 capture.
Operational efficiency and by-product monetization also create opportunity pools for utilities and industrial sites. On the process side, peer-reviewed work in 2026 on additives such as adipic acid in wet limestone systems points to measurable reductions in limestone consumption and improved gypsum quality, which fits operator priorities to reduce reagent spend and improve the economics of saleable synthetic gypsum where local offtake exists. Water constraints and zero-liquid-discharge requirements also keep semi-dry and sorbent-injection configurations relevant in space- or water-limited sites, expanding demand for hybrid configurations and service offerings built around analytics, remote monitoring, and consumables management.
Recent Industry Developments
- April 2026: Mitsubishi Power India Private Limited entered negotiations to exit an FGD installation project at NTPC's Farakka Super Thermal Power Station after delays. The move highlights execution and scheduling risk in large retrofit programs, which can shift near-term opportunity toward vendors with stronger outage management and local delivery capability.
- December 2025: Babcock & Wilcox was awarded a USD 40 million contract to supply advanced wet gas scrubbing technology for a petroleum refinery in Canada. The win points to incremental FGD-adjacent demand from refining and heavy industrial end users that prioritize high-reliability sulfur control and long-term aftermarket support.
- November 2024: Babcock & Wilcox received full notice to proceed on a USD 246 million coal-to-gas conversion project at AES Indiana's Petersburg Generating Station. Fuel switching programs of this scale typically drive reconfiguration of flue-gas cleanup trains and open follow-on scope for integrated emissions-control upgrades and service contracts.


Research Methodology Framework and Report Scope
Market Definition and Coverage
This market covers the equipment, systems, and related services used to remove sulfur dioxide (SO2) from industrial flue gas streams, mainly from coal and oil fired power and large process plants, so emissions stay within permitted limits.
Scope exclusions: It excludes broader air pollution control equipment not installed for SO2 control (such as stand-alone dust collection) and routine fuel switching costs.
Segmentation Overview
- By Type
- Wet FGD
- Limestone/Gypsum Wet Scrubbers
- Seawater Scrubbers
- Dry and Semi-Dry FGD
- Spray-Dry Absorbers
- Circulating Fluidized-Bed Dry Scrubbers
- Hybrid and Advanced Sorbent Injection
- Wet FGD
- By Reagent/Sorbent
- Limestone
- Lime
- Seawater
- Sodium-based and Other Alkalis
- By End-User Industry
- Power Generation
- Cement
- Iron and Steel
- Chemical and Petrochemical
- Non-Ferrous Metals
- Waste-to-Energy and Others
- By Geography
- North America
- United States
- Canada
- Mexico
- Europe
- Germany
- United Kingdom
- France
- Italy
- Spain
- Russia
- Rest of Europe
- Asia Pacific
- China
- India
- Japan
- South Korea
- ASEAN Countries
- Rest of Asia Pacific
- South America
- Brazil
- Argentina
- Rest of South America
- Middle East and Africa
- Saudi Arabia
- United Arab Emirates
- South Africa
- Egypt
- Rest of Middle East and Africa
- North America
Data Sources, Market Sizing, and Validation
Desk Research
Desk work starts by mapping where SO2 control demand comes from, and how that demand translates into FGD projects and spend. We rely on public sources such as emissions regulations and permit portals from environmental agencies, electricity generation statistics from energy ministries, and country level industrial production series.
To anchor equipment and reagent assumptions, we also review sources such as US EPA air emissions inventories, the IEA and World Bank energy and industry datasets, and peer reviewed engineering literature on removal efficiencies and reagent consumption. Supporting context is taken from company annual reports and investor presentations, trade association websites, and reputed press coverage of retrofits, shutdowns, and new capacity. We also use paid subscriptions for company financials and news, patent lookups, and import export shipment level checks when equipment trade is material. These examples are not exhaustive, and many other public references were used for data collection, validation, and research clarification.
Primary Interviews and Surveys
Primary work is used to pressure test the desk assumptions that most often move the market total, like typical project values, reagent mix, and how much of installed base is under long term service. We speak with EPC and maintenance stakeholders, utilities and industrial plant personnel, and domain specialists across APAC, EMEA, and the Americas so the final model reflects real buying cycles and operating practices.
Distribution of primary research fieldwork respondents
| Company type | Respondent position | Region |
|---|---|---|
| Top tier: 37% | CXOs: 16% | APAC: 40% |
| Mid tier: 44% | Functional/Unit leaders: 28% | EMEA: 36% |
| Smaller Players: 19% | Managers: 56% | Americas: 24% |
Market-Sizing & Forecasting
Sizing is built using a top-down approach where power and industrial activity indicators are reconstructed into an addressable SO2 control demand pool, and then translated into FGD spending by technology and end use. The core inputs include coal and oil based generation by country, announced retirements and new builds, scrubber adoption in the installed fleet, typical capex per MW for new or retrofit units, and operating spend drivers like reagent intensity (limestone, lime, or other sorbents) and gypsum by-product handling.
Once the demand pool is formed, results are checked with selective bottom-up approximations, such as sampling known project announcements, supplier and EPC revenue exposure to FGD, and sanity checks on average selling prices for major modules like absorbers, fans, and slurry handling. When disclosed project values are missing, gaps are handled using proxy ranges by plant size, sulfur content norms, and the local compliance strictness, which are then cross-verified in follow-up calls.
For forecasting, we primarily use scenario analysis because regulatory enforcement, power dispatch changes, and retrofit timing can shift quickly. Scenarios are guided by expert views on compliance timelines, expected coal generation pathways, and industrial expansion, and are then converted into annual market values with moderated price and mix progression assumptions.
Data Validation & Update Cycle
Validation is done through triangulation across the model output, independent activity signals, and interview feedback, and then reviewed for variance before sign-off. Checks include whether implied spend per MW looks realistic for each region, whether reagent demand aligns with typical consumption factors, and whether retrofit volumes match known compliance deadlines.
If a large variance shows up, we re-check the underlying drivers and re-contact sources when needed, especially around policy changes, plant retirements, or major project awards. Reports are refreshed annually, and interim updates are made when material events occur. Before delivery, an analyst runs a fresh pass across key inputs so clients receive the latest updated view.
Mordor Intelligence's Flue Gas Desulfurization Fgd Market Sizing Compared With Other Published Estimates
Published FGD market values can differ a lot, even when they look like they are covering the same topic. The gap usually comes from what is counted in the total, which year is used as the base, and how each publisher treats services, consumables, and retrofit timing.
The main gap comes from whether recurring reagent and maintenance spending is counted alongside system sales, where Mordor Intelligence keeps the scope centered on the FGD market definition used in the study period (2026 as the stated market size year) and avoids folding in adjacent air quality equipment that is not installed for SO2 removal.
Benchmark comparison
| Source | Market Size | Gaps in Research Methodology |
|---|---|---|
| Mordor Intelligence | USD 27.61 B (2026) | |
| Regional Consultancy A | USD 22.45 B (2024) | Uses an earlier base year, and its scope explicitly includes repairs and consumables as a named segment, which can shift the mix and dampen near term equipment cycles when retrofit timing is lumpy. |
| Global Consultancy B | USD 18.63 B (2024) | Builds from a different historical window and forecast start, and it appears to treat a broader bundle of components and associated services, which can change what is captured as FGD versus supporting plant equipment. |
The table shows that base-year choice and what gets counted as ongoing spend are two practical reasons the numbers spread out. By tying the total to clear demand signals like coal fired generation, compliance driven retrofit activity, and reagent intensity, our estimate stays traceable to inputs that can be reviewed and updated year after year.


Key Questions Answered in the Report
What is the projected value of the flue gas desulfurization market by 2031?
The flue gas desulfurization market size is forecast to reach USD 37.03 billion by 2031.
Which region currently dominates revenue?
Asia-Pacific held 61.70% of global revenue in 2025 due to expansive Chinese and Indian coal fleets and growing industrial retrofits.
Why are wet limestone-gypsum systems still preferred?
They deliver >95% SO₂ removal, meet ultra-low emission codes, and benefit from mature supply chains, ensuring predictable lifecycle costs.
How fast is the cement segment growing?
Cement applications are advancing at an 7.86% CAGR through 2031 as plants pair SO₂ removal with CO₂-capture retrofits.
Will carbon-capture integration change FGD specifications?
Yes. New absorbers are often oversized and equipped with corrosion-resistant alloys to accommodate future CO₂ solvent systems, lowering total retrofit costs.
What factors may restrain new installations?
High capital costs, sludge disposal expenses, and accelerated coal retirements in OECD markets act as primary headwinds.
Page last updated on:


 Your data is secure and never sold or shared.


