
Flight Data Monitoring Market Size and Share
Market Overview
| Study Period | 2020 - 2031 |
|---|---|
| Market Size (2026) | USD 6.23 Billion |
| Market Size (2031) | USD 8.72 Billion |
| Growth Rate (2026 - 2031) | 6.97 % |
| Fastest Growing Market | Asia Pacific |
| Largest Market | North America |
| Market Concentration | Low |
Major Players *Disclaimer: Major Players sorted in no particular order Image © Mordor Intelligence. Reuse requires attribution under CC BY 4.0. | |
Flight Data Monitoring Market Analysis by Mordor Intelligence
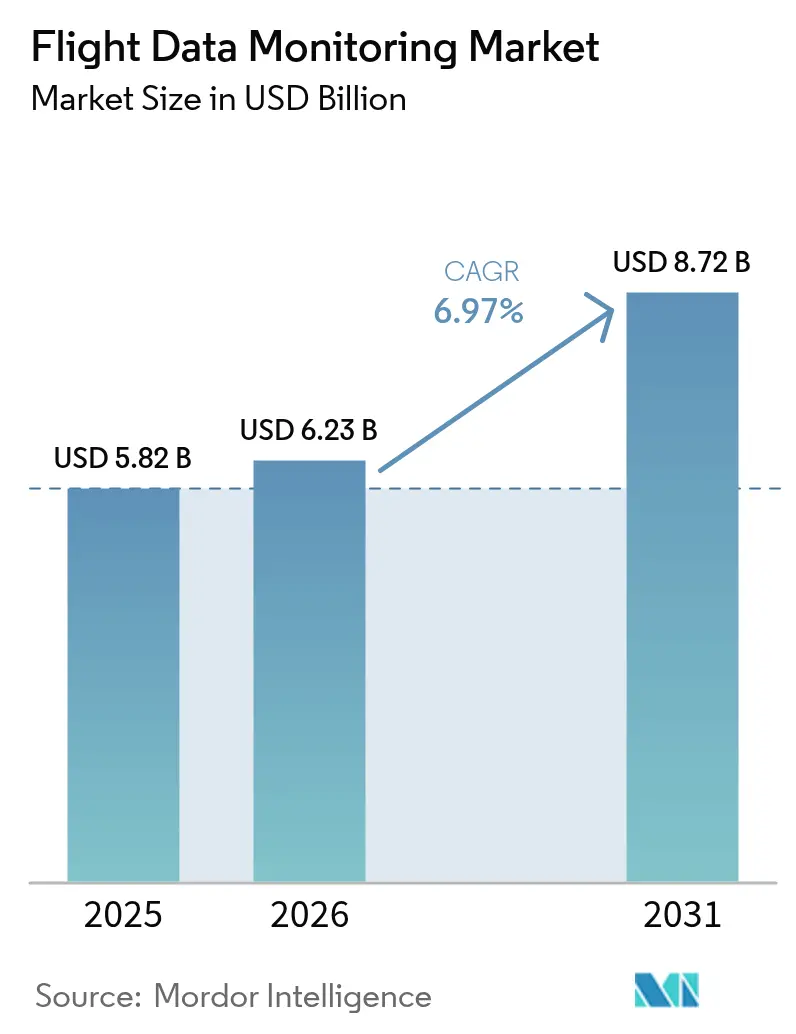
The flight data monitoring market size is expected to grow from USD 5.82 billion in 2025 to USD 6.23 billion in 2026 and is forecast to reach USD 8.72 billion by 2031 at 6.97% CAGR over 2026-2031. Airlines and operators now treat flight data as a strategic asset that unlocks cost savings through predictive analytics and fuel-efficiency algorithms. Regulatory harmonization—from ICAO’s real-time distress tracking rule to the FAA’s 25-hour cockpit voice recorder mandate—compresses adoption timelines while creating a standardized global baseline. The shift toward centralized, cloud-based analysis supports on-ground platforms that eliminate aircraft weight penalties and make advanced analytics economically attractive. Technology suppliers respond with AI-ready devices and open data architectures, enabling operators to integrate performance, maintenance, and safety dashboards on a common interface. North America retains first-mover advantage through established data-sharing frameworks, yet Asia-Pacific records the fastest expansion as its aviation infrastructure scales and urban air mobility projects gather momentum.
Key Report Takeaways
- By installation type, onboard systems led with 67.58% of the flight data monitoring market share in 2025, while on-ground systems are projected to grow at an 8.01% CAGR to 2031.
- By platform, fixed-wing aircraft held 59.15% of the flight data monitoring market size in 2025, and unmanned aerial vehicles (UAVs) are rising at a 9.91% CAGR through 2031.
- By component, hardware accounted for 39.98% of the flight data monitoring market size in 2025; software and analytics are set to expand at an 8.22% CAGR over the same period.
- By end user, commercial airlines captured 51.66% revenue share in 2025, whereas UAV service providers are pacing the field with a 10.62% CAGR to 2031.
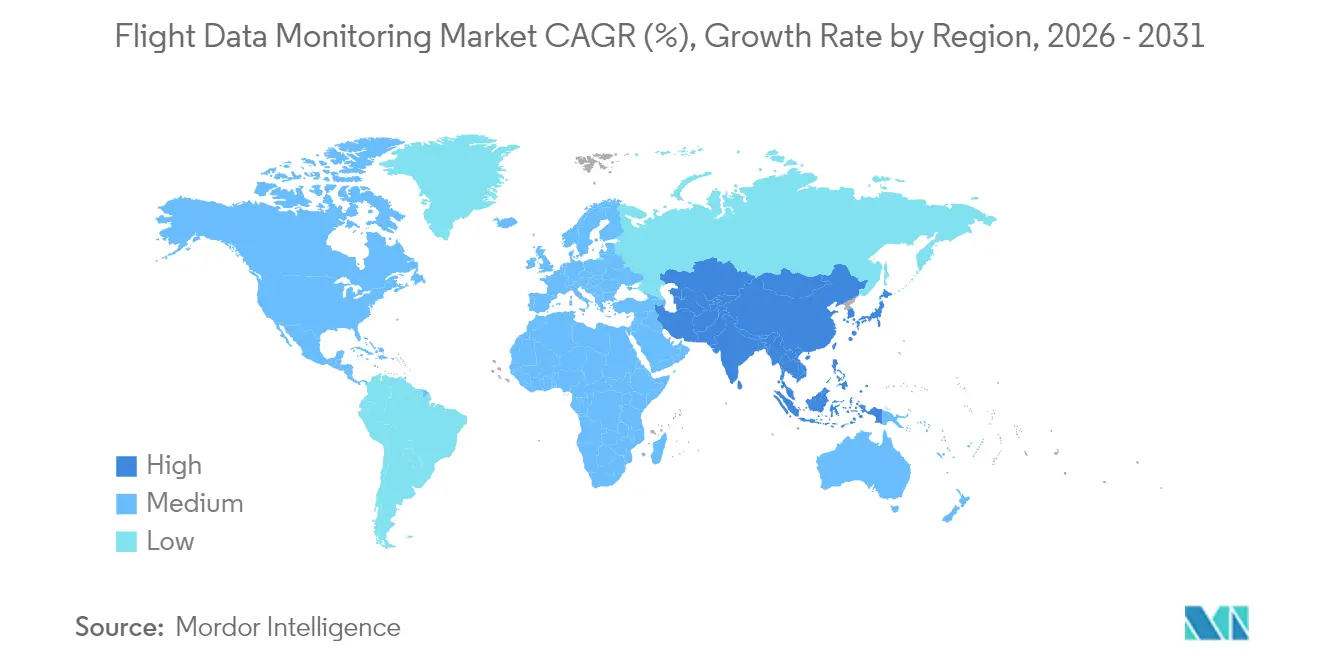
- By region, North America commanded 29.95% of the flight data monitoring market share in 2025, and Asia-Pacific is forecasted to register a 7.56% CAGR through 2031.
Note: Market size and forecast figures in this report are generated using Mordor Intelligence’s proprietary estimation framework, updated with the latest available data and insights as of 2026.
Market Trends and Insights
Drivers Impact Analysis of Flight Data Monitoring Market*
| Driver | (~) % Impact on CAGR Forecast | Geographic Relevance | Impact Timeline |
|---|---|---|---|
| Global mandates accelerating adoption of onboard flight data monitoring systems | +1.8% | Global, early uptake in North America and EU | Short term (≤ 2 years) |
| Airlines prioritizing predictive maintenance to reduce operational disruptions and costs | +1.5% | Global, strongest in North America and Asia-Pacific | Medium term (2-4 years) |
| Deployment of lightweight, cloud-enabled FDM solutions for UAVs and smaller platforms | +1.2% | Asia-Pacific core, spill-over to North America | Medium term (2-4 years) |
| Integration of real-time FDM data into AI platforms for performance and fuel optimization | +1.0% | Global, led by developed markets | Long term (≥ 4 years) |
| Insurance-linked incentives encouraging airlines to adopt FDM programs | +0.8% | North America and EU | Short term (≤ 2 years) |
| Growing emphasis on post-incident transparency and automated incident investigation | +0.7% | Global, regulation driven | Medium term (2-4 years) |
| Source: Mordor Intelligence | |||
Global Mandates Accelerating Adoption of Onboard Flight Data Monitoring Systems
Regulatory bodies are aligning performance and recording standards, transforming compliance from a patchwork into a synchronized global framework. ICAO’s Amendment 48 to Annex 6 obliges aircraft above 27,000 kg to transmit position data every minute during distress events beginning January 2025, forcing upgrades that blend flight recording and real-time connectivity. In parallel, the FAA’s 25-hour cockpit voice recorder rule, effective May 2024, has created a USD 800 million retrofit wave as carriers outfit legacy fleets with compliant recorders. This harmonization simplifies certification, lowers per-unit costs, and removes the previous geographic barriers that had kept small operators on the sidelines. Manufacturers can scale single product lines across continents, while operators benefit from a universally accepted safety baseline that streamlines leasing, resale, and cross-border wet-lease arrangements.
Airlines Prioritizing Predictive Maintenance to Reduce Operational Disruptions and Costs
Operators increasingly apply multi-flight data sets to predict component wear and avert unscheduled maintenance events. NASA studies show that condition-based maintenance can cut direct maintenance costs by up to 30% compared with interval scheduling.[1]National Aeronautics and Space Administration, “Condition-Based Maintenance Cost Savings,” ntrs.nasa.gov Lockheed Martin’s HercFusion platform, trained on roughly 3 million flight hours, demonstrated a 3% uptick in mission availability and a 15% cut in fuel burn for C-130 operators.[2]Lockheed Martin, “HercFusion Analytics Platform,” lockheedmartin.com Airbus extends the model with its Skywise Fleet Performance+ suite, which allows easyJet to pre-empt system failures that historically triggered cancellations, thereby protecting revenue and passenger trust. These performance gains turn flight data monitoring from a cost center into a strategic profit lever and accelerate enterprise-wide adoption.
Deployment of Lightweight, Cloud-Enabled FDM Solutions for UAVs and Smaller Platforms
Unmanned aircraft require compact devices, low power draw, and regulatory compliance that parallels manned aviation. Cloud offload shifts heavy computation from the airframe to ground infrastructure, allowing sensor-dense flights without weight penalties. AirData UAV’s partnership with Google illustrates how automatic flight log syncing and secure cloud storage help operators meet civil aviation reporting rules without proprietary manufacturer clouds. 5G and edge computing improve bandwidth and latency, letting operators monitor fast-moving drones in urban delivery corridors. These UAV innovations establish blueprints that commercial helicopter and regional jet programs will later adopt.
Integration of Real-Time FDM Data into AI Platforms for Performance and Fuel Optimization
AI makes flight data actionable as soon as it is generated. Boeing’s Fuel Analytics engine parses more than 650 parameters per flight and routinely yields 1–3% fuel savings, with outlier carriers achieving 4.3%. GE Aerospace’s Event Measurement System fuses weather, navigation, and ops data to deliver out-of-the-box analytics while allowing bespoke rule creation. Airlines gain a continuous feedback loop: flight crews follow data-driven recommendations, and post-flight reports refine the models. Over time, this virtuous cycle embeds AI into dispatch, trajectory planning, and even crew training curricula.
Restraints Impact Analysis of Flight Data Monitoring Market*
| Restraint | (~) % Impact on CAGR Forecast | Geographic Relevance | Impact Timeline |
|---|---|---|---|
| High upfront installation and integration costs limiting adoption among smaller operators | -1.2% | Global, strongest in developing markets | Short term (≤ 2 years) |
| Data privacy and ownership concerns delaying broader adoption | -0.8% | EU and North America, extending globally | Medium term (2-4 years) |
| Limited technical standardization across aircraft platforms and avionics | -0.7% | Global, with concentration in mixed-fleet operations | Long term (≥ 4 years) |
| Lack of in-house analytics expertise to extract actionable insights | -0.6% | Global, strongest impact in emerging markets | Medium term (2-4 years) |
| Source: Mordor Intelligence | |||
High Upfront Installation and Integration Costs Limiting Adoption Among Smaller Operators
Charter firms and regional airlines often operate on slim margins and older airframes that require extensive modification. The FAA estimates Part 135 SMS compliance will cost the segment USD 47.4 million each year, highlighting the capital burden for small fleets. Retrofits demand downtime, specialized labor, and certification paperwork that many small operators schedule only when forced. The result is a market bifurcation: large carriers move toward fleet-wide predictive analytics, while smaller outfits stay in compliance-only mode, missing efficiency benefits until hardware prices decline or leasing models emerge.
Data Privacy and Ownership Concerns Delaying Broader Adoption
Flight data often includes personal or commercially sensitive information. GDPR imposes strict requirements on how European carriers manage and export such data, and similar frameworks are spreading worldwide. IATA notes that overlapping passenger data rules complicate global data flows and force airlines to invest in encryption, anonymization, and consent mechanisms. CISA has warned of supply-chain vulnerabilities in some foreign-built unmanned aircraft, prompting additional cybersecurity layers. These regulatory and technical hurdles delay projects, especially for operators lacking internal legal and IT resources.
*Our forecasts treat driver/restraint impacts as directional, not additive. The impact forecasts reflect baseline growth, mix effects, and variable interactions.
Flight Data Monitoring Market Segment Analysis
By Installation Type:
Ground Systems Drive Analytics EvolutionOnboard devices retained a 67.58% share in 2025, anchoring the flight data monitoring market size to core flight safety demands. They supply time-critical data such as exceedance alerts to pilots and dispatchers. Yet on-ground platforms are growing at an 8.01% CAGR because airlines prefer centralized clouds that process multi-year histories across fleets. This architecture removes weight from the aircraft and enables advanced AI that would be impractical to host onboard. Increasing bandwidth availability and secure satellite links allow near-real-time downlink for after-action review minutes after touchdown. Airlines consolidate multiple OEM formats into common databases, improving cross-type benchmarking while cutting licensing costs. Honeywell and NXP’s collaboration couples high-performance onboard processors with cloud APIs so operators can choose which analytics reside in the aircraft versus the data center. Regulatory bodies accept this hybrid design, accelerating certification for mixed fleets and letting low-cost carriers access sophisticated analytics without heavy avionics upgrades. Ground architectures also align with sustainability agendas because they prolong hardware lifecycles. Rather than retrofitting each aircraft for new algorithms, airlines update server-side software, slashing upgrade expense and e-waste.




By Platform:
UAV Integration Reshapes Market DynamicsFixed-wing aircraft contributed 59.15% of the flight data monitoring market size in 2025, reflecting the broad global fleet of passenger and cargo jets that already carry recorders and quick-access devices. This installed base continues to purchase incremental upgrades, but its growth sits below the overall market average. In contrast, the unmanned aerial vehicle segment is expanding at a 9.91% CAGR because regulators are finalizing frameworks that open commercial corridors for inspection, logistics, and urban-air-mobility missions. Weight and power limits on drones push suppliers toward low-profile sensors, edge processors, and cellular or satellite data pipes. Lessons learned here now influence retrofit projects in legacy turboprops and helicopters, demonstrating reverse technology transfer. Rotary-wing fleets in emergency medical services and offshore energy remain niche yet steady adopters, drawn by the need to monitor engine health and exceedances in high-cycle missions. GE Aerospace’s collaboration with Kratos Defense illustrates cross-pollination: innovations developed initially for cost-sensitive unmanned systems are being repackaged for manned regional jets. Platform convergence ensures that analytics created for one airframe class are portable across multiple types, reinforcing vendor ecosystems and reducing operator switching costs.
UAV growth also reshapes supply chains because non-traditional aviation firms—software startups, cellular operators, and logistics brands—purchase monitoring as a service rather than buying hardware outright. This subscription outlook compresses refresh cycles, encouraging vendors to migrate from one-time equipment sales toward recurring analytics revenues. The trend ultimately benefits airlines because it finances faster algorithmic innovation that spills into fixed-wing and rotary-wing fleets. As national authorities publish specific-category operating rules, they often make flight data monitoring compulsory for autonomous or remotely piloted commercial missions, locking in future demand.
By Component:
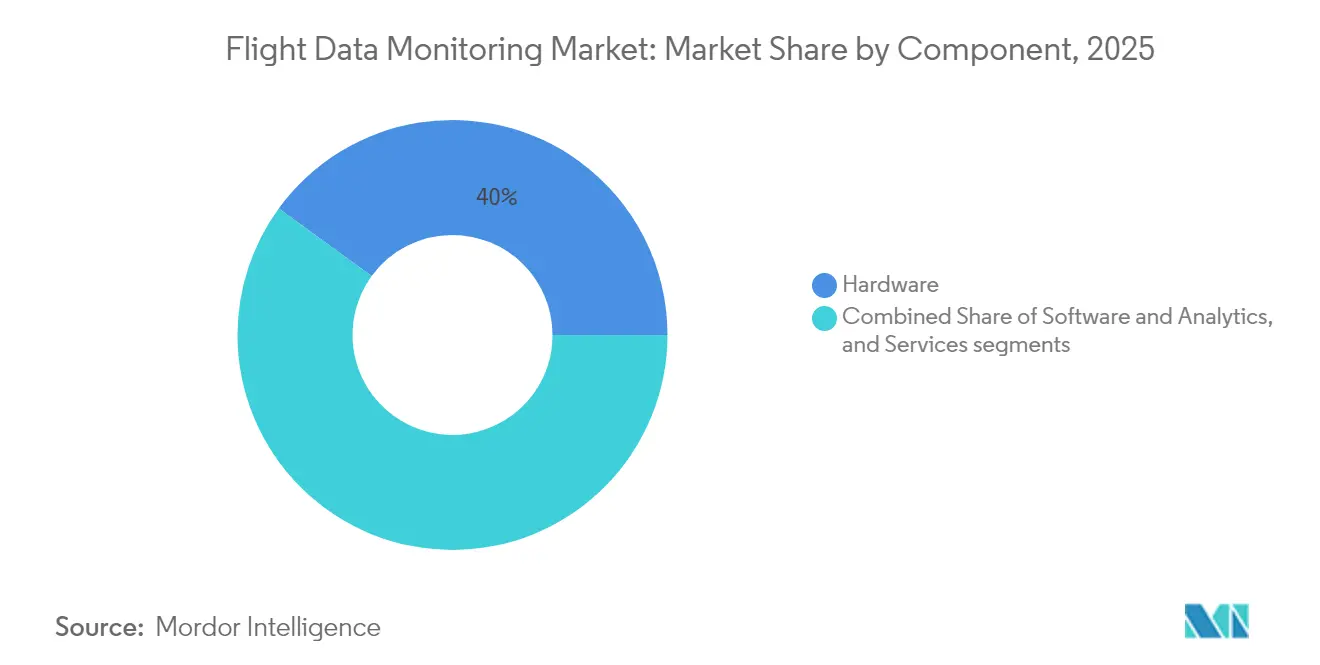
Software Analytics Drives Value CreationHardware still led the component split at 39.98% of revenue in 2025, but its growth tracks the industry average, while software and analytics show an 8.22% CAGR through 2031. Airlines no longer see value in sheer gigabytes of data; they need actionable insights that integrate maintenance, fuel, and route planning within one dashboard. The move to modular software lets operators add features via license codes instead of cabin visits. GE Aerospace’s Event Measurement System ships with over 10,000 pre-built rules, shortening deployment for carriers lacking data-science teams. Suppliers monetize ongoing algorithm subscriptions, performance-based service contracts, and optional AI co-piloting modules, diversifying from cyclical avionics sales.
Services remain a stable, if slower-growing, revenue base because each hardware integration triggers certification, training, and data-governance consulting. However, the rate is tied to the physical fleet count, whereas software uses cloud scalability to sell incremental capacity at marginal cost. Airlines compare the lifetime total cost of ownership and find that analytics savings—fuel cuts and reduced AOG events—outweigh the subscription fees within months. This economic logic increasingly drives tender requirements, pushing hardware suppliers to bundle AI engines or risk commoditization. As a result, the flight data monitoring market experiences continuous firmware releases that add collaborative features such as real-time anomaly dashboards for crews and maintenance engineers.
By End User:
UAV Service Providers Lead Growth TrajectoryCommercial airlines dominated end-user revenue at 51.66% in 2025. They operate large, multi-type fleets and comply with strict international regulations, making them early adopters of enhanced monitoring. Yet their mature processes limit top-line expansion. UAV service providers deliver the steepest curve at a 10.62% CAGR, spurred by last-mile logistics, infrastructure inspection, and emergency response applications that require auditable flight logs for insurance and regulatory approval. Cargo and freight carriers rely on data to optimize route block times and fuel reserves, maintaining steady demand. At the same time, business aviation emphasizes passenger confidence and on-time performance in crowded slots.
Helicopter emergency medical services and offshore operators adopt monitoring for safety-of-life missions where any downtime risks lives or wells, but fleet sizes cap overall volumes. Defense and homeland security agencies invest in custom analytics for mixed manned-unmanned fleets, yet procurement cycles remain long. The accelerating UAV curve signals a structural change: new entrants without legacy systems buy native-cloud analytics, setting expectations that ripple back into traditional airline RFPs.
Geography Analysis
North America Flight Data Monitoring Market
North America sustains leadership through advanced regulatory and operational environments, accounting for 29.95% of 2025 spending. Operators benefit from mature supply chains and the FAA’s Safety Management System regulations, which incentivize comprehensive data capture and benchmarking across carriers. Airlines deploy AI-augmented analytics to boost dispatch reliability, cut fuel burn, and satisfy investors requesting environmental disclosures. The region’s dense legacy fleet also assures a strong retrofit pipeline as carriers swap quick-access recorders for connectivity-enabled units. Collaborative frameworks such as the Aviation Safety Information Analysis and Sharing program amplify the return on each additional data set by revealing macro-level risk trends.
APAC Flight Data Monitoring Market
Asia-Pacific posts the fastest expansion at 7.56% CAGR through 2031, fueled by double-digit annual passenger growth in India and Southeast Asia alongside China’s strategic investments in urban air mobility. Governments fund digital-aviation sandboxes, easing the certification burden for aircraft with standardized monitoring devices. Low-cost carriers in the region use fuel-optimization modules to defend razor-thin margins. At the same time, full-service airlines deploy predictive maintenance to preserve schedule integrity during rapid fleet ramp-ups. National vision plans often tie air-traffic expansion to sustainability metrics, giving flight data monitoring an essential role in validating carbon-reduction claims.
Europe Flight Data Monitoring Market
Europe maintains steady uptake due to EASA’s risk-based oversight approach. The Data4Safety expansion in October 2024 integrated nine additional member states and eight airports, dramatically enlarging the pan-European safety data pool. Airlines align monitoring investments with environmental policies that price carbon and reward fuel efficiency. GDPR compliance remains a hurdle, but vendors address this through privacy-by-design architectures, encouraging broader participation. Cross-border operations benefit from common technical standards, allowing low-cost carriers to allocate aircraft anywhere in their networks without reengineering hard-wired data modules.

Regulatory Landscape
Regulatory requirements continue to formalize flight data monitoring as part of operator safety management systems. ICAO Annex 6 links Flight Data Analysis Programmes (FDAP) to aircraft weight thresholds, including mandatory FDAP for aeroplanes above 27,000 kg. The global baseline has also been reinforced by ICAO real-time distress tracking (position reporting every minute in distress from January 2025) and by the FAA cockpit voice recorder requirement moving to 25 hours (effective May 2024). In the United States, FAA activity also includes administrative actions supporting FOQA program oversight, including the April 2026 Federal Register renewal request for the FOQA information collection (OMB Control Number 2120-0660).
In Europe, EASA has updated guidance that tightens how operators design, run, and evidence an FDM program. ED Decision 2025/020/R was incorporated into EASA Easy Access Rules for Air Operations (Revision 24, March 2026), including clarified AMC/GM for FDM-related provisions and new minimum performance objectives (such as event validation and data retention strategies) that become applicable on January 1, 2028, while existing AMC/GM remains in force until December 31, 2027. These timelines push operators and suppliers toward audit-ready analytics, documented governance, and stronger data quality controls within FDM toolchains.
Value Chain Analysis
The flight data monitoring value chain begins with avionics and recording hardware, including flight data recorders, quick access recorders, data acquisition units, onboard processing, and connectivity, designed to meet aviation performance standards (for example, EUROCAE specifications such as ED-112 and ED-155 for recording and data link performance). Aircraft integration and certification work follows (STCs, line-fit options, and mixed-fleet interoperability). The chain then moves to data extraction and transport, including wireless offload, SATCOM/cellular downlink, and secure gateways, before reaching analytics consumption through software platforms and managed services embedded into the operator safety management system. The final step is operationalization, where safety teams, flight operations, maintenance control, and training organizations convert events and trends into risk controls, procedure updates, and evidence-based training inputs.
A visible shift is the migration from manual, post-flight file handling toward automated, cloud-native platforms that fuse FDM with maintenance, fuel, and crew systems using API-first integration to reduce vendor lock-in. This has expanded the role of software providers and data-exchange ecosystems alongside traditional OEMs and Tier-1 avionics suppliers, with third-party benchmarking and de-identified data sharing (for example, Aerobytes positioning around large multi-operator fleets) supporting cross-operator safety learning. At the same time, collaborations between data management specialists and MROs, such as Teledyne Controls partnering with MTU Maintenance (announced October 2025) to automate flight data flows into engine health monitoring workflows, show how FDM value increasingly monetizes through predictive maintenance outcomes rather than exceedance reporting alone.
Competitive Landscape
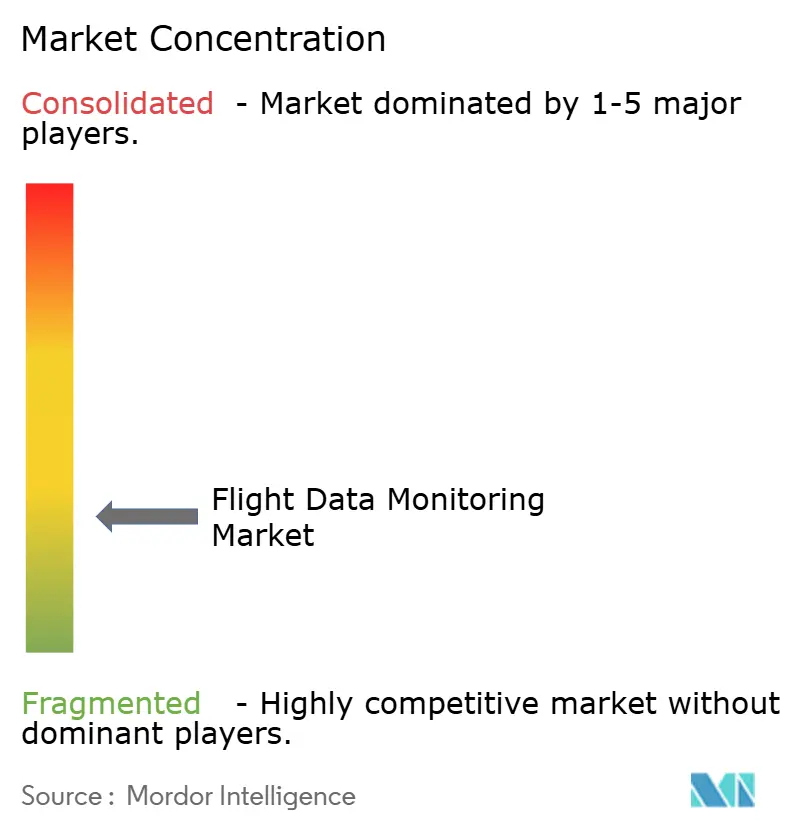
The flight data monitoring market remains fragmented. Established aerospace suppliers, including Honeywell, Safran, and GE Aerospace, exploit scale advantages and deep certification expertise to bundle hardware, analytics, and services. Honeywell announced that the spin-off of its Aerospace division by 2026 will allow a tighter focus on electrification, autonomy, and data-driven services. Strategic partnerships characterize recent moves: Honeywell and NXP co-develop AI-capable processors for cloud-connected cockpits; Safran acquires Collins Aerospace’s actuation business to integrate flight-control data streams with its analytics stack; GE Aerospace teams with Kratos Defense to embed monitoring sensors in affordable UAV propulsion units.
Mid-tier companies reposition portfolios through divestiture and rebranding. L3Harris exited its Commercial Aviation Solutions business for USD 800 million, forming Acron Aviation with a dedicated 1,400-person workforce focused on training, avionics, and data analytics. These shifts illustrate a broader convergence where hardware specialists absorb analytics firms and vice versa, striving for full-stack offerings that comply with rising regulatory complexity. New entrants target high-growth niches such as urban air mobility, helicopter emergency medical services, and cargo drones, leveraging software agility and close customer loops to stand out against conglomerates. Regulatory depth increasingly determines competitive positioning. Vendors able to navigate simultaneous FAA, EASA, and ICAO requirements capture a disproportionate share because airlines prefer turnkey compliance. Cloud-native analytics lower switching costs, permitting operators to layer best-of-breed modules atop legacy sensors. Yet this openness also intensifies price competition at the lower end, pushing hardware margins downward. Overall, the market exhibits tightening concentration around a cluster of platform players whose combined share approaches two-thirds of revenue, though regional and application-specific niches moderate total fragmentation.
Flight Data Monitoring Industry Leaders
Teledyne Controls (Teledyne Technologies Incorporated)
Honeywell International Inc.
Safran SA
Curtiss-Wright Corporation
FLYHT Aerospace Solutions Ltd.
- *Disclaimer: Major Players sorted in no particular order
Flight Data Monitoring Market Companies Covered in this Report
- Teledyne Controls (Teledyne Technologies Incorporated)
- Honeywell International Inc.
- L3Harris Technologies, Inc.
- Safran SA
- Curtiss-Wright Corporation
- Flight Data Systems
- FLYHT Aerospace Solutions Ltd.
- Metro Aviation
- Brazos Safety Systems, LLC
- Groupe NSE
- Gogo Business Aviation (Gogo Inc.)
- Airbus SE
- General Electric Company
- Collins Aerospace (RTX Corporation)
- Spidertracks Ltd. (Vellox Group)
- Scaled Analytics Inc.
- Aerobytes Ltd.
- Helinalysis Ltd.
- Leonardo S.p.A

Market Opportunities and Future Outlook
A near-term whitespace is helping operators move from compliance-focused monitoring to integrated safety risk management and training feedback loops that regulators and industry bodies increasingly emphasize. ICAO Annex 6 ties FDAP to the operator SMS, while EASA requirements for CAT operators (ORO.AOC.130) and the 2025 EASA AMC/GM updates (ED Decision 2025/020/R, compiled into the March 2026 Easy Access Rules) raise expectations for FDM program performance. Those updates cover governance topics such as event validation and data retention with an applicability date of January 1, 2028. Vendors that package audit-ready workflows, non-punitive program tooling, and standardized reporting can reduce operator program friction, particularly for mixed fleets and for operators that rely on outsourced analytics services.
Another growth lane is de-identified, network-level safety benchmarking and data normalization, where participation creates practical value beyond a single operator dataset. IATA runs the Flight Data eXchange (FDX) as a global, de-identified benchmark program, creating demand for tools that map disparate recorder outputs into common taxonomies and automate secure submission. In parallel, industry moves toward real-time or near-real-time connectivity and cloud processing, visible in initiatives such as FLYHT Aerospace Solutions and One Stop Systems collaborating on 5G-enabled AFIRS Edge hardware (announced January 2024), broaden addressable use cases from post-flight review to faster anomaly triage and maintenance planning. These opportunities align with the market mix shift toward on-ground analytics platforms and software layers that unify safety, fuel, and maintenance insights across fleets, increasing the importance of interoperability, cybersecurity controls, and scalable analytics operations.
Recent Industry Developments in Flight Data Monitoring Market
- April 2026: The FAA initiated a renewal request for OMB approval of the FOQA information collection (OMB Control Number 2120-0660), maintaining the administrative framework that supports voluntary, data-driven safety programs. The action reinforces the role of structured flight data collection and analysis in US operator oversight, strengthening demand for compliant data handling, governance, and analytics workflows across airline FOQA/FDM toolchains.
- November 2025: flydubai partnered with GE Aerospace to deploy Safety Insight and FlightPulse software to enhance flight data monitoring and predictive analytics across its mixed Boeing and Airbus fleet. The program reflects airlines consolidating safety and operational analytics into unified digital platforms that can normalize data across diverse aircraft and recorder configurations.
- November 2024: Honeywell and Curtiss-Wright announced collaboration on the Honeywell Connected Recorder-25 (HCR-25), a 25-hour CVR/FDR aligned to the 2024 FAA Reauthorization Act cockpit voice recorder requirement. The development supports a retrofit and forward-fit cycle for next-generation recorders and accelerates adoption of connected recording architectures that can feed broader flight data monitoring and compliance programs.


Flight Data Monitoring Market Report Scope and Research Methodology
Market Definition and Coverage
For this methodology, the flight data monitoring market covers the tools and services used to collect, transmit, store, and analyze aircraft flight parameters so operators can manage safety and operational performance across active fleets.
Scope exclusions: We exclude accident investigation only black box programs and generic aircraft connectivity equipment when it is not sold or contracted for an FDM use case.
Segments Covered in This Report
- By Installation Type
- Onboard
- On-ground
- By Platform
- Fixed-wing
- Rotary-wing
- Unmanned Aerial Vehicles (UAV)
- By Component
- Hardware
- Software and Analytics
- Services
- By End User
- Commercial Airlines
- Cargo and Freight Operators
- Business Jet Operators
- Helicopter EMS and Offshore Services
- Defense and Homeland Security
- UAV Service Providers
- By Geography
- North America
- United States
- Canada
- Mexico
- Europe
- Germany
- United Kingdom
- France
- Russia
- Rest of Europe
- Asia-Pacific
- China
- Japan
- India
- South Korea
- Rest of Asia-Pacific
- South America
- Brazil
- Rest of South America
- Middle East and Africa
- Middle East
- Saudi Arabia
- United Arab Emirates
- Rest of Middle East
- Africa
- South Africa
- Rest of Africa
- Middle East
- North America
Data Sources, Market Sizing, and Validation
Desk Research
Desk work starts by mapping what gets counted as FDM revenue and where it sits in the aviation value chain, and then converting that map into measurable inputs. We pull foundational demand signals from public sources such as FAA and EASA safety publications, ICAO guidance where relevant, aircraft fleet and deliveries statistics from OEM and regulator dashboards, and aviation occurrence and safety databases such as the NTSB docket summaries.
Next, we use company annual reports, investor decks, and product documentation to understand how FDM is packaged as software subscriptions, analytics services, and recorder or sensor related offerings. Trade association releases and reputable aviation press help confirm the timing of mandates, retrofit cycles, and airline operating trends. Where needed, paid subscriptions are used only for company financials and intelligence, news screening, aviation asset databases (aircraft and engine fleet counts), and patent databases to track feature coverage and adoption. The sources listed here are illustrative, and many other public and proprietary references were also used for data collection, validation, and clarification.
Primary Interviews and Surveys
Primary work focuses on checking adoption and spending logic with people close to procurement and deployment decisions, including airline safety teams, flight operations leaders, MRO and retrofit specialists, and solution integrators. For a global market like this, we balance views across major fleet regions and then use follow up calls to close gaps on pricing structure, attach rates on retrofit programs, and the share of analytics delivered as managed services versus in house tools.
Distribution of primary research fieldwork respondents
| Company type | Respondent position | Region |
|---|---|---|
| Top tier: 27% | CXOs: 12% | APAC: 38% |
| Mid tier: 59% | Functional/Unit leaders: 33% | EMEA: 36% |
| Smaller Players: 14% | Managers: 55% | Americas: 26% |
Market-Sizing & Forecasting
Sizing is built first with a top-down approach where global in service fleet levels, aircraft utilization (flight hours and cycles), and regulatory and voluntary program penetration are used to reconstruct the addressable demand pool for FDM. Once that demand pool is set, spending is modeled using a practical price structure that reflects common packaging, such as recurring analytics or monitoring fees, one time installation and retrofit spending, and ongoing support.
To avoid relying too heavily on one assumption, we corroborate results using selective bottom-up approximations, including sampled pricing checks, channel discussions on retrofit throughput, and supplier side revenue splits between hardware, software, and services. Inputs that typically matter in this market include fleet growth by aircraft class, retrofit rates versus line fit on new deliveries, regional safety compliance momentum, the mix shift toward connected data transfer, and renewal behavior for analytics subscriptions. Forecasts are produced using scenario analysis supported by near term fleet outlook and utilization expectations shared by interviewees, and then the model is rolled forward year by year so that adoption, price movement, and service mix can be traced back to clear levers. When a bottom-up data point is missing for a region or aircraft class, the gap is handled through penetration proxies tied to comparable fleet profiles and then rechecked with expert feedback before finalizing.
Data Validation & Update Cycle
Validation is done through several checks that look for inconsistencies before numbers are signed off. We compare model outputs against independent signals such as active fleet counts, utilization trends, public safety program references, and the timing of major retrofit waves, and then investigate any variance that does not align with the narrative.
A second analyst reviews assumptions, formulas, and year over year movements, and follow up outreach is triggered when an interview insight conflicts with desk findings or when a sensitivity test shows unusual dependence on one variable. The report is refreshed annually, and interim updates are made when material events can change fleet activity, compliance timing, or pricing expectations. Before delivery, a final pass is completed to ensure the latest public information and confirmed expert inputs are reflected.
Mordor Intelligence's Flight Data Monitoring Market Estimate Compared With Other Published Estimates
Published market sizes for flight data monitoring do not always match, even when they look like they are talking about the same topic. The differences usually come from how each study draws the line around what counts as FDM revenue, what year is treated as the current baseline, and how adoption is linked to real fleet activity.
Fleet in service levels, utilization patterns, and safety program uptake are the evidence checks that keep Mordor Intelligence's estimate anchored to active operator spending, instead of broad avionics or generic connectivity budgets being blended in.
Benchmark comparison
| Source | Market Size | Gaps in Research Methodology |
|---|---|---|
| Mordor Intelligence | USD 6.23 B (2026) | |
| Industry Publisher A | USD 3.27 B (2026) | This estimate appears to use a narrower revenue pool centered on FDM and FOQA programs, with limited inclusion of adjacent onboard hardware and managed monitoring services that are often bundled into operator contracts. |
| Advisory Firm B | USD 1.63 B (2025) | The lower figure is consistent with tighter scoping around core FDM software and services, plus a different base year, which can understate spend in years where retrofit activity and subscription renewals are rising. |
The spread in values is mainly explained by boundary choices and timing, not by a disagreement that demand exists. When scope is tied back to observable fleet and utilization signals, and pricing is aligned to how airlines buy analytics and support, the outcome is easier to reproduce and easier for buyers to adjust to their own fleet mix.


Key Questions Answered in the Report
What is the current size of the flight data monitoring market?
The flight data monitoring market stands at USD 6.23 billion in 2026.
How fast is the flight data monitoring market expected to grow?
The market is projected to expand at a 6.97% CAGR, reaching USD 8.72 billion by 2031.
Which installation segment shows the strongest growth?
Ground-based analytics systems exhibit the highest growth at an 8.01% CAGR, reflecting the shift toward centralized AI platforms.
Why is Asia-Pacific considered the fastest-growing region?
Asia-Pacific combines rapid fleet expansion, smart-city drone programs, and supportive digital-aviation policies, leading to a forecasted 7.56% CAGR.
What makes UAV service providers an attractive end-user segment?
Clear regulatory pathways for commercial drones and the need for auditable flight logs drive a 10.62% CAGR among UAV operators.
How do airlines gain ROI from flight data monitoring?
Predictive maintenance can cut maintenance costs up to 30% and fuel-analytics programs routinely save 1–3% in consumption, offsetting system investments within months.
Page last updated on:





