
Fintech Lending Market Size and Share
Market Overview
| Study Period | 2021 - 2032 |
|---|---|
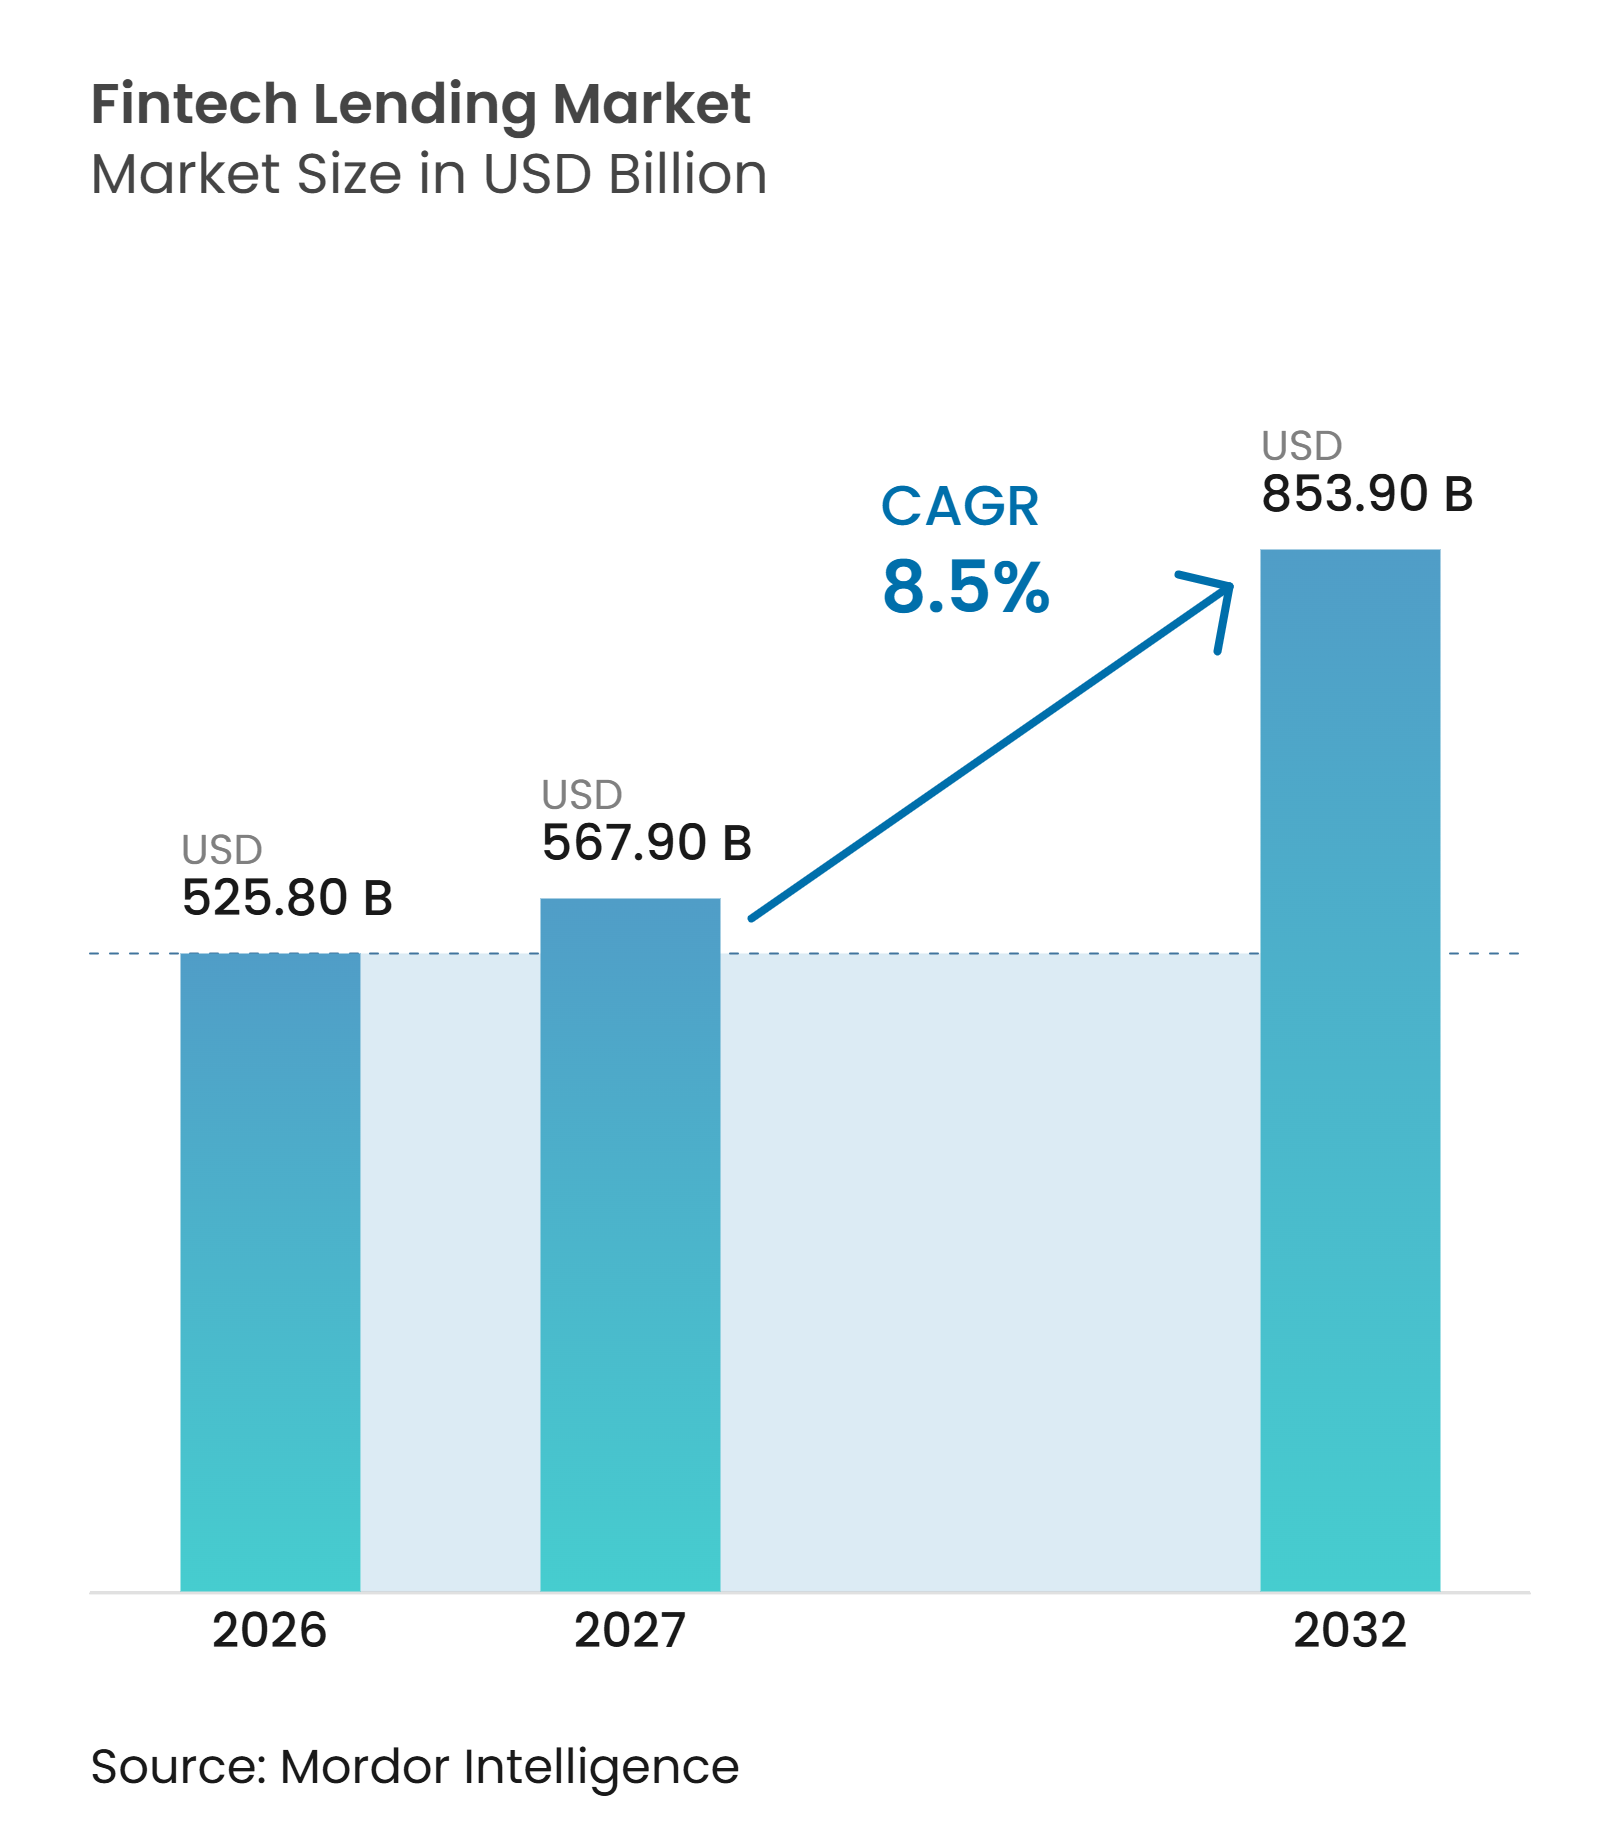
| Market Size (2027) | USD 567.90 Billion |
| Market Size (2032) | USD 853.90 Billion |
| Growth Rate (2027 - 2032) | 8.50 % |
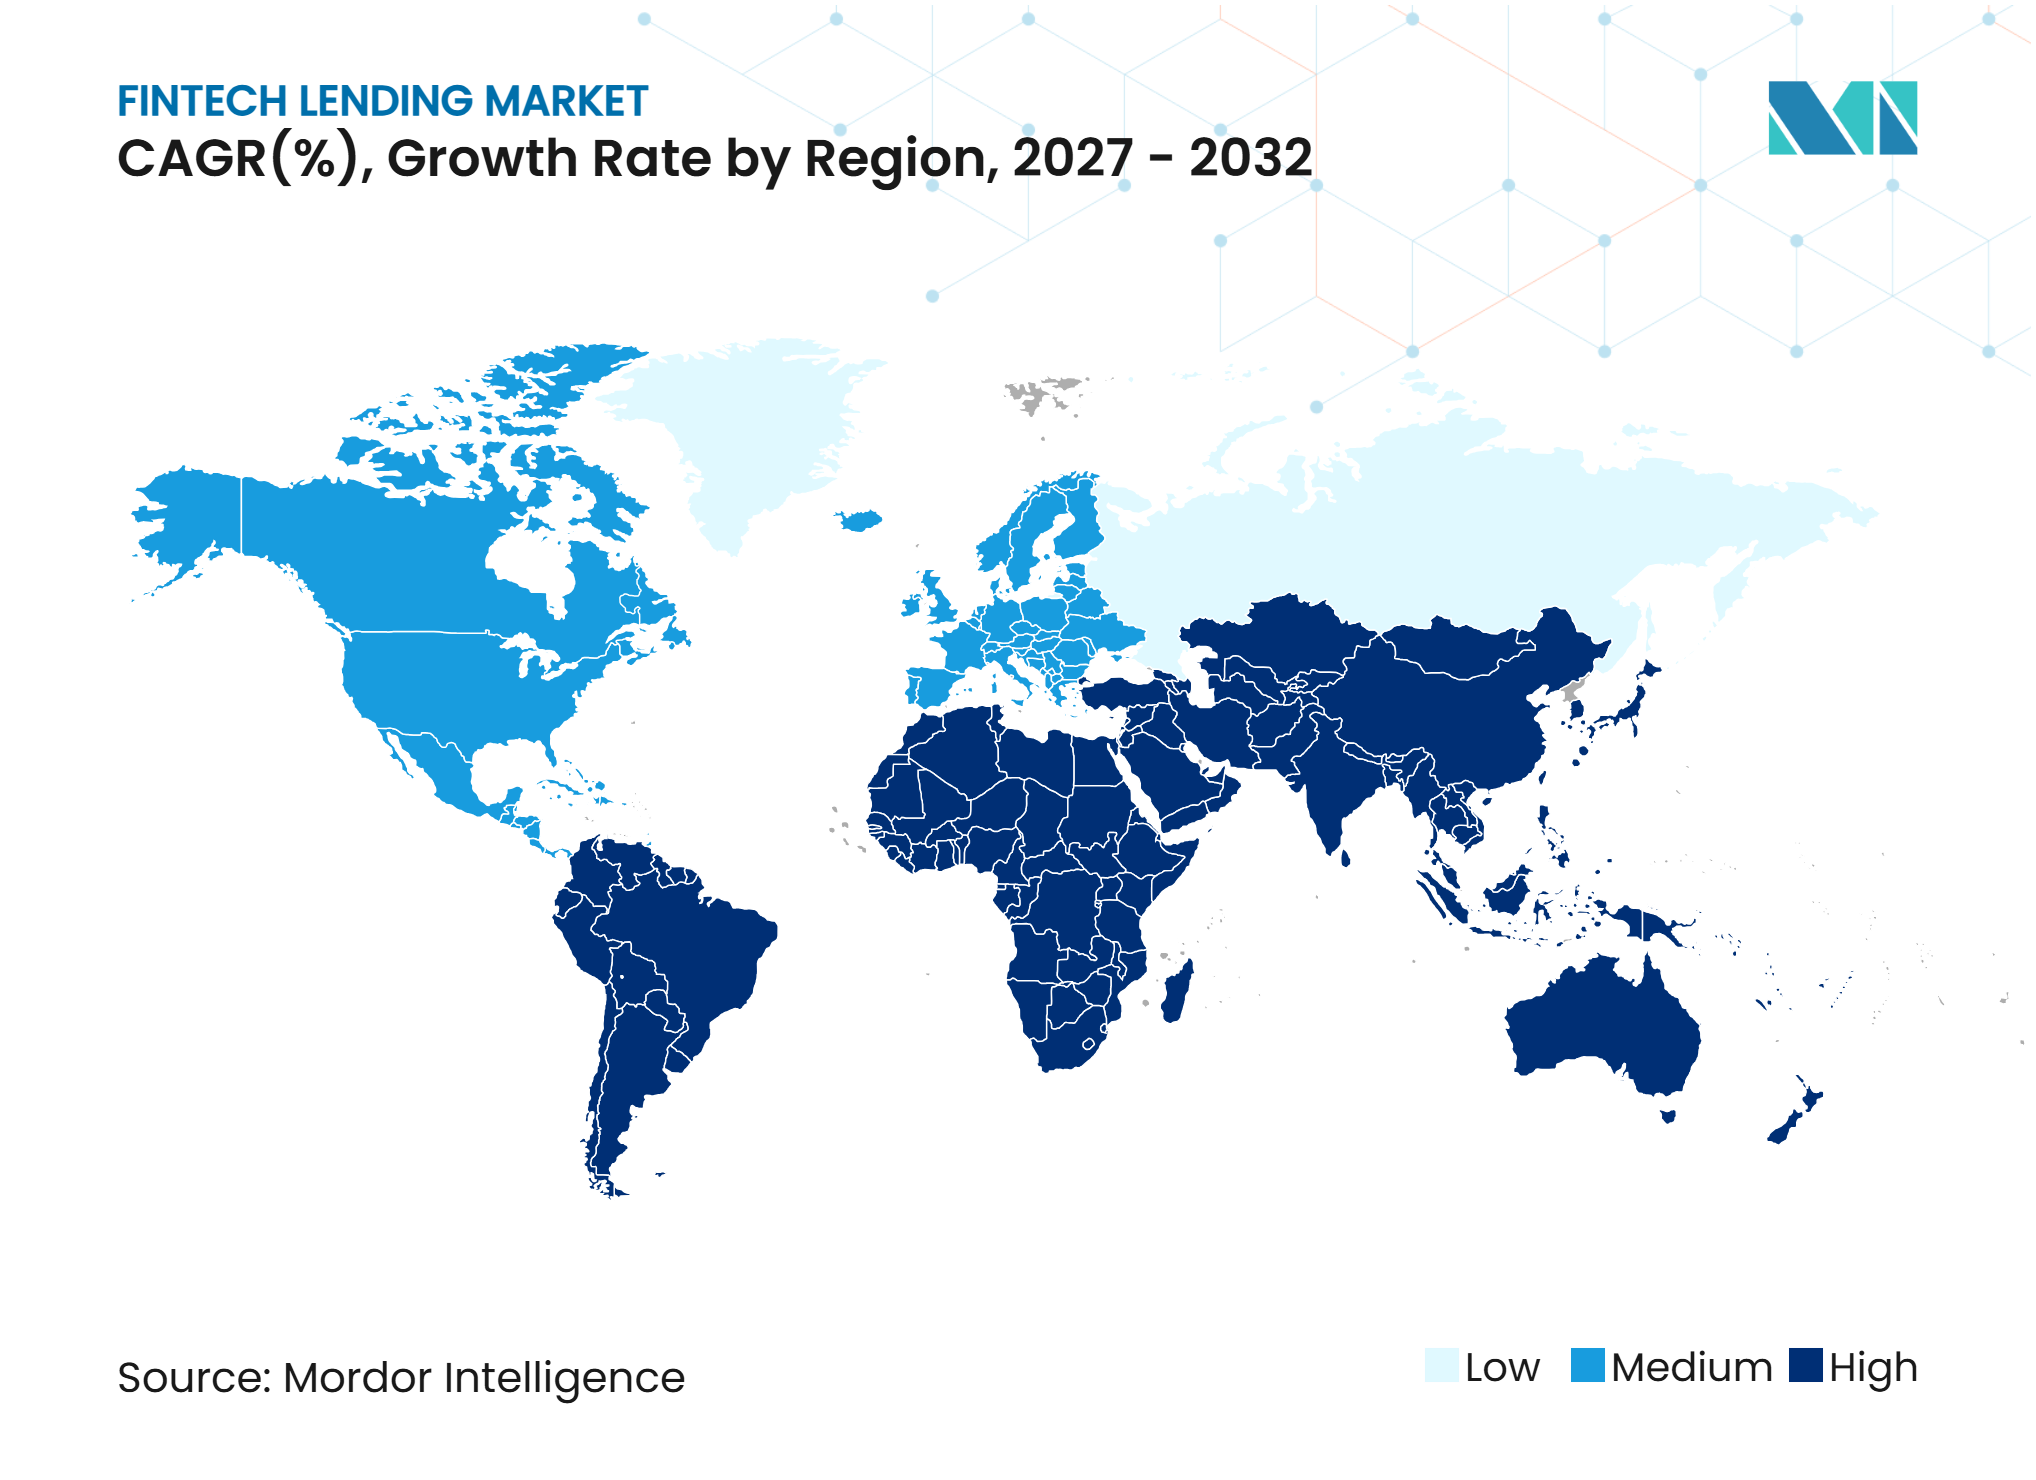
| Fastest Growing Market | Middle East and Africa |
| Largest Market | Asia-Pacific |
| Market Concentration | Low |
Major Players *Disclaimer: Major Players sorted in no particular order Image © Mordor Intelligence. Reuse requires attribution under CC BY 4.0. | |
Fintech Lending Market Analysis by Mordor Intelligence
The Fintech Lending Market size was valued at USD 525.80 billion in 2026 and is estimated to grow from USD 567.90 billion in 2027 to reach USD 853.90 billion by 2032, at a CAGR of 8.5% during the forecast period (2027-2032).
The fintech lending market is moving credit origination from branch-led processes toward digital platforms that can assess borrowers and make decisions in real time. Demand is supported by borrowers and small businesses that need quicker access to credit, while platforms use transaction histories to improve underwriting. The fintech lending market also benefits from payment infrastructure, digital identity tools, and consent-based financial data sharing that reduce processing time. Competition increasingly depends on the ability to secure lower-cost funding, build reliable risk controls, and distribute loans through merchant and software platforms. Portfolio quality and wholesale funding conditions remain important limits on expansion when credit stress rises.
Key Report Takeaways
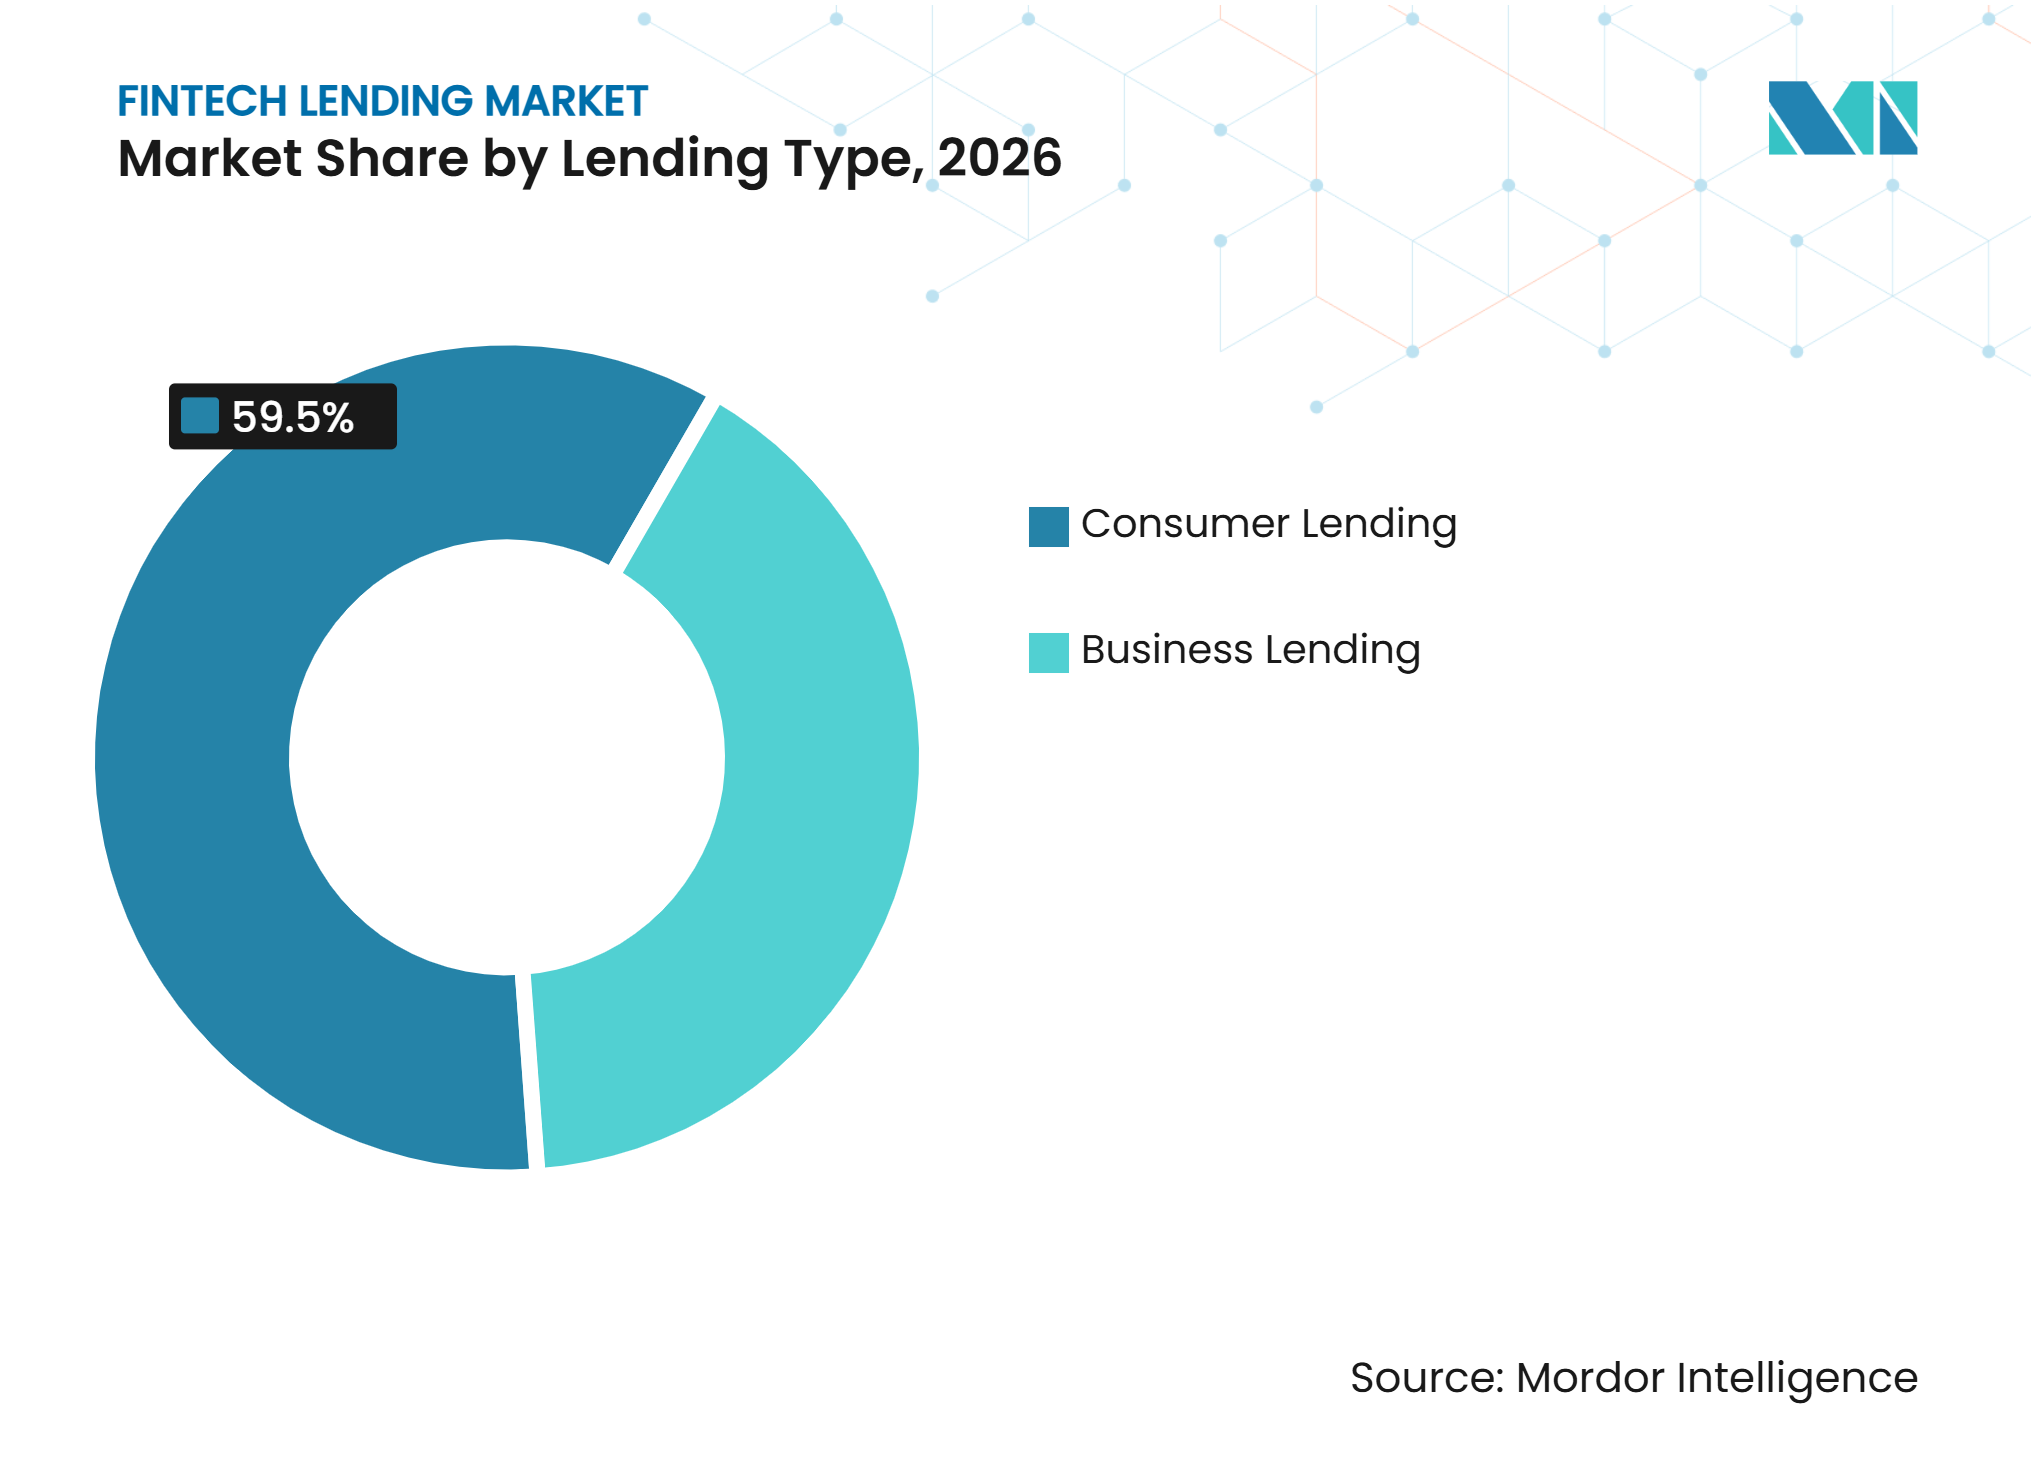
- By lending type, consumer lending held 59.5% of the fintech lending market share in 2026, while business lending is projected to grow at an 11.3% CAGR through 2032.
- By borrower type, individual borrowers held 57.8% of the fintech lending market share in 2026, while small and medium-sized enterprises are projected to grow at a 12.1% CAGR through 2032.
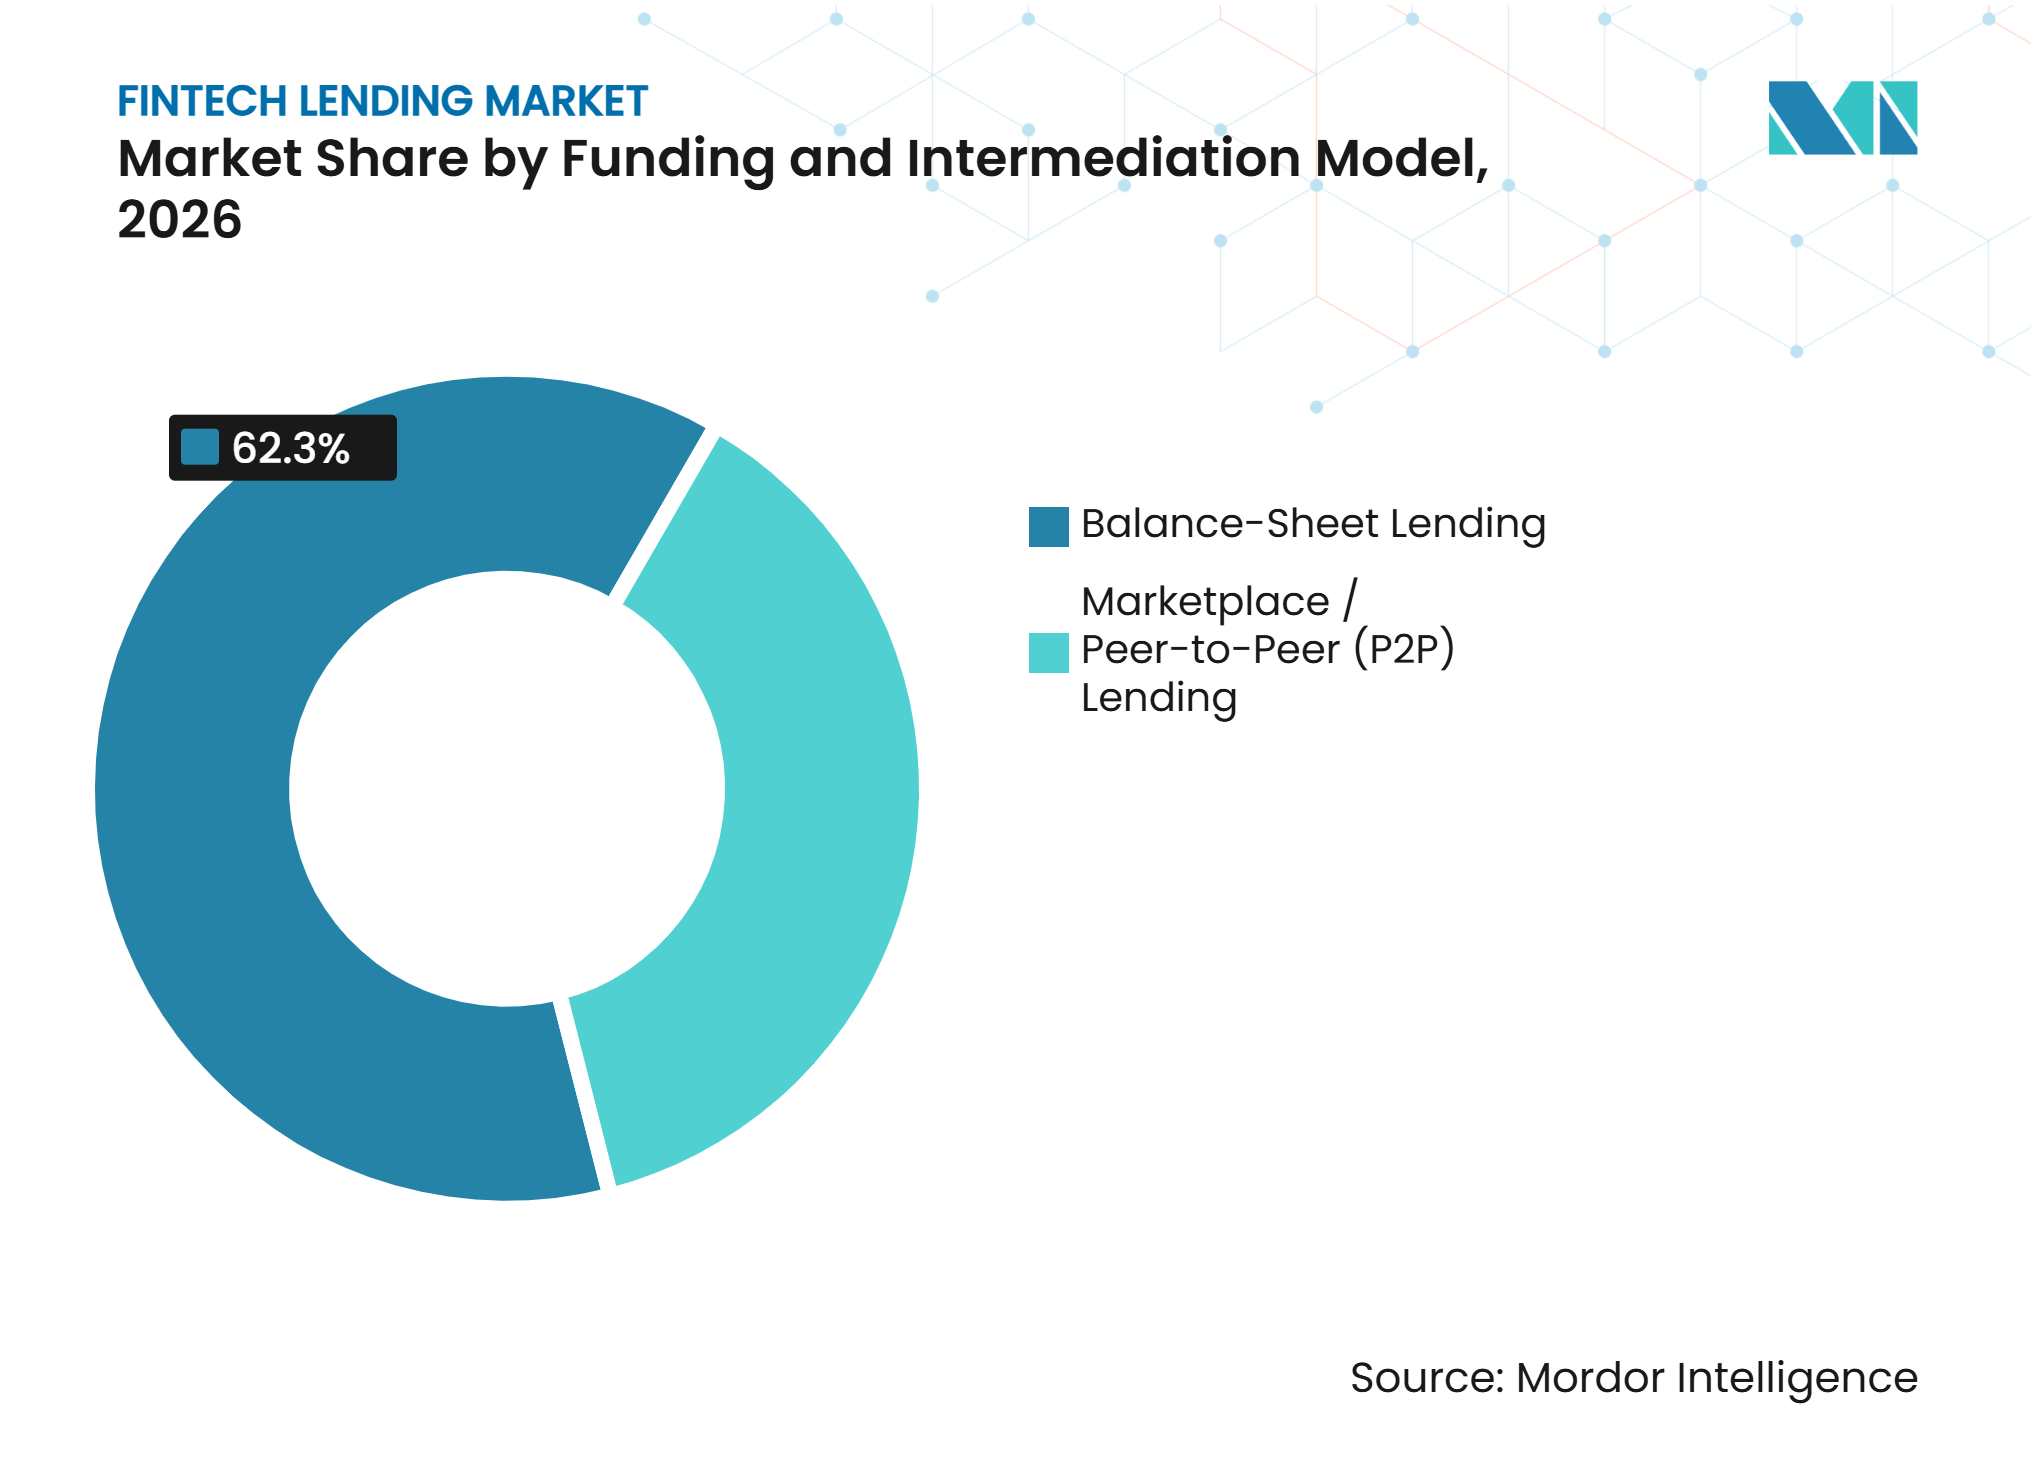
- By funding and intermediation model, balance-sheet lending captured 62.3% of the fintech lending market share in 2026, while marketplace and peer-to-peer lending is projected to grow at a 10.4% CAGR through 2032.
- By institutional type, pure-play fintech and digital nonbank financial company platforms held 49.7% of the fintech lending market share in 2026, while bank-originated fintech-facilitated and co-lending arrangements are projected to grow at a 12.5% CAGR through 2032.
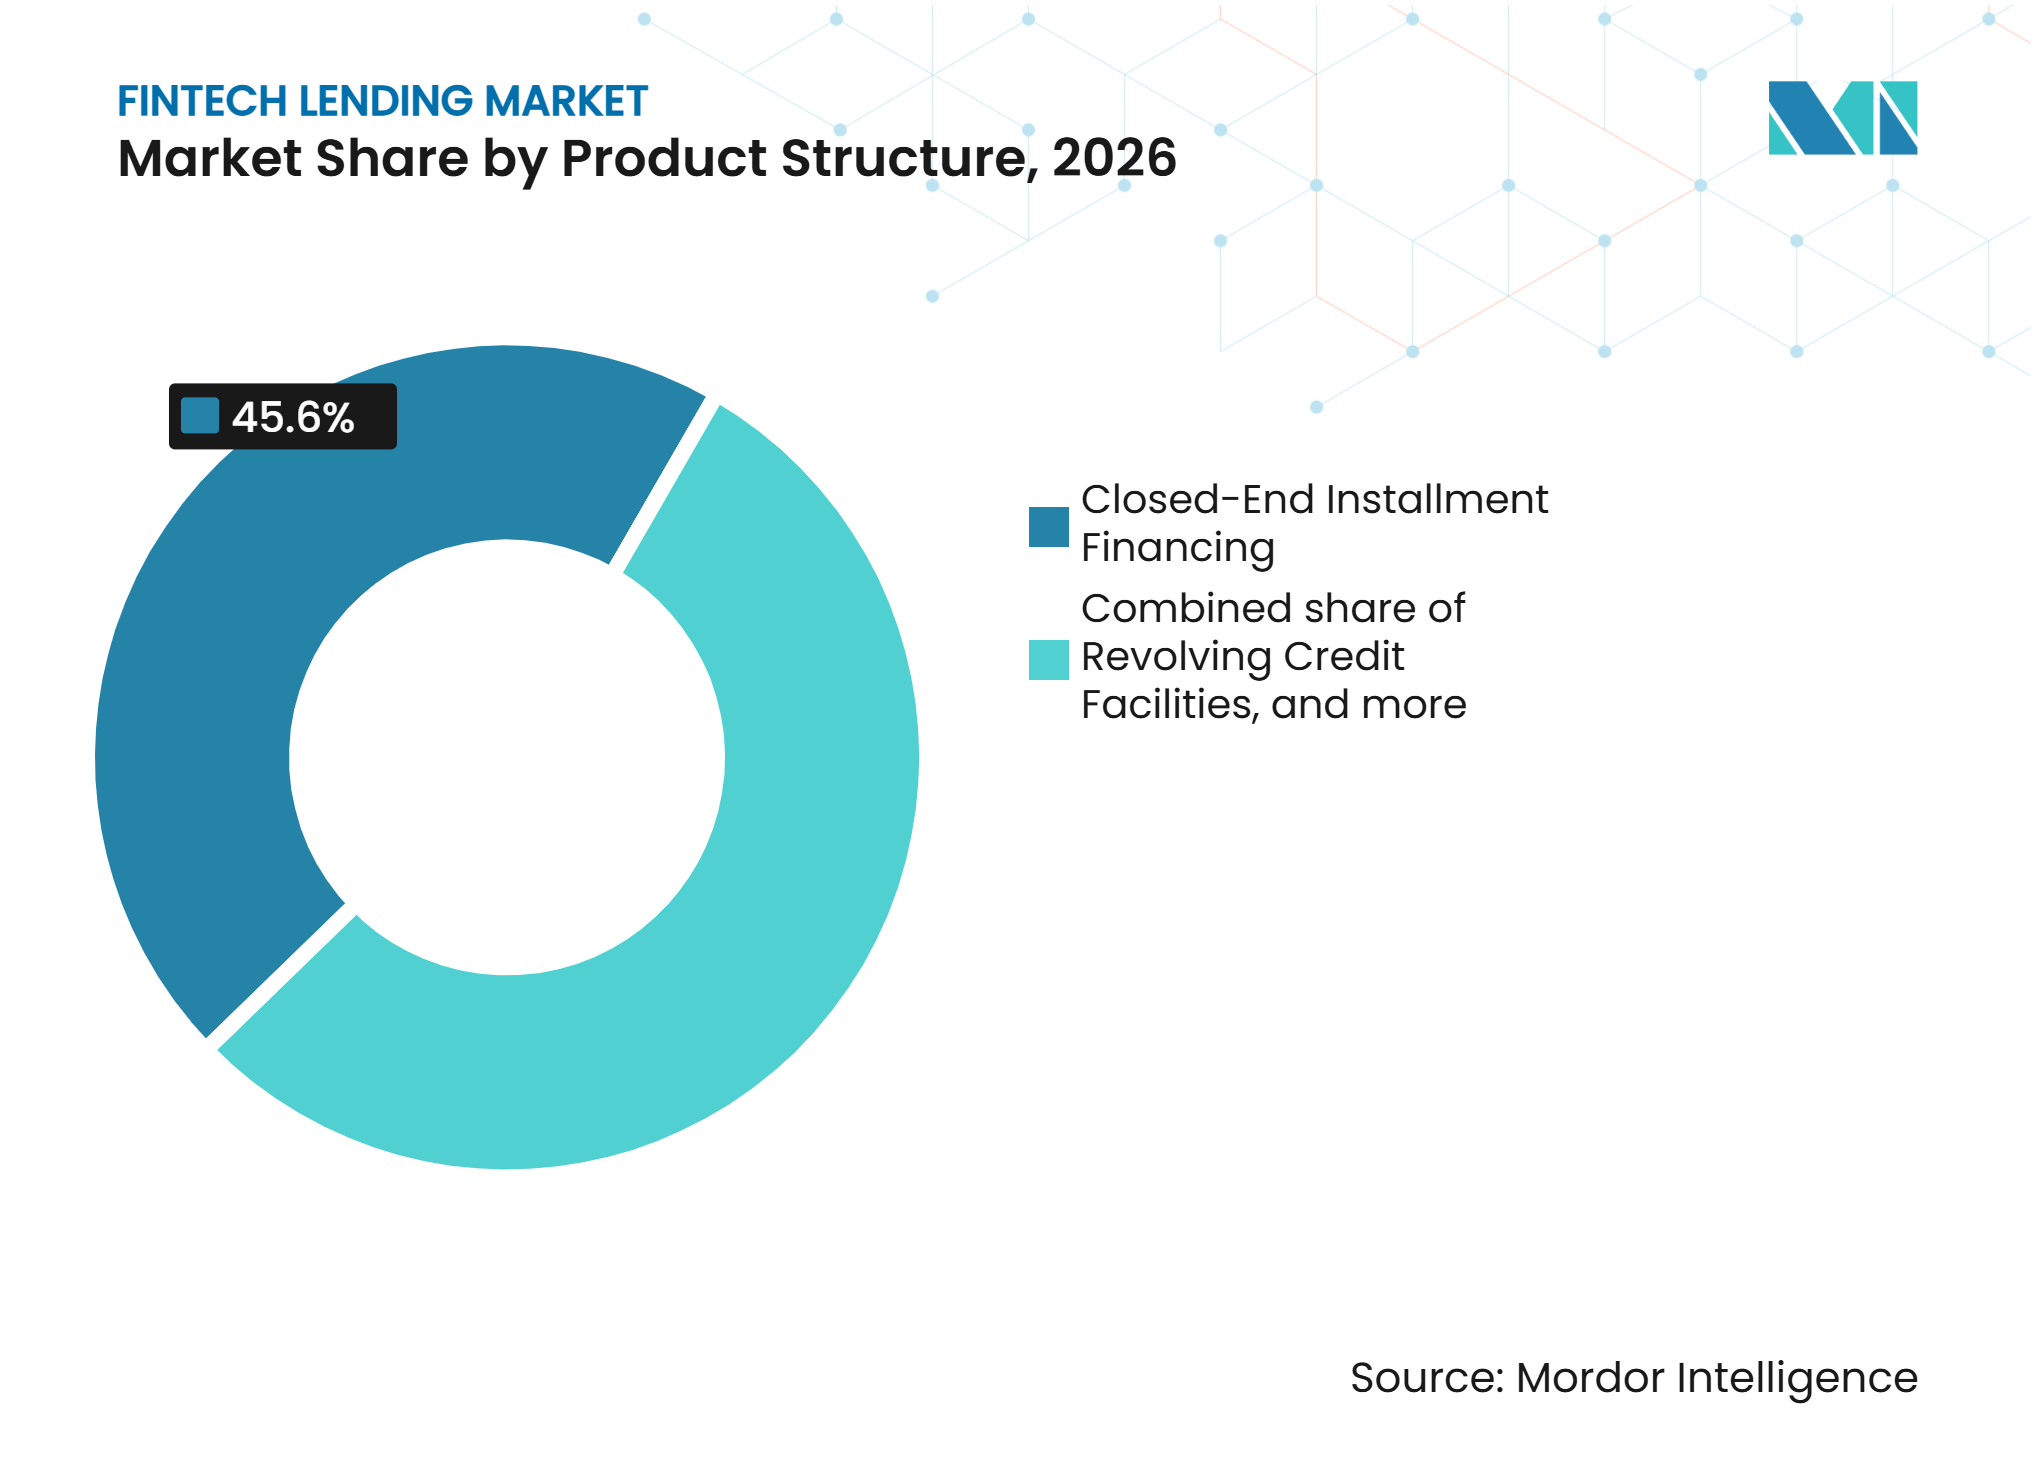
- By product structure, closed-end installment financing held 45.6% of the fintech lending market share in 2026, while revenue-based financing is projected to grow at a 13.8% CAGR through 2032.
- By distribution channel, direct digital channels held 38.2% of the fintech lending market share in 2026, while embedded commerce and point-of-sale platforms are projected to grow at a 12.9% CAGR through 2032.
- By geography, Asia-Pacific captured 39.8% of the fintech lending market share in 2026, while the Middle East and Africa is projected to grow at a 13.4% CAGR through 2032.
Note: Market numbers in this report are based on Mordor Intelligence's proprietary estimation framework, which combines nine months of actuals with Q4 projections for base year 2026.
Market Trends and Insights
Drivers Impact Analysis of Fintech Lending Market*
| Driver | (~) % Impact on CAGR Forecast | Geographic Relevance | Impact Timeline |
|---|---|---|---|
| Expansion of Embedded Lending and Digital Credit Distribution Channels | +1.9% | Global, led by North America, Europe, and Asia-Pacific | Medium term (2-4 years) |
| AI-Enabled Credit Underwriting and Automated Loan Processing | +1.6% | Global, with early leaders in North America and Asia-Pacific | Long term (≥ 4 years) |
| Unmet Credit Demand Among SMEs and Underserved Borrower Segments | +1.4% | Asia-Pacific, Middle East and Africa, South America | Long term (≥ 4 years) |
| Growth of Digital Payments, E-KYC and Open Banking Infrastructure | +1.2% | Global, accelerating in Asia-Pacific and Middle East and Africa | Medium term (2-4 years) |
| Increasing Use of Alternative Data for Credit Risk Assessment | +0.9% | Global | Long term (≥ 4 years) |
| Expansion of Institutional Funding and Loan Securitization Channels | +0.7% | North America and Europe | Short term (≤ 2 years) |
| Source: Mordor Intelligence | |||
Expansion of Embedded Lending and Digital Credit Distribution Channels
Embedded lending places credit inside the operating environment of a nonfinancial platform, reducing the need for a separate borrower application. Shopify Capital originated USD 4.2 billion in merchant cash advances and loans during 2025, using real-time platform revenue data for underwriting[1]. The model gives platforms a view of sales activity that can support repayment schedules linked to merchant settlement flows. Those repayment structures can reduce behavioral default risk compared with fixed schedules because deductions track cash receipts. The fintech lending market is therefore finding new distribution routes in commerce, payments, and software systems where merchants already conduct daily activity. It also changes the customer relationship because the financing offer can appear when a merchant is already managing sales or payments. This can reduce the separation between credit distribution, payment acceptance, and day-to-day business operations. Lenders still need transparent terms so borrowers understand how settlement-linked deductions affect available cash.
AI-Enabled Credit Underwriting and Automated Loan Processing
AI-enabled underwriting allows lenders to assess transaction-level behavior instead of relying only on static credit bureau records. Plaid introduced LendScore 2 in 2026, a scoring family trained on nearly 1 billion transactions that reported 42% greater predictive power than traditional credit data alone and can return decisions in under 2 seconds from consented bank data. Cross River reported that Upstart recorded 154% year-over-year origination growth in the second quarter of 2025 after a model update lifted approval conversion from 15% to 24%[2]. A 2026 review of 118 peer-reviewed studies found that ensemble and hybrid deep-learning approaches consistently outperformed traditional scoring for thin-file borrowers and real-time decisioning. Continuous reassessment of recent account activity can also help lenders update eligibility rather than relying on a single historical score. This approach places greater weight on recent borrower behavior when a lender reviews a new credit request. It can help address thin-file cases where historical bureau records do not fully represent current repayment capacity. The method still depends on reliable customer consent and appropriate controls over the use of account information.
Unmet Credit Demand Among SMEs and Underserved Borrower Segments
The gap between small business funding needs and formal credit access remains a demand base for digital lenders. India’s micro, small, and medium enterprise credit gap was INR 25 lakh crore (USD 278 billion) in March 2025, while only 14% of its MSMEs had formal credit access[3]. In the United States, 29% of small business financing applicants approached online fintech lenders in 2025. The same survey found that 60% of online-lender borrowers faced higher-than-expected borrowing costs, which leaves room for well-funded lenders to compete on price. In Nigeria, Nomba reported a sub-1% nonperforming loan ratio on an NGN 21.3 billion (USD 14.8 million) portfolio by using transaction data from its payment infrastructure for merchant underwriting.
Growth of Digital Payments, E-KYC and Open Banking Infrastructure
Digital identity, payment, and data-sharing systems are shortening processes that previously required several manual checks. India’s Aadhaar-based eKYC system had completed more than 23.93 billion cumulative transactions by 2026, supporting digital customer onboarding at scale[4]. WeMoney Connect launched in October 2026 to create lender-ready borrower files from consented bank transactions within minutes. These rails allow lenders to validate income patterns, recurring obligations, and account activity with borrower consent. They can also support more consistent processing across applications that would otherwise require repeated document collection. Regulatory standards for consent and data protection remain necessary as these systems become more widely used. The fintech lending market gains when verified information can move between borrowers, lenders, and regulated financial institutions with lower friction. This infrastructure can make the fintech lending market more accessible for applicants who can share verified financial records.
Restraints Impact Analysis of Fintech Lending Market*
| Restraint | (~) % Impact on CAGR Forecast | Geographic Relevance | Impact Timeline |
|---|---|---|---|
| Rising Non-Performing Loans and Deteriorating Fintech Loan Portfolio Quality | -0.8% | Asia-Pacific and South America | Short term (≤ 2 years) |
| Dependence on External Funding and Volatility in Institutional Capital Availability | -0.6% | Global, most acute in North America and Europe | Medium term (2-4 years) |
| Divergent Lending Regulations and Consumer Protection Requirements Across Jurisdictions | -0.5% | Global | Long term (≥ 4 years) |
| Incomplete Credit Bureau Reporting and Limited Cross-Lender Data Sharing | -0.4% | Middle East and Africa, South America, and parts of Asia-Pacific | Long term (≥ 4 years) |
| Source: Mordor Intelligence | |||
Rising Non-Performing Loans and Deteriorating Fintech Loan Portfolio Quality
Rapid expansion in unsecured, small-ticket, and short-tenure lending increases fintech lenders' exposure to borrowers with limited repayment capacity, making rising non-performing loans a key restraint on global market growth. Reliance on alternative data, limited credit histories, and automated underwriting can weaken borrower risk assessment, particularly among customers with irregular incomes or high existing debt. Inflation, higher borrowing costs, and economic uncertainty further increase repayment difficulties across markets. For instance, TransUnion reported that United States unsecured personal loan delinquencies of 60 days or more increased to 3.99% in Q4 2025 from 3.57% a year earlier[5]. Rising defaults increase collection expenses, credit-loss provisions, and capital requirements, putting pressure on lender profitability. Consequently, fintech lenders must strengthen underwriting standards, monitor loan performance, and improve collection mechanisms to maintain portfolio quality as lending volumes expand.
Dependence on External Funding and Volatility in Institutional Capital Availability
Many non-bank fintech lenders depend on institutional funding sources, including warehouse facilities, asset-backed securitizations, and forward-flow agreements, rather than customer deposits. This reliance exposes lending capacity and profitability to changes in institutional investor appetite, borrowing costs, and capital-market conditions. For instance, Enova reported an 8.8% cost of funds in Q2 2025, while SoFi reported a 3.36% average rate on interest-bearing deposits, illustrating the potential funding-cost advantage of deposit-funded institutions. In January 2026, Affirm applied to establish an FDIC-insured industrial loan company, while Upstart submitted its national bank charter application in March 2026 and received conditional OCC approval in July 2026. These developments highlight fintech lenders' efforts to diversify funding sources and reduce reliance on external capital, although obtaining a banking charter introduces additional regulatory and compliance requirements.
*Our forecasts treat driver/restraint impacts as directional, not additive. The impact forecasts reflect baseline growth, mix effects, and variable interactions.
Fintech Lending Market Segment Analysis
By Lending Type:
Consumer Credit Anchors Scale, Business Lending Builds VelocityConsumer lending held a 59.5% share of the fintech lending market in 2026, supported by personal loans, buy now, pay later products, and digital cash advances. The Federal Reserve estimated that buy now, pay later providers issued USD 156.7 billion in United States credit during 2025. Fitch Ratings reported record unsecured consumer loan asset-backed securities issuance of USD 25.6 billion in 2025. The segment’s scale reflects the continued shift away from branch-based unsecured credit toward digital origination. Rising subprime activity can nevertheless increase loss exposure when economic conditions weaken.
Business lending is projected to grow at an 11.3% CAGR through 2032 within the fintech lending market. SoFi entered small-business lending in 2025 with fixed loans from USD 2,500 to USD 250,000, 24-hour disbursement, and no origination fees. The Federal Reserve Bank of Kansas City reported that small-business lending grew 13.4% year over year through the third quarter of 2025. Demand and approval rates improved at online lenders while both measures declined at large banks. This creates room for lenders that can pair faster decisions with sound risk control. Small firms can benefit when platforms match loan terms to business cash flow and repayment capacity. The fintech lending market can serve these firms more effectively when eligibility reflects current operating performance.



By Borrower Type:
Individual Borrowers Lead, SMEs Emerge as Strategic PriorityIndividual borrowers held a 57.8% share in 2026, reflecting broad use of digital personal loans, buy now, pay later products, and short-duration credit. United States household debt reached USD 18.8 trillion in the first quarter of 2026, sustaining demand for consumer credit. The Reserve Bank of India stated that more than 70% of fintech loan books were unsecured, with more than half of loans extended to borrowers under 35 years of age. Younger borrowers and borrowers outside major cities are central to the addressable base for digital lenders. The segment also requires careful credit monitoring because unsecured exposure can react quickly to income shocks. Lenders must balance easier access to credit with repayment performance across different consumer cohorts.
Small and medium-sized enterprises are projected to grow at a 12.1% CAGR through 2032. The Federal Reserve found that 29% of United States small business financing applicants used online fintech lenders in 2025. The low level of formal credit access among Indian MSMEs points to a large unmet need. Digital applications can reduce paperwork for businesses that lack traditional financial documentation. Pricing and loan terms remain important because borrowers have reported higher-than-expected costs from online lenders. Large enterprises form a smaller borrower group and commonly use receivables financing, supply-chain credit, and co-lending structures. These arrangements allow fintech platforms to originate credit while institutional partners fund or retain part of the exposure. The fintech lending industry is therefore expanding across borrowers with very different documentation, cash-flow, and funding needs. That breadth makes borrower-specific underwriting and clear product design central to the segment.
By Funding and Intermediation Model:
Balance-Sheet Dominance, Marketplace Lending Regains Institutional ConfidenceBalance-sheet lending held a 62.3% share in 2026, as lenders retained originated loans through warehouse lines, deposits, or dedicated credit facilities. The model gives lenders direct control over origination and borrower relationships. Affirm reported relationships with nearly 200 funding partners across warehouse facilities, asset-backed securities investors, and forward-flow buyers. It also raised more than USD 7 billion through note offerings over 2 years. Funding breadth can be difficult for smaller entrants to establish quickly. This institutional support has helped make fintech-originated credit a recognized asset category. It can also help lenders maintain loan supply when a single funding channel becomes less available. Funding diversity is a material consideration for the fintech lending market because lenders need continuity through changing investor conditions.
Marketplace and peer-to-peer lending is projected to grow at a 10.4% CAGR through 2032. LendingClub reported 68% year-over-year marketplace origination growth in the fourth quarter of 2025. Its digital marketplace bank model combines deposit-funded loan retention with loan sales to institutional investors. This approach seeks to combine stable funding with broader distribution of credit risk. Better secondary-market liquidity and granular borrower information support interest in loan tranches. The model may appeal to platforms that want to preserve flexibility between holding loans and distributing them. It also gives institutional buyers access to pools of loans supported by platform-level borrower information.

By Institutional Type / Originator:
Fintechs Hold the Center, Co-Lending AcceleratesPure-play fintech and digital nonbank financial company platforms held a 49.7% share in 2026. India’s digital lenders disbursed INR 97,381 crore (USD 10.8 billion) in personal loans in the first half of fiscal year 2025-26, up 25% year over year. Big technology platforms have an advantage because their payment and commerce systems generate real-time transaction records. Regulatory attention to data use and market power can limit the speed of new partnerships and product launches. Platform scale remains important, but clear governance is also needed as lending becomes more embedded in digital ecosystems.
Bank-originated fintech-facilitated and co-lending arrangements are projected to grow at a 12.5% CAGR through 2032. The Reserve Bank of India’s final co-lending rules took effect on January 1, 2026, and extended the framework beyond priority-sector lending to all regulated entities and loan types. The rules require at least 10% loan retention and clear disclosure of each party’s role to borrowers. Carlyle Group and Citigroup announced an asset-backed financing partnership for fintech lenders in June 2025. Such structures can combine a fintech’s digital underwriting capability with a bank or institutional investor’s funding capacity. Clear borrower disclosures and retained-risk requirements are important to the durability of these arrangements.
By Product Structure:
Installment Financing Leads, Revenue-Based Financing DisruptsClosed-end installment financing held a 45.6% share in 2026, supported by personal loans, buy now, pay later monthly plans, and small-business term lending. The Federal Reserve estimated that 37% of United States buy now, pay later issuance in 2025 carried annual percentage rate (APR) charges, with Affirm and Block accounting for more than 90% of APR-bearing originations. Longer-term installment plans extend digital financing to higher-value purchases, while revolving credit facilities provide businesses with ongoing access to working capital. Receivables-based products also support invoice factoring and supply-chain financing in business-to-business commerce. These structures provide borrowers with alternatives through fixed repayment schedules, revolving credit access, and financing linked to outstanding receivables.
Revenue-based financing is projected to grow at a 13.8% CAGR through 2032. Shopify Capital purchased USD 4.2 billion of loans and merchant cash advances to Shopify merchants in 2025, demonstrating the scale of embedded merchant financing, although this figure includes multiple financing products rather than exclusively revenue-based financing. In August 2025, U.S. Bank subsidiary Elavon partnered with Liberis to launch Quick Capital, offering revenue-based financing access to more than 275,000 United States merchants through its merchant platform. These developments demonstrate how payment platforms and merchant transaction data are expanding embedded financing options for small businesses. Repayment structures linked to actual sales can provide greater flexibility for merchants managing variable cash flows.
By Distribution Channel:
Direct Digital Anchors Scale, Embedded Commerce Reshapes AccessDirect digital channels held a 38.2% share of the fintech lending market in 2026. These channels include lender-operated applications, websites, and standalone loan platforms. SoFi’s direct digital model had a loan portfolio of over USD 42 billion in the first quarter of 2026, supported by USD 40 billion in deposits. Digital banking and payment platforms, business software platforms, and loan marketplaces serve different points in the borrower journey. They enable lenders to reach consumers, merchants, and businesses through established online services. Direct digital lending continues to benefit from users who prefer online applications to physical branches.
Embedded commerce and point-of-sale platforms are projected to grow at a 12.9% CAGR through 2032. Toast, BILL, and DoorDash distribute financing offers within software environments used by merchants. Parafin’s underwriting uses data from more than 2 million small businesses to support those embedded offers. Worldpay introduced an Embedded Finance Engine in September 2025 that lets platform partners add lending, banking, and commercial card products. The fintech lending industry faces a changing acquisition model because scaled software platforms can become lending channels. As this occurs, underwriting quality and funding cost may become more important than a lender’s standalone digital reach. It also increases the value of long-term relationships with software and payment partners.
Geography Analysis
Asia-Pacific: The Market’s Structural Anchor
Asia-Pacific held a 39.8% share of the fintech lending market in 2026. The region combines large underserved borrower groups with mobile-first payment systems and integrated commerce platforms. Southeast Asia’s digital lending loan book was estimated at USD 116 billion in 2026. In China, platforms such as WeBank and Ant Group leverage transactional and behavioral data from their digital ecosystems to support credit assessment and lending decisions. In India, the Reserve Bank of India's co-lending framework, effective January 2026, expanded bank and non-bank financial company partnerships beyond priority-sector lending to a broader range of loan categories. The framework provides additional funding channels for non-bank lenders while establishing requirements for risk sharing, borrower disclosures, and loan servicing. These developments strengthen digital credit distribution and support the expansion of fintech lending across consumer and business segments.
Middle East and Africa: The Fastest-Growing Frontier
The Middle East and Africa is projected to grow at a 13.4% CAGR through 2032, supported by smartphone adoption, financial inclusion initiatives, and increasing demand for accessible consumer and small-business financing. Egypt's consumer finance sector served approximately 10.77 million customers during the first 11 months of 2025, with financing disbursements reaching EGP 87.2 billion (approximately USD 1.8 billion), representing 58.4% year-over-year growth. In the United Arab Emirates, the Central Bank introduced its Open Finance Regulation in July 2025, establishing requirements for API-based financial data sharing and explicit consumer consent. These regulatory developments support data-driven credit assessment and create opportunities for digital lenders to develop financing products using consent-based financial information. However, differences in credit bureau coverage, financial infrastructure, and regulatory maturity continue to influence lending opportunities across Gulf Cooperation Council countries and sub-Saharan Africa.
North America, Europe, and Latin America: Mature Infrastructure Meets New Credit Gaps
North America benefits from established consumer credit infrastructure and expanding fintech participation in unsecured lending. In the United States, fintech lenders accounted for 42% of unsecured personal loan originations in the third quarter of 2025, while outstanding unsecured personal loan balances reached USD 281 billion in the second quarter of 2026. In Europe, platforms such as Klarna, Funding Circle, Zopa, and Auxmoney operate across consumer and business lending markets shaped by established credit regulations and open banking requirements. Klarna secured a EUR 1.4 billion structured financing facility from Santander in August 2025, backed by German receivables, supporting diversification of its funding sources. In Latin America, R2 and Ant International partnered in October 2025 to expand embedded financing for small and medium-sized enterprises across Mexico, Chile, Colombia, Peru, and Brazil. R2 estimated that formal lenders meet only 13% of regional SME credit demand, highlighting the financing gap available to digital platforms. While established markets benefit from deeper funding channels and developed credit infrastructure, emerging markets offer opportunities for alternative lenders to address underserved consumer and business financing needs. Consequently, differences in funding availability, credit data coverage, and regulatory requirements continue to shape the competitive development of the fintech lending market.
Competitive Landscape
Market Concentration
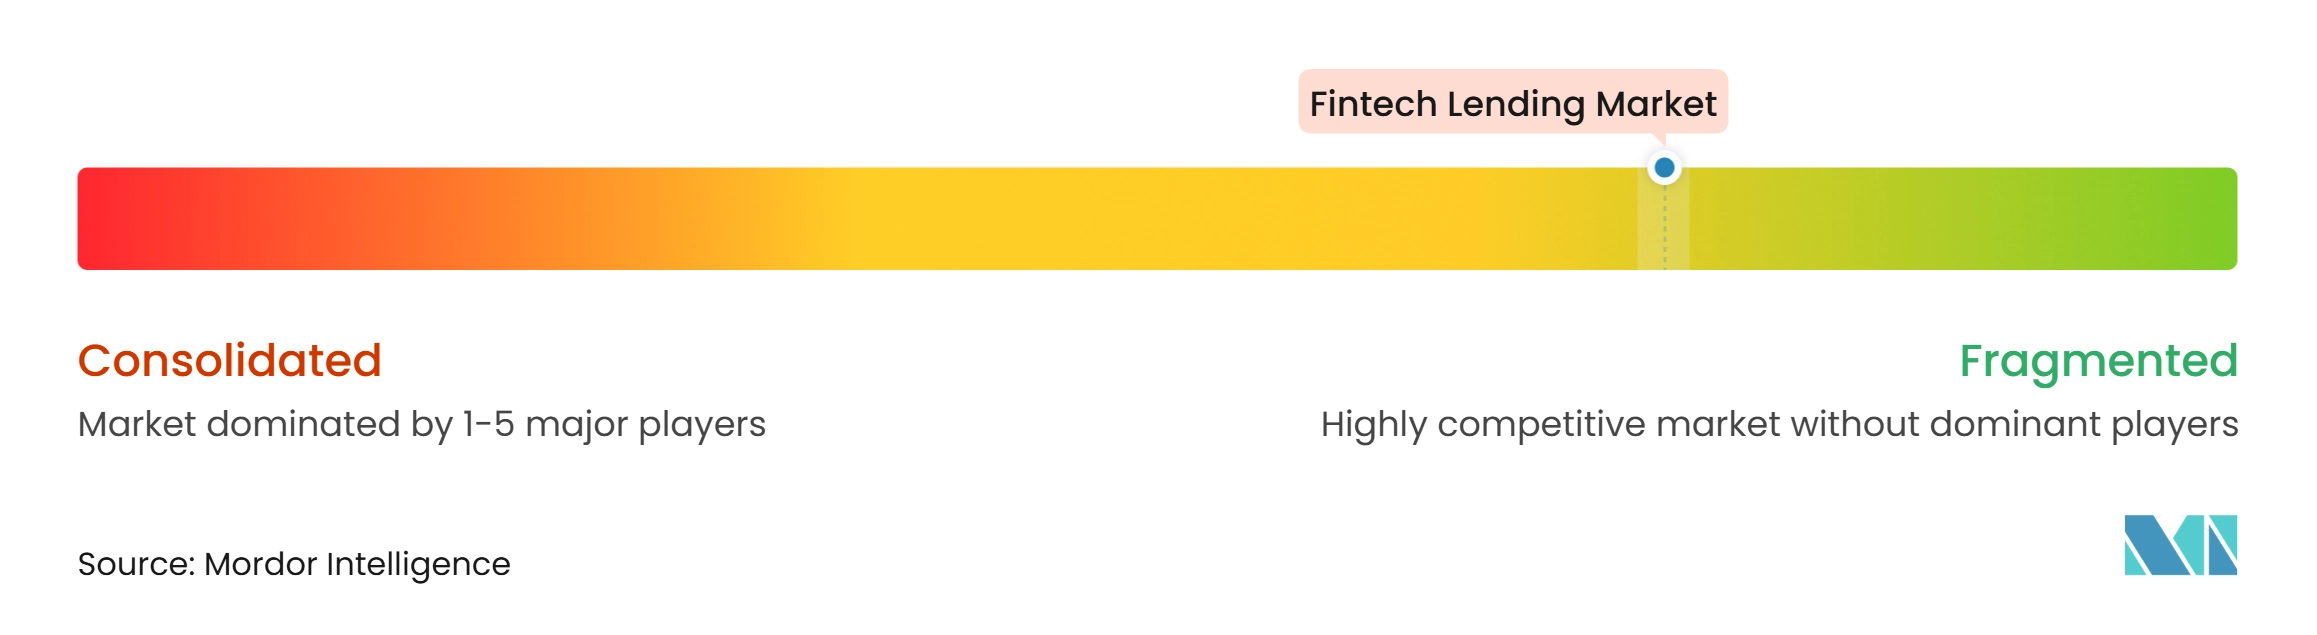
The fintech lending market remains competitive, with specialist lenders, technology platforms, and established financial institutions competing across consumer credit, small-business lending, and embedded finance. Competition is increasingly shaped by access to institutional funding, underwriting capabilities, distribution partnerships, and regulatory permissions. Affirm reported approximately 200 funding partners and 150 unique investors in its asset-backed securities programme as of March 2026, and stated that it had issued more than USD 7 billion in notes over the preceding two years. Its funding model combines warehouse facilities, securitizations, and forward-flow arrangements, helping diversify the capital available to support lending activity. Smaller fintech lenders generally differentiate through specific borrower segments, merchant networks, or specialized lending products rather than comparable funding scale.
Several fintech lenders are also pursuing bank charters and institutional financing partnerships to diversify funding sources and strengthen their lending capabilities. Affirm submitted applications to the Nevada Financial Institutions Division and the Federal Deposit Insurance Corporation in January 2026 to establish Affirm Bank, a proposed industrial loan company. The application remains subject to regulatory review and approval. Upstart announced its plan to apply for a national bank charter in March 2026 and received conditional approval from the Office of the Comptroller of the Currency in July 2026. Its applications for FDIC deposit insurance and Federal Reserve approval to become a bank holding company remained pending, and the bank cannot begin operations until all required approvals and conditions are met. Separately, Carlyle Group and Citigroup partnered in June 2025 to provide asset-backed financing to fintech lenders and explore co-investment opportunities. These developments demonstrate the growing importance of institutional capital and banking infrastructure in supporting fintech lending expansion.
Competitive differentiation is also increasingly driven by alternative data, automated underwriting, and embedded distribution. In October 2026, Plaid introduced LendScore 2, a credit risk model that uses consumer-permissioned cash-flow and financial network data. Plaid reported that the model delivers 42% greater predictive power than traditional credit data alone; this is a company-reported performance measure rather than an independently validated industry-wide result. In September 2025, Worldpay launched its Embedded Finance Engine, enabling software platform partners to integrate lending, banking, and commercial card products through a single integration. Specialist platforms such as Parafin, Tala, and YouLend further illustrate the role of focused lending models targeting merchant financing and underserved borrower segments. As a result, access to relevant financial data, established distribution networks, and scalable technology is becoming increasingly important for fintech lenders seeking to differentiate their offerings.
Fintech Lending Industry Leaders
-
Ant Group Co., Ltd.
-
Affirm Holdings, Inc.
-
PayPal Holdings, Inc.
-
Klarna Group plc
-
MercadoLibre, Inc.
- *Disclaimer: Major Players sorted in no particular order
Fintech Lending Market Companies Covered in this Report
- Affirm Holdings, Inc.
- Ant Group Co., Ltd.
- Avant, LLC
- Block, Inc.
- Enova International, Inc.
- Funding Circle Holdings plc
- Funding Societies Pte. Ltd.
- Klarna Group plc
- LendingClub Corporation
- LendInvest plc
- MercadoLibre, Inc.
- Nu Holdings Ltd. (Nubank)
- PayPal Holdings, Inc.
- Prosper Marketplace, Inc.
- SoFi Technologies, Inc.
- Tala
- Upstart Holdings, Inc.
- WeBank Co., Ltd.
- Zopa Group plc
Recent Industry Developments in Fintech Lending Market
- October 2026: nCino partnered with Parlay to integrate Parlay’s AI-native Loan Intelligence System into nCino’s commercial and small-business lending platform for Small Business Administration (SBA) lenders across the United States. The integration automates loan intake, eligibility screening, and deal structuring, and had already processed more than USD 500 million in SBA loan inquiries in 2026 at the time of announcement.
- October 2026: WeMoney launched WeMoney Connect in limited early access in Australia. The AI-powered platform uses consented bank data under the Consumer Data Right framework to prepare source-linked borrower assessments against lenders’ credit policies. Mastercard provides the open-banking infrastructure; the available announcement confirms its technology role, but not its participation as a strategic investor.
- June 2026: finmid and myPOS launched myPOS Financing in Italy, giving more than 90,000 eligible merchants access to personalized, pre-approved revenue-based financing through the myPOS platform. Funds are available within 48 hours of acceptance, with repayments linked to business revenue. The partnership aims to address Italy’s EUR 3 billion (USD 3.5 billion) SME financing gap.
- February 2026: Adyen and Fresha launched Fresha Capital across seven markets: the United States, United Kingdom, Australia, Canada, the Netherlands, Finland, and Sweden. The embedded working-capital product offers pre-approved financing to beauty and wellness businesses, with more than USD 5.5 million in loans issued at the time of announcement.
Global Fintech Lending Market Report Scope
Segmentation Overview
| Consumer Lending |
| Business Lending |
| Individual Borrowers |
| Small and Medium-Sized Enterprises |
| Large Enterprises |
| Balance-Sheet Lending |
| Marketplace / Peer-to-Peer (P2P) Lending |
| Pure-play Fintech / Digital NBFC Platforms |
| Big-Tech Platforms |
| Bank-Originated Fintech-Facilitated / Co-Lending Arrangements |
| Closed-End Installment Financing |
| Revolving Credit Facilities |
| Receivables-Based Financing |
| Revenue-Based Financing |
| Others |
| Direct Digital Channels |
| Embedded Commerce and POS Platforms |
| Digital Banking and Payment Platforms |
| B2B Business Software Platforms |
| Digital Loan Marketplaces / Aggregators |
| North America | United States |
| Canada | |
| Mexico | |
| South America | Brazil |
| Argentina | |
| Rest of South America | |
| Europe | United Kingdom |
| Germany | |
| France | |
| Italy | |
| Spain | |
| Rest of Europe | |
| Asia-Pacific | China |
| Japan | |
| India | |
| South Korea | |
| Australia | |
| Indonesia | |
| Thailand | |
| Malaysia | |
| Singapore | |
| Vietnam | |
| Rest of Asia-Pacific | |
| Middle East and Africa | Saudi Arabia |
| United Arab Emirates | |
| Turkey | |
| South Africa | |
| Egypt | |
| Rest of Middle East and Africa |
| By Lending Type | Consumer Lending | |
| Business Lending | ||
| By Borrower Type | Individual Borrowers | |
| Small and Medium-Sized Enterprises | ||
| Large Enterprises | ||
| By Funding and Intermediation Model | Balance-Sheet Lending | |
| Marketplace / Peer-to-Peer (P2P) Lending | ||
| By Institutional Type / Originator | Pure-play Fintech / Digital NBFC Platforms | |
| Big-Tech Platforms | ||
| Bank-Originated Fintech-Facilitated / Co-Lending Arrangements | ||
| By Product Structure | Closed-End Installment Financing | |
| Revolving Credit Facilities | ||
| Receivables-Based Financing | ||
| Revenue-Based Financing | ||
| Others | ||
| By Distribution Channel | Direct Digital Channels | |
| Embedded Commerce and POS Platforms | ||
| Digital Banking and Payment Platforms | ||
| B2B Business Software Platforms | ||
| Digital Loan Marketplaces / Aggregators | ||
| By Geography | North America | United States |
| Canada | ||
| Mexico | ||
| South America | Brazil | |
| Argentina | ||
| Rest of South America | ||
| Europe | United Kingdom | |
| Germany | ||
| France | ||
| Italy | ||
| Spain | ||
| Rest of Europe | ||
| Asia-Pacific | China | |
| Japan | ||
| India | ||
| South Korea | ||
| Australia | ||
| Indonesia | ||
| Thailand | ||
| Malaysia | ||
| Singapore | ||
| Vietnam | ||
| Rest of Asia-Pacific | ||
| Middle East and Africa | Saudi Arabia | |
| United Arab Emirates | ||
| Turkey | ||
| South Africa | ||
| Egypt | ||
| Rest of Middle East and Africa | ||
Key Questions Answered in the Report
What is driving fintech lending growth?
Digital distribution, transaction-based underwriting, open banking, and unmet small business credit needs support growth. The fintech lending market is projected to grow at an 8.5% CAGR through 2032.
Which lending type has the largest fintech lending share?
Consumer lending held 59.5% share in 2026, supported by digital personal loans, buy now, pay later products, and cash advances.
Which borrower group is growing fastest?
Small and medium-sized enterprises are projected to grow at a 12.1% CAGR through 2032 as digital lenders address unmet funding needs.
Which product structure is expanding fastest?
Revenue-based financing is projected to grow at a 13.8% CAGR through 2032 because repayments can align with merchant cash flow.
Which region leads fintech lending?
Asia-Pacific held 39.8% share in 2026, supported by mobile-first adoption, digital payments, and large underserved borrower populations.
What are the main risks for fintech lenders?
Rising nonperforming loans, dependence on wholesale funding, differing regulations, and incomplete credit reporting can constrain lenders.