Extended Warranty Market Size and Share
Market Overview
| Study Period | 2019 - 2030 |
|---|---|
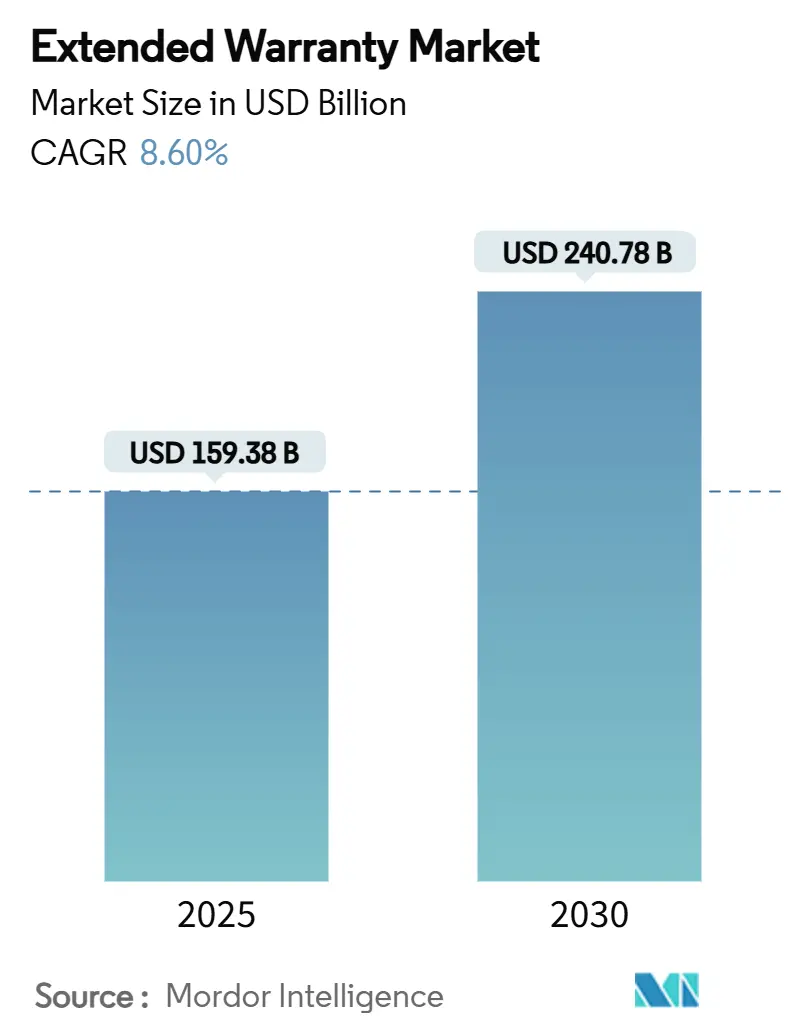
| Market Size (2025) | USD 159.38 Billion |
| Market Size (2030) | USD 240.78 Billion |
| Growth Rate (2025 - 2030) | 8.60% CAGR |
| Fastest Growing Market | Asia Pacific |
| Largest Market | North America |
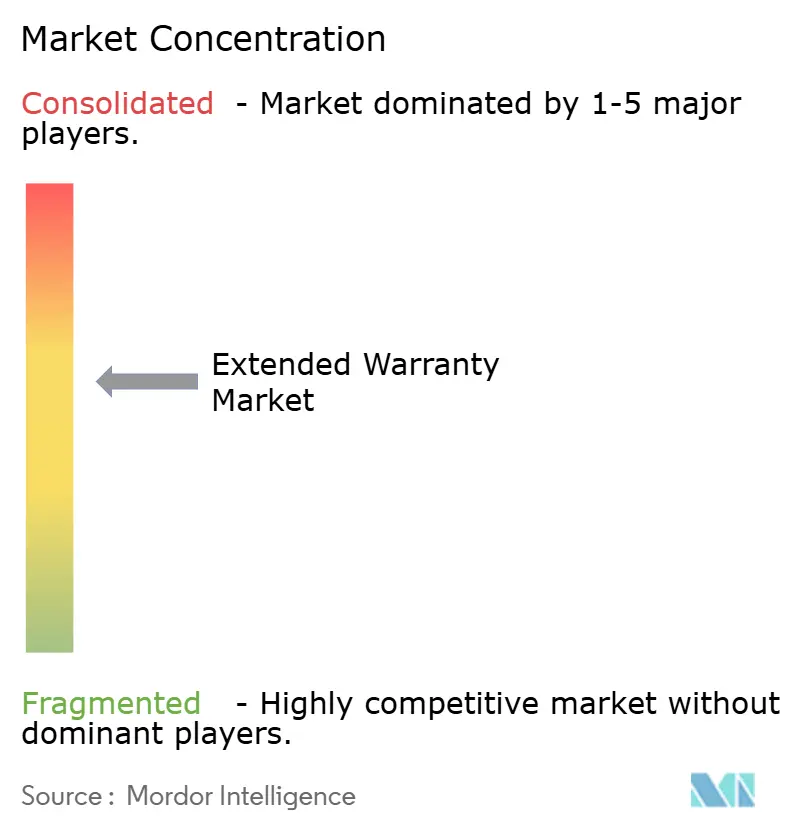
| Market Concentration | Medium |
Major Players *Disclaimer: Major Players sorted in no particular order Image © Mordor Intelligence. Reuse requires attribution under CC BY 4.0. | |
Extended Warranty Market Analysis by Mordor Intelligence
The extended warranty market size reached USD 159.38 billion in 2025 and is forecast to advance at an 8.60% CAGR, lifting value to USD 240.78 billion by 2030. Strong momentum comes from mounting product complexity in automotive and consumer electronics, wider use of AI-driven predictive maintenance, and steady expansion of digital sales channels. Tightening right-to-repair rules in Europe and parts of North America encourage longer product lifecycles and, in turn, raise demand for post-manufacturer protection plans. Telematics data allows dynamic pricing that better matches real-world risk, while OEMs turn warranties into loyalty tools that secure recurring service revenues. At the same time, risk-centric insurance brokers move aggressively into the sector, challenging traditional manufacturer-led offerings.
Key Report Takeaways
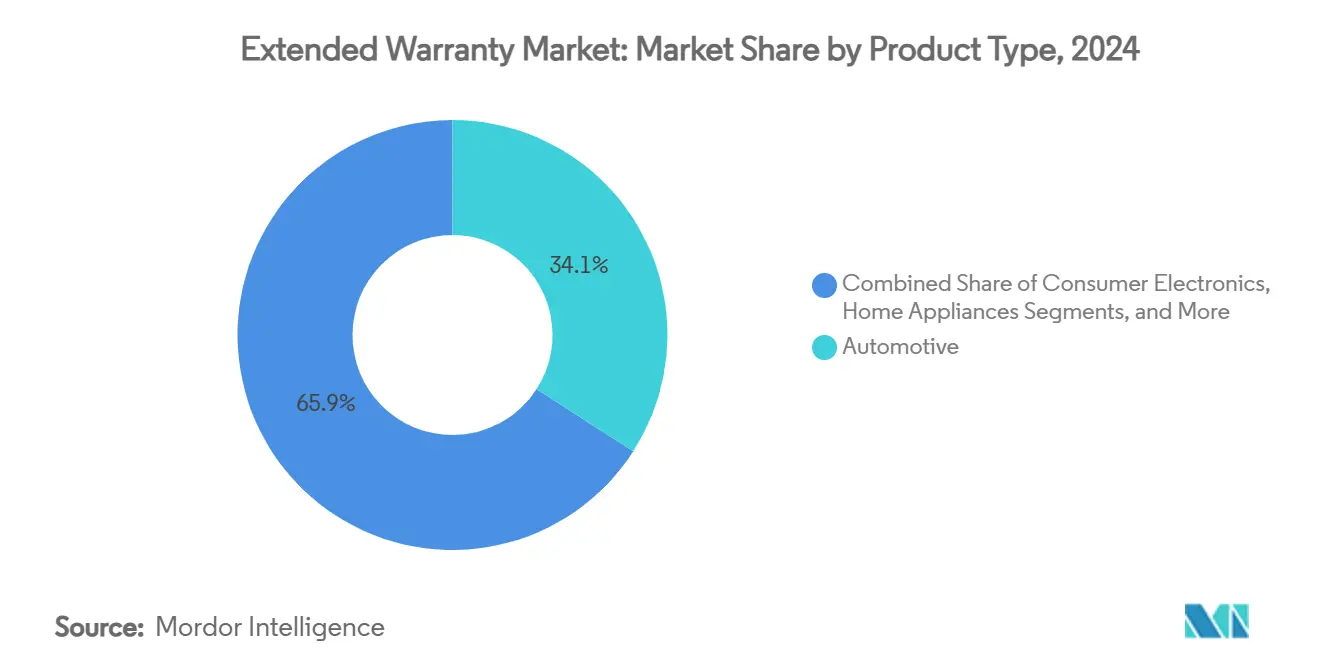
- By product type, automotive captured 34.1% of extended warranty market share in 2024, while consumer electronics is projected to expand at an 8.5% CAGR through 2030.
- By service provider, OEMs held 40.6% revenue share in 2024; the insurer/broker segment registers the fastest growth at 8.8% CAGR through 2030.
- By coverage term, 2–3-year plans accounted for 45.1% of the extended warranty market size in 2024, yet contracts lasting more than 5 years are advancing at an 8.2% CAGR.
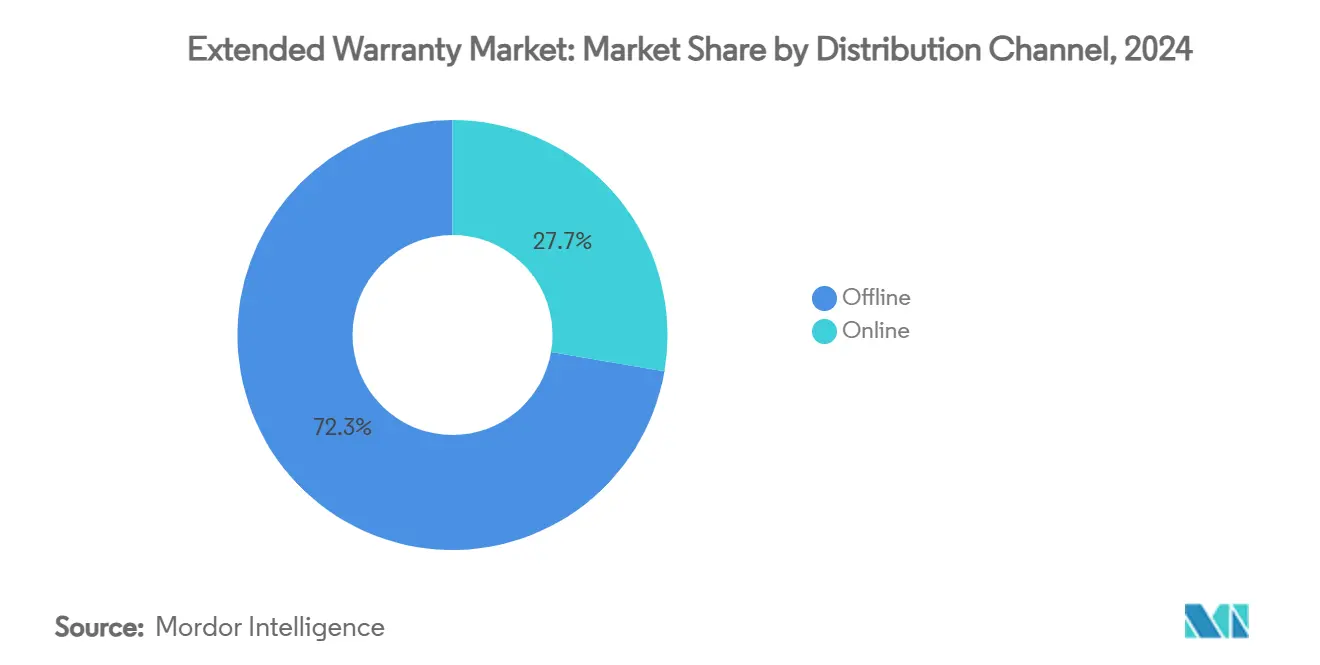
- By distribution channel, offline sales retained 72.3% share in 2024, but online channels are growing at 8.6% CAGR on the back of embedded-checkout offerings.
- By end-user, individual consumers represented 78.3% of 2024 demand, whereas commercial and fleet customers are increasing at an 8.1% CAGR.
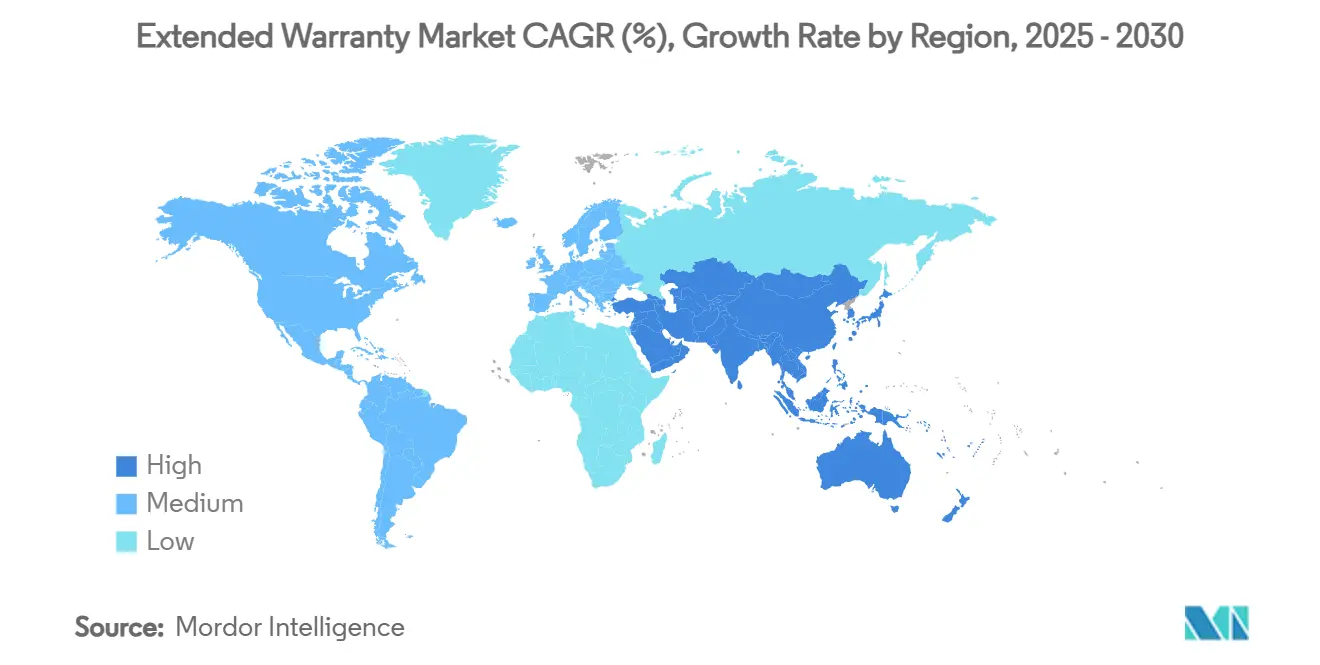
- By region, North America led with 37.5% share in 2024, while APAC posts the strongest 7.8% CAGR to 2030.
Global Extended Warranty Market Trends and Insights
Drivers Impact Analysis*
| Driver | (~) % Impact on CAGR Forecast | Geographic Relevance | Impact Timeline |
|---|---|---|---|
| Rising penetration of high-ticket consumer electronics & appliances | +1.5% | North America, APAC | Medium term (2–4 years) |
| Increasing vehicle complexity & repair costs | +0.8% | North America, Europe | Long term (≥ 4 years) |
| Growth of e-commerce channels for warranty sales | +0.6% | North America | Short term (≤ 2 years) |
| OEMs leveraging warranties for customer retention | +0.4% | Global automotive markets | Medium term (2–4 years) |
| AI-powered predictive maintenance enabling dynamic pricing | +0.3% | North America, Europe, APAC | Long term (≥ 4 years) |
| Circular-economy regulations extending product life cycles | +0.2% | Europe, North America | Long term (≥ 4 years) |
| Source: Mordor Intelligence | |||
Rising Penetration of High-Ticket Consumer Electronics and Appliances
Premium smartphones, laptops, and large household appliances now carry average protection-plan prices equal to 22–26% of product cost, a level consumers accept in exchange for accidental-damage and loss coverage.[1]Warranty Week, “Service Contract Pricing: Computer Accessories,” Warranty Week, Feb 06 2025, warrantyweek.com.Apple’s warranty accrual rose to 3.9% of revenue in 2024, underscoring escalating risk for manufacturers.[2]Warranty Week, “Smartphone Warranties,” Warranty Week, Feb 06 2023, warrantyweek.com. Attachment rates climb further when online retailers place warranty offers directly beside the “buy” button, a practice now common on leading marketplaces[3]Extend, “Why Offer Extended Warranties? What Amazon Knows That You Should, Too,” Extend, Jan 01 2025, extend.com.. Appliance OEMs report a 12.5% drop in claims frequency owing to better component quality, freeing capital that warranty administrators can reinvest in pricing analytics. US tariff pressure on imported white goods has pushed repair costs higher, prompting a 9% increase in warranty uptake year over year.
Increasing Vehicle Complexity and Repair Costs
Electric-vehicle repairs cost up to 50% more than work on comparable internal-combustion cars because of specialized parts and diagnostics. Advanced driver-assistance systems raise average collision bills by 15-19%, concentrating claims inside authorised repair networks that can access proprietary calibration data. Allegations that some OEMs manipulate odometers to shorten coverage windows amplify consumer interest in transparent, third-party plans. Global automotive makers paid USD 51 billion in warranty claims during 2023, backing reserves of USD 140 billion to meet future liabilities. Ford’s expenses climbed 15% and Tesla’s surged 53% in the same period, highlighting volatility that external warranty providers can monetize with risk-based pricing.
Growth of E-commerce Channels for Warranty Sales
Attaching protection plans within digital checkout flows lifts conversion while shrinking processing cost per contract. Subscription models delivered online now post retention rates above 85%-more than double typical single-transaction warranties-because algorithms personalize coverage and streamline claims. Gaming console plans priced near 16% of hardware value illustrate consumers’ willingness to add low-friction coverage on the spot. Real-time data feeds into pricing engines that optimise margin and customer satisfaction simultaneously, something brick-and-mortar sales desks struggle to match.
OEMs Leveraging Warranties for Customer Retention
Ram’s move to a 10-year/100,000-mile powertrain guarantee on 2026 pickups reframes warranty from cost centre to loyalty device. Tesla’s selective withdrawal of extended services in the UK shows manufacturers redeploying coverage only where economics warrant. Assurant’s Vehicle Care Technology Plus bundles car protection with smartphone repair, signalling an era of integrated lifestyle coverage that deepens brand lock-in. Mazda’s exploration of in-house insurance reflects broader OEM interest in controlling the entire risk stack. Combined global warranty reserves of USD 140 billion turn these programmes into strategic assets that finance retention initiatives over product lifecycles.
Restraints Impact Analysis*
| Restraint | (~) % Impact on CAGR Forecast | Geographic Relevance | Impact Timeline |
|---|---|---|---|
| High claims costs squeezing margins | -0.7% | Global, particularly in mature markets | Short term (≤ 2 years) |
| Low consumer awareness & trust | -0.5% | Global, with higher impact in emerging markets | Medium term (2-4 years) |
| Right-to-repair legislation reducing need | -0.4% | Europe leading, spreading to North America | Long term (≥ 4 years) |
| Data-privacy concerns around telematics models | -0.3% | Europe & North America, regulatory focus | Medium term (2-4 years) |
| Source: Mordor Intelligence | |||
High Claims Costs Squeezing Margins
Automotive warranty claims of USD 51 billion in 2023 equate to 2% of global vehicle sales, a ratio that leaves scant headroom for mis-priced risk. Appliance repair outlays total USD 6.5 billion, while complex electronics components keep pushing parts tickets higher. Tesla’s warranty spend leapt 53% in 2023, illustrating exposure when design cycles outrun actuarial models. Japanese factories lose an average USD 126,000 annually to unplanned equipment failures-a cost often underestimated in warranty pricing. Semiconductor makers still paid USD 761 million in claims during 2023 despite an 8% yearly drop, underlining how even incremental reliability gains may not immediately cut payout pressure.
Low Consumer Awareness and Trust
Some low-value peripherals carry protection plans priced at 410% of product cost, fuelling scepticism about extended warranty value. Legacy providers face reputational drag from cumbersome claims processes, encouraging digital newcomers to highlight transparency and speed. Activist successes in right-to-repair legislation expose consumer frustration with restrictive manufacturer warranties. Lifestyle brands paring back “lifetime” guarantees in favour of repair programmes show preferences shifting toward service relationships over insurance contracts. Leading administrators with high customer-satisfaction scores prove that experience quality can rebuild trust, but smaller firms struggle to replicate such scale-driven excellence.
*Our forecasts treat driver/restraint impacts as directional, not additive. The impact forecasts reflect baseline growth, mix effects, and variable interactions.
Segment Analysis
By Product Type: Automotive Dominance Faces Electronics Disruption
Automotive plans accounted for 34.1% of extended warranty market share in 2024, yet smartphones, laptops, and other connected devices drive the fastest 8.5% CAGR, signalling an imminent re-balancing of revenue streams. Consumer electronics warranties are expected to top USD 59.52 billion by 2028, propelled by AI-based diagnostics that cut adjudication time. The extended warranty market size attributed to industrial equipment will climb alongside predictive-maintenance rollouts that lower downtime costs for factories. IoT-enabled appliances gain traction as tariff-driven repair inflation pushes households toward coverage for refrigerators, HVAC units, and washers. Automotive still benefits from high unit prices and regulatory pressure to cover EV batteries, yet prolonged supply-chain volatility keeps parts expensive, eroding margin unless providers adopt granular risk scoring.
The transition from mechanical to software-defined vehicles amplifies claim variability and forces administrators to invest in specialised training. Advanced driver-assistance hardware often requires recalibration after minor collisions, inflating warranty exposure. Simultaneously, longer smartphone replacement cycles make multi-year device plans attractive to consumers protecting high-value assets. Cross-sector convergence emerges as insurers design bundled contracts covering vehicles and personal electronics within a single policy window.


By Service Provider: Insurance Brokers Disrupt OEM Dominance
OEMs controlled 40.6% of revenue in 2024, but insurer and broker channels are tracking 8.8% CAGR by leveraging actuarial depth and multi-line distribution. The extended warranty market size captured by brokers continues to rise as they deploy data platforms that automate underwriting across disparate product lines. Third-party administrators add value through scalable claims engines that smaller retailers cannot replicate economically.
OEM units still enjoy captive point-of-sale access, yet rising capital demands and accounting scrutiny push some automakers to outsource underwriting. Acquisition activity, such as Allstate’s USD 1.4 billion purchase of SquareTrade, showcases convergence between insurance and warranty service ecosystems. Retailer-backed programmes remain important but face channel conflict when manufacturers launch direct-to-consumer portals, diluting store leverage in negotiations.
By Coverage Term: Extended Protection Gains Momentum
Plans spanning 2-3 years captured 45.1% of 2024 volume, reflecting consumer willingness to pay for protection slightly beyond factory coverage. However, contracts exceeding 5 years are expanding at 8.2% CAGR, bolstered by EV battery warranties and Ram’s decade-long powertrain guarantee. Shorter one-year extensions play to price-sensitive buyers but create renewal friction that digital subscription models aim to remove.
Manufacturers of high-ticket doors, gates, and bathroom fixtures in Japan already offer 10-year policies that include 24/7 emergency repair, signalling uptake potential for other durable goods categories. Where product innovation cycles shorten, as in smartphones, annual plans coupled with upgrade programmes provide flexibility without long-term commitment.
By Distribution Channel: Digital Transformation Accelerates
Offline retail captured 72.3% of 2024 contracts, yet embedded e-commerce offerings are scaling at 8.6% CAGR. Machine-learning engines inside checkout flows tailor coverage levels and price points to purchase history, boosting attach rates and reducing post-sale outreach cost. Standardised APIs let online merchants integrate warranty offers in hours, undermining physical-store exclusivity.
Subscription-based cover thrives online because automated billing aligns premium collection with ongoing service usage. Warranty administrators behind leading web stores handle high-volume electronics plans where real-time device diagnostics support near-instant claim approvals. In response, big-box retailers are digitising their warranty desks, though legacy POS systems often hamper seamless omnichannel execution.
By End-User: Commercial Fleets Drive Growth Innovation
Individual buyers supplied 78.3% of revenue in 2024, yet commercial fleets and enterprises are closing the gap at an 8.1% CAGR. Vehicle-telematics data allows fleet operators to negotiate usage-based premiums that fall below static rates. Munich Re reports insurers utilising mileage, idle time, and driving-behaviour metrics to price service contracts with surgical precision.
For consumer markets, peace-of-mind remains the dominant motive behind purchase decisions. In commercial operations, uptime economics steer adoption; predictive-maintenance-linked warranties promise lower total cost of ownership by preventing failures before they ground critical assets. Smart-home installers also source extended plans that cover connected lighting, HVAC, and security equipment bundled within service-level agreements.
Geography Analysis
North America contributed 37.5% of 2024 revenue, reflecting entrenched consumer acceptance and a large installed base of high-value electronics and vehicles. OEM-backed finance arms and mature insurance capacity underpin contract penetration across retail, auto, and home segments. Canada deepened market reach through iA Financial Group’s takeover of Global Warranty, adding 1,500 dealerships and 400 repair centres to its network. Mexico’s growing auto-manufacturing footprint and rising discretionary income create headroom for warranty cross-sell at the dealership level.
Europe follows as the second-largest region, distinguished by aggressive policy measures such as Directive 2024/1799 and new ecodesign legislation that oblige producers to extend service support, indirectly lifting warranty attachment rates.[4]European Parliament, “Directive 2024/1799 on the Right to Repair,” European Parliament, Jun 28 2024, eur-lex.europa.eu. Mature markets like Germany and the UK sustain steady renewal revenue, while Eastern European nations exhibit higher first-time adoption tied to rising electronics ownership. Providers face regulatory complexity but also gain a first-mover edge when aligning offers with mandated repairability standards.
APAC posts the fastest 7.8% CAGR to 2030, propelled by China’s vast consumer-electronics demand and India’s 11% consumer-durables growth outlook. Japanese manufacturers confronting unexpected plant stoppages spend heavily on predictive maintenance, stimulating industrial warranty uptake. Demand in Southeast Asia, South Korea, and Australia expands alongside e-commerce penetration. Middle East and Africa remain nascent yet strategic, with Saudi Arabia and UAE industrial diversification plans generating new equipment-coverage opportunities.

Competitive Landscape
The extended warranty market displays moderate concentration. Allstate, Assurant, and Asurion anchor the top tier and pursue scale efficiencies through M&A, evidenced by Allstate’s SquareTrade and Kingfisher-mx acquisitions. Digital entrants like Extend differentiate through API-driven enrolment and instant claims, winning retailer integrations that legacy systems cannot match. Brokers harness E&S lines to underwrite niche exposures, reshaping competitive boundaries.
Technology capability is now the primary moat. Administrators employing AI triage reduce average claim-resolution time, improving Net Promoter Scores and lowering operating cost per contract. Subscription schemes with dynamic pricing heighten customer stickiness; Domestic & General’s programmes achieve 85% retention. White-space areas, EV batteries, solar-power inverters, and smart-home ecosystems invite specialised providers adept at monitoring and predictive analysis.
Strategic priorities vary. OEMs use longer warranties to hold customers inside branded service loops, insurers build platform ecosystems that cross-sell multiple protection lines, and retailers negotiate margin-sharing to defend point-of-sale economics. Overall rivalry intensifies as regulatory change, technology integration, and evolving consumer expectations raise the bar for responsive, data-rich service models.
Extended Warranty Industry Leaders
AIG Inc.
Assurant Inc.
Allianz Partners
SquareTrade, Inc.
Domestic & General Group Limited
- *Disclaimer: Major Players sorted in no particular order

Recent Industry Developments
- March 2025: Assurant introduced Vehicle Care Technology Plus, blending vehicle service contracts with discounted smartphone repair to broaden lifetime customer value.
- February 2025: iA Financial Group acquired Global Warranty to gain scale in Canada’s used-vehicle segment and deepen dealership reach.


Global Extended Warranty Market Report Scope
| Consumer Electronics |
| Home Appliances |
| Automotive |
| Industrial Equipment |
| Other Product Types |
| OEM |
| Retailer |
| Insurer / Broker |
| Third-party Administrator |
| 1 Year |
| 2-3 Years |
| 4-5 Years |
| Above 5 Years |
| Online |
| Offline |
| Individual Consumers |
| Commercial / Fleet |
| North America | United States | |
| Canada | ||
| Mexico | ||
| South America | Brazil | |
| Argentina | ||
| Rest of South America | ||
| Europe | Germany | |
| United Kingdom | ||
| France | ||
| Italy | ||
| Spain | ||
| Rest of Europe | ||
| Asia Pacific | China | |
| India | ||
| Japan | ||
| South Korea | ||
| Australia | ||
| Rest of Asia Pacific | ||
| Middle East and Africa | Middle East | Saudi Arabia |
| United Arab Emirates | ||
| Turkey | ||
| Rest of the Middle East | ||
| Africa | South Africa | |
| Nigeria | ||
| Egypt | ||
| Rest of Africa | ||
| By Product Type | Consumer Electronics | ||
| Home Appliances | |||
| Automotive | |||
| Industrial Equipment | |||
| Other Product Types | |||
| By Service Provider | OEM | ||
| Retailer | |||
| Insurer / Broker | |||
| Third-party Administrator | |||
| By Coverage Term | 1 Year | ||
| 2-3 Years | |||
| 4-5 Years | |||
| Above 5 Years | |||
| By Distribution Channel | Online | ||
| Offline | |||
| By End-user | Individual Consumers | ||
| Commercial / Fleet | |||
| By Geography | North America | United States | |
| Canada | |||
| Mexico | |||
| South America | Brazil | ||
| Argentina | |||
| Rest of South America | |||
| Europe | Germany | ||
| United Kingdom | |||
| France | |||
| Italy | |||
| Spain | |||
| Rest of Europe | |||
| Asia Pacific | China | ||
| India | |||
| Japan | |||
| South Korea | |||
| Australia | |||
| Rest of Asia Pacific | |||
| Middle East and Africa | Middle East | Saudi Arabia | |
| United Arab Emirates | |||
| Turkey | |||
| Rest of the Middle East | |||
| Africa | South Africa | ||
| Nigeria | |||
| Egypt | |||
| Rest of Africa | |||


Key Questions Answered in the Report
What is the current value of the extended warranty market?
The extended warranty market size stood at USD 159.38 billion in 2025 and is forecast to reach USD 240.78 billion by 2030.
Which product segment is expanding the fastest?
Consumer electronics leads growth at an anticipated 8.5% CAGR through 2030, driven by rising device complexity and higher attachment rates.
How significant are online channels for warranty sales?
Although offline outlets hold 72% share, online distribution is growing at 8.6% CAGR as embedded-checkout offers gain traction.
Why are longer warranty terms becoming more common?
Longer contracts align with extended product lifecycles, especially for EV batteries, and act as loyalty tools for OEMs seeking differentiation.
Page last updated on:


