
Market Overview
| Study Period | 2020 - 2031 |
|---|---|
| Forecast Data Period | 2026 - 2031 |
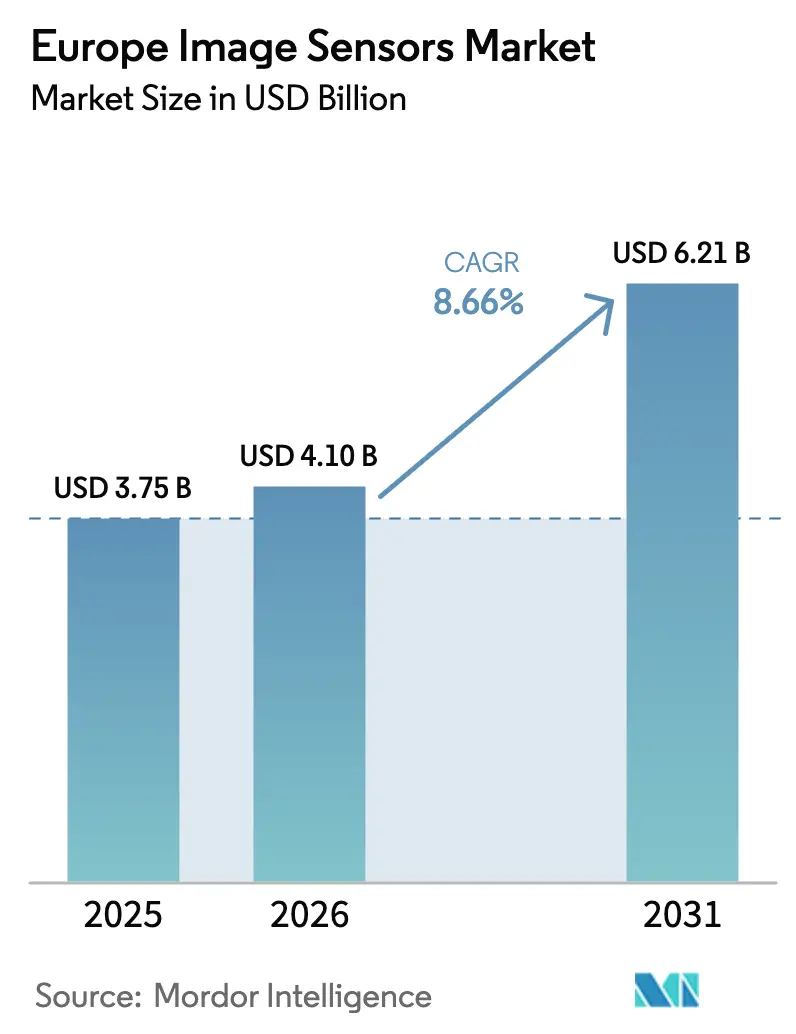
| Base Year Market Size (2025) | USD 3.75 Billion |
| Market Size (2026) | USD 4.10 Billion |
| Market Size (2031) | USD 6.21 Billion |
| Growth Rate (2026 - 2031) | 8.66 % |
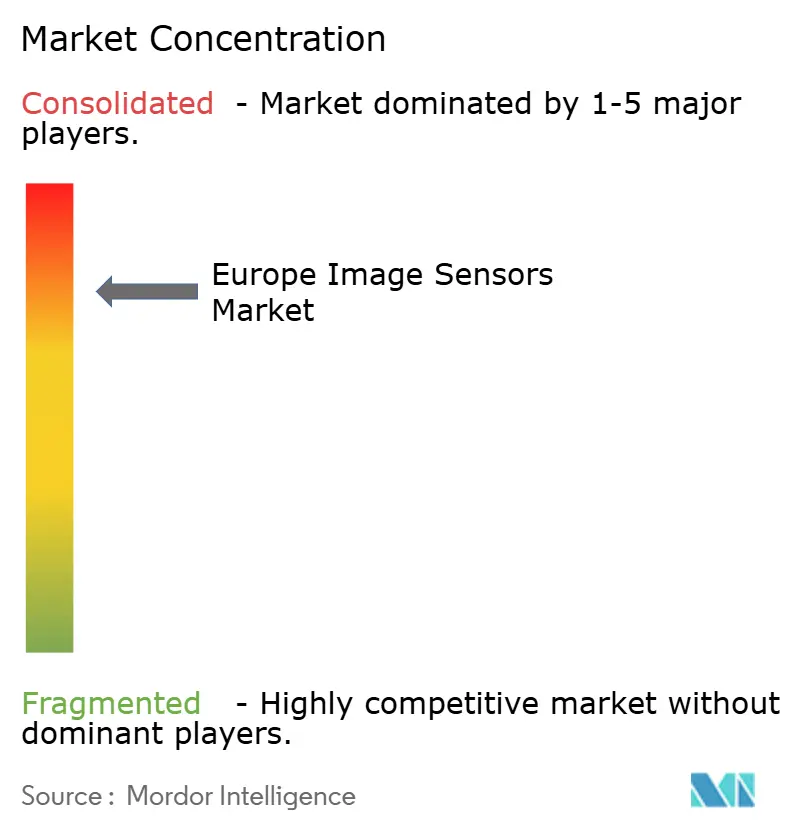
| Market Concentration | High |
Major Players *Disclaimer: Major Players sorted in no particular order Image © Mordor Intelligence. Reuse requires attribution under CC BY 4.0. | |
Europe Image Sensors Market Analysis by Mordor Intelligence
The Europe image sensors market size is projected to be USD 3.75 billion in 2025, USD 4.1 billion in 2026, and reach USD 6.21 billion by 2031, growing at a CAGR of 8.66% from 2026 to 2031. Strong regulatory pull from the July 2024 EU General Safety Regulation and the 2025–2026 Euro NCAP protocols has accelerated camera integration in vehicles, while wafer-level optics and stacked complementary metal-oxide-semiconductor (CMOS) architectures are compressing module height and boosting readout speed. At the same time, Horizon Europe grants for low-latency, on-sensor artificial intelligence (AI) are redistributing capital toward industrial machine-vision lines, and healthcare is pivoting to single-use, chip-on-tip endoscopes that avoid the high reprocessing costs of reusable scopes. Competitive dynamics remain tight as Chinese suppliers target security and industrial niches with lower pricing, yet European incumbents retain an edge in short-wave infrared (SWIR) and single-photon avalanche diode (SPAD) arrays. These forces combine to expand the Europe image sensors market across automotive, healthcare, and industrial end-user verticals even as consumer electronics continues to anchor revenue.
Key Report Takeaways
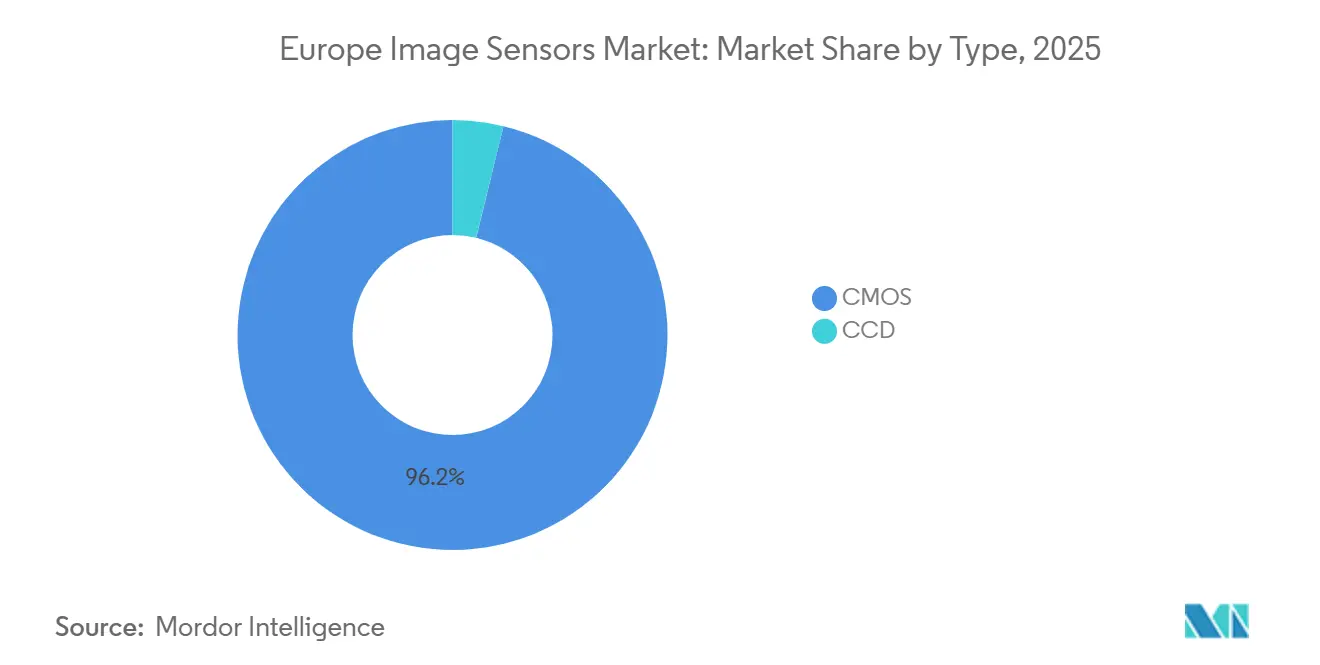
- By type, CMOS sensors led with 96.19% of 2025 revenue and are advancing at a 9.21% CAGR through 2031, while charge-coupled devices (CCD) remain niche with less than 4% share.
- By resolution, the 25–64 megapixel band accounted for 42.31% of 2025 sales, yet sensors above 200 megapixels are the fastest-growing group at a 9.06% CAGR to 2031.
- By spectrum, visible-light imagers dominated with 68.65% of 2025 value, but SWIR devices are expanding at an 8.94% CAGR as pharmaceutical quality control and plastics recycling adopt spectral analysis.
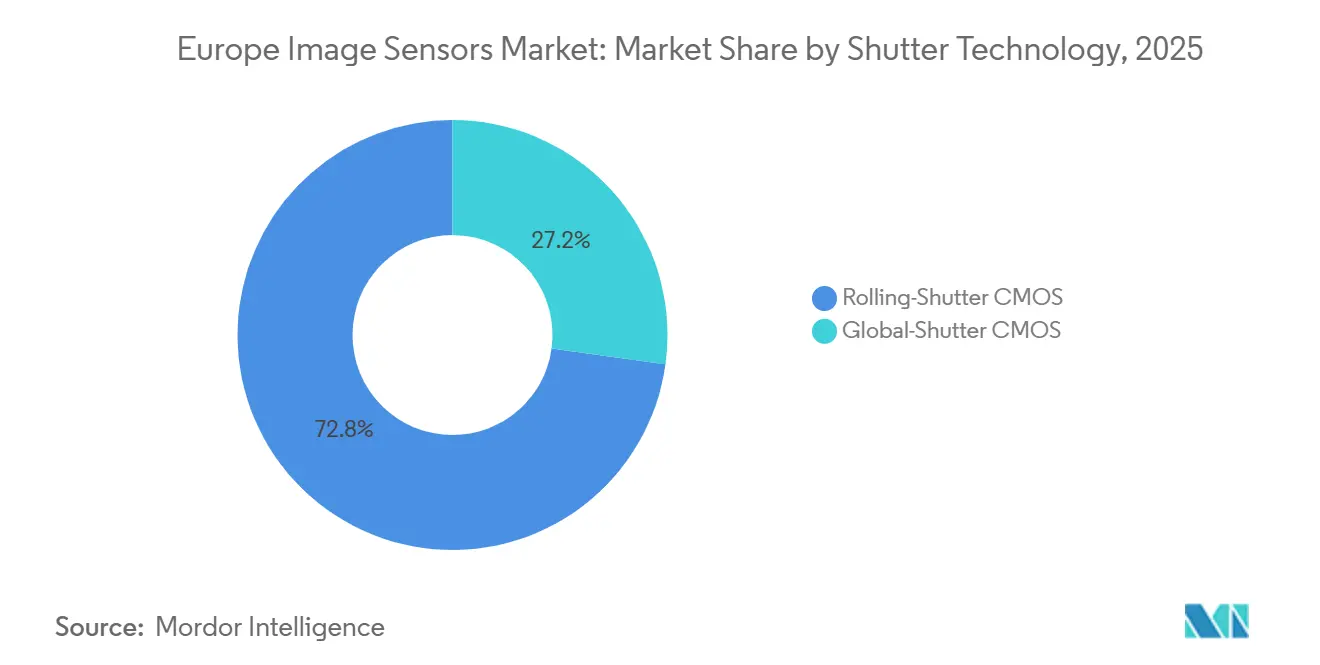
- By shutter technology, rolling-shutter solutions held 72.83% share in 2025, while global-shutter devices are accelerating at a 9.54% CAGR on the back of factory-automation demand.
- By end-user industry, consumer electronics commanded 34.17% of 2025 turnover, whereas healthcare is scaling fastest at a 9.34% CAGR on disposable endoscopes and low-dose X-ray sensors.
Note: Market size and forecast figures in this report are generated using Mordor Intelligence’s proprietary estimation framework, updated with the latest available data and insights as of January 2026.
Europe Image Sensors Market Trends and Insights
Drivers Impact Analysis*
| Driver | (~) % Impact on CAGR Forecast | Geographic Relevance | Impact Timeline |
|---|---|---|---|
| Multi-Camera Smartphone Race Beyond 200 MP | +1.80% | Germany, France, United Kingdom, Italy | Medium term (2-4 years) |
| Euro NCAP Front-Camera Mandate (AEB) | +2.10% | Germany, France, United Kingdom, Italy, Rest of Europe | Short term (≤ 2 years) |
| Wafer-Level Optics and Stacked CIS Migration | +1.50% | Germany, France, Italy | Long term (≥ 4 years) |
| AI-Enabled Industrial Machine-Vision Grants | +1.30% | Germany, France, Italy, Rest of Europe | Medium term (2-4 years) |
| Disposable Chip-On-Tip Medical Endoscopy | +0.90% | Germany, United Kingdom, France, Italy | Medium term (2-4 years) |
| Photon-Counting SPAD Sensors for Automotive LiDAR Pilots | +0.70% | Germany, France, United Kingdom | Long term (≥ 4 years) |
| Source: Mordor Intelligence | |||
Euro NCAP Front-Camera Mandate (AEB)
Euro NCAP’s 2025 and 2026 protocols award up to 25 points for driver-monitoring and pedestrian-detection performance, effectively forcing every automaker that seeks a five-star rating to adopt near-infrared forward and in-cabin imagers.[1]Euro NCAP, “2025 and 2026 Assessment Protocols,” EURONCAP.COM Integrators compressed sourcing timetables by 18–24 months to meet July 2024 EU General Safety Regulation deadlines, which amplified demand for Europe image sensors market supply. onsemi disclosed that 450 million of its automotive cameras were already on the road by third-quarter 2025, with 68% of design wins linked to Euro-compliant platforms. The regulatory premium is also steering time-of-flight (ToF) modules into cockpits, as occupant-classification rules tighten air-bag deployment criteria. Germany’s Bosch, Continental, and ZF are fusing side and rear views with the mandated front-camera feed, generating sticky software interfaces that protect incumbent sensor suppliers. The mandate therefore raises unit count per vehicle and entrenches established vendors, contributing materially to the growth trajectory of the Europe image sensors market.
Multi-Camera Smartphone Race Beyond 200 MP
Pixel pitch in flagship phones fell below 0.6 µm during 2025 as Sony and OmniVision each unveiled 200-megapixel parts, lifting average selling prices above USD 30 per sensor.[2]Sony Semiconductor, “LYT-901 and IMX925 Product Notes,” SONY-SEMICON.COM Samsung is scaling 0.5 µm nodes in Hwaseong to regain premium-tier ground, while European module assemblers in Germany and France gain volume because sub-micron pixels demand tighter optical tolerances. Wafer-level camera modules integrate the lens directly on the die, shaving 1.2 mm from z-height and enabling periscope telephoto designs.[3]IEEE Xplore, “Stacked CMOS Image Sensor Architectures,” IEEEXPLORE.IEEE.ORG Although Asian chipmakers dominate supply, the Europe image sensors market benefits indirectly through higher equipment-automation intensity and through a larger pull for photonics packaging materials sourced from European specialty-glass vendors. With premium Android shipments stabilizing, the value-uplift rather than raw volume expansion supports incremental revenue.
Wafer-Level Optics and Stacked-CIS Migration
Wafer-level optics bond microlenses before dicing, reducing module height by up to 40% and eliminating discrete barrels. STMicroelectronics earmarked EUR 1 billion (USD 1.06 billion) from a December 2025 European Investment Bank line to expand 300 mm stacked-sensor capacity at Crolles and Agrate, locking in future Europe image sensors market output. Sony’s stacked IMX925 triples readout speed versus planar CMOS, while hybrid bonding cuts parasitic capacitance by 35 % and lifts low-light signal-to-noise ratio by 2 dB.[4]Sony Semiconductor, “LYT-901 and IMX925 Product Notes,” SONY-SEMICON.COM Hybrid-bonding tools cost up to USD 120 million each and require stringent 30 % relative-humidity control, an expense that prompts many European fabs to pursue EU Chips Act subsidies. Over the long term, the stacked transition improves per-wafer revenue and secures technology differentiation against commoditized rolling-shutter devices from new entrants, reinforcing the competitiveness of the Europe image sensors market.
AI-Enabled Industrial Machine-Vision Grants
Horizon Europe’s IMOCO4.E consortium received EUR 17 million (USD 18 million) to develop edge-computing platforms that deliver sub-10 ms latency, satisfying General Data Protection Regulation limits on cloud data transfer. PhotonHub Europe has funnelled more than 200 small and medium enterprises through photonics pilot lines, lowering the cost of integrating AI accelerators into sensor modules and catalysing factory-floor adoption. ams-OSRAM secured a EUR 227 million (USD 241 million) grant in February 2025 to quadruple through-silicon-via capability at Premstaetten for stacked industrial sensors, while Germany’s innovation fund cut false-positive defect-detection rates by up to 60 % in sponsored projects. Coupled with line-side demand for high-frame-rate global-shutter devices, these incentives enlarge the addressable slice of the Europe image sensors market in industrial automation.
Restraints Impact Analysis*
| Restraint | (~) % Impact on CAGR Forecast | Geographic Relevance | Impact Timeline |
|---|---|---|---|
| High EU Energy and Clean-Room Utility Costs | -1.20% | Germany, France, Italy | Short term (≤ 2 years) |
| Limited 300 mm CIS-Grade Capacity | -1.00% | Germany, France, Italy, Rest of Europe | Medium term (2-4 years) |
| Strict EU Data-Privacy Rules Limiting Facial-Recognition Roll-Out | -0.60% | Germany, France, United Kingdom, Italy, Rest of Europe | Long term (≥ 4 years) |
| Talent Shortage in Advanced Pixel-Design Engineering | -0.50% | Germany, France, United Kingdom, Italy | Medium term (2-4 years) |
| Source: Mordor Intelligence | |||
High EU Energy and Clean-Room Utility Costs
Electricity prices in continental Europe remain two to three times higher than those in East Asia, raising fabrication costs just as the Europe image sensors market migrates from 200 mm to energy-hungry 300 mm lines. Clean-room heating, ventilation, and air-conditioning systems consume up to 40 % of total fab energy, obliging STMicroelectronics to invest EUR 120 million (USD 128 million) in on-site solar and cogeneration to hedge price swings. KPMG’s 2025 semiconductor survey found that 66 % of regional respondents deferred capital expenditure because of energy uncertainty, well above the 51 % global average. ams-OSRAM’s EUR 567 million (USD 602 million) Premstaetten project focuses on high-mix, low-volume automotive and medical sensors with average selling prices above USD 5, avoiding cost competition with sub-USD 1 smartphone parts. Even so, nightshift scheduling to capture off-peak tariffs trims overall utilization by several percentage points, modestly dragging the aggregate growth of the Europe image sensors market.
Limited 300 mm CIS-Grade Capacity
Europe and the Middle East processed 3.2 million 300 mm wafers per month in 2025, versus China’s 10.1 million, and only a fraction possess backside-illumination modules suitable for high-performance imagers. STMicroelectronics will add just 2 000 wafers per week of incremental 300 mm capacity in 2026, leaving tight allocation for automotive and industrial customers. Tower Semiconductor’s Migdal HaEmek fab favours consumer applications, extending lead times for European automotive design houses beyond 26 weeks. As stopgap relief, vendors are separating pixel arrays and logic onto chaplets, relegating the latter to abundant 65 nm nodes while reserving scarce image-sensor wafers for the photodiode layer. The bottleneck restrains near-term volume, although margin stability partly offsets the topline impact within the Europe image sensors market.
*Our forecasts treat driver/restraint impacts as directional, not additive. The impact forecasts reflect baseline growth, mix effects, and variable interactions.
Segment Analysis
By Type: CMOS Widens its Lead on Stacked-Die Momentum
CMOS devices captured 96.19% of 2025 revenue, reflecting stacked architectures that triple pixel-readout bandwidth and backside illumination that lifts quantum efficiency by up to 40%. Sony’s 24.55-megapixel IMX925 global-shutter part runs 394 frames per second using copper-to-copper hybrid bonding, while STMicroelectronics’ 5-megapixel BrightSense reaches 4 000-electron full-well capacity for 120 decibel scenes. CCD imagers, with 3.81% share, linger in astronomy and spectroscopy because they maintain charge-transfer efficiency above 99.999%, although electron-multiplying CMOS and SPAD arrays are eroding that moat. A gradual shift toward energy-efficient mobile applications and Euro NCAP-compliant automotive cameras is expanding the CMOS slice of the Europe image sensors market.
CMOS is forecast to advance at a 9.21% CAGR, comfortably above the overall 8.66% trajectory, while CCD declines in low single digits. Much of the incremental Europe image sensors market size upside stems from stacked die that embed AI accelerators and on-chip data compression, shrinking off-sensor bandwidth needs. The feature set raises subsystem-level performance, justifying premium pricing that outweighs the higher wafer cost of through-silicon vias. Niche CCD opportunities in scientific instrumentation persist yet remain immaterial to aggregate revenue.


By Resolution: Mid-Tier Pixels Dominate, Ultra-High Tier Accelerates
The 25–64-megapixel class held 42.31% of 2025 shipments, preferred for automotive surround-view fusion and printed-circuit inspection where balanced frame rate and resolution matter. Units exceeding 200 megapixels grew from a negligible base to 200 million smartphone sockets in 2025, driven by lossless digital zoom and multi-frame super-resolution algorithms that ride hyperspectral data. That cohort is scaling at a 9.06% CAGR, outpacing all other brackets and contributing a disproportionate chunk of incremental Europe image sensors market size.
Lower bands below 8 megapixels retain relevance in reverse-camera and video-conference modules, especially as enterprise laptops upgrade webcams to 1080p. The 9–24-megapixel slot is steady at roughly one-fifth of shipments, spanning 12-megapixel selfie cameras and 20-megapixel medical endoscopes. Mid-tier momentum will persist because industrial and automotive systems cannot compromise on frame rate, yet high-resolution sensor average selling prices ensure that revenue mix skews upward, supporting the premium layer of the Europe image sensors market.
By Spectrum: Visible Stays Core, SWIR Picks Up Pace
Visible RGB units supplied 68.65% of 2025 turnover as they anchor smartphones, security cameras, and driver-assistance stacks. Near-infrared (NIR) imagers, roughly one-fifth of shipments, satisfy in-cabin driver monitoring and facial recognition under low light. Short-wave infrared sensors are expanding at an 8.94% CAGR because semiconductor wafer inspection and plastics sorting require spectral signatures beyond the silicon bandgap.
Sony’s SenSWIR indium-gallium-arsenide line penetrates wafer-level metrology, while Italian integrators use SWIR to identify polymer flake types in recycling. Ultraviolet and thermal segments combined represent less than 10% of Europe image sensors market share, yet thermal arrays enjoy steady demand in perimeter security and predictive maintenance. As SWIR costs fall and process reliability improves, new use cases add breadth to the Europe image sensors market.
By Shutter Technology: Rolling Commands Volume, Global Lifts Growth
Rolling-shutter CMOS accounted for 72.83% of 2025 value because the architecture excels in cost-sensitive, high-resolution mobile sensors. Motion artifacts limit adoption in machine vision, prompting factories to specify global-shutter parts such as onsemi’s AR0235, which captures 120 frames per second without skew. Global-shutter shipments are set to grow at a 9.54% CAGR, more than one percentage point faster than the Europe image sensors market, aided by barcode scanning, robotics, and autonomous vehicles.
Manufacturing complexity adds 30–50 % wafer cost due to storage nodes within each pixel, yet customers tolerate the premium to avoid false rejects or safety risks. Hybrid architectures are emerging in which per-pixel SRAM bolsters rolling designs for moderate speeds, blurring historical distinctions. Regardless, performance-driven users will keep gravitating to global shutters, extending the technology mix of the Europe image sensors market.
By End-User Industry: Consumer Electronics Leads, Healthcare Surges
Consumer electronics delivered 34.17% of 2025 revenue on the back of multi-camera smartphones and smart-home devices. Automotive followed at roughly 28% as Euro NCAP rules require 6–8 cameras per premium vehicle, bolstering the Europe image sensors market share of vendors aligned with front-camera, ToF, and driver-monitoring needs. Industrial automation took around 18%, benefitting from high-speed global-shutter inspection.
Healthcare is the fastest riser at a 9.34% CAGR because disposable chip-on-tip endoscopes, priced below USD 200 per unit with OmniVision’s OH0TA sensor, eliminate high sterilization overhead and cross-contamination risk. EU-funded perovskite photon-counting detectors promise lower radiation dose in X-ray imaging, reinforcing momentum. Security, aerospace, and scientific research round out the remainder, each with specialized requirements that sustain premium pricing in the Europe image sensors market.
Geography Analysis
Germany’s 28.75% 2025 share arises from its position as Europe’s automotive hub, where Tier-1 suppliers integrate six or more cameras per car to satisfy automated braking and driver-monitoring standards. Machine-vision companies in Bavaria and Baden-Württemberg consume notable volume for pharmaceutical, paint, and logistics inspection tasks. STMicroelectronics co-design centers in Munich and Stuttgart secure sockets in new safety architectures, while onsemi logged 68 % of its global ADAS design wins in Euro-compliant projects during 2025. Growth moderates to about 8.2% annually as vehicle builds plateau, but value uplift from AI-rich imagers sustains the Germany slice of the Europe image sensors market.
Italy is on track for a 9.31% CAGR through 2031, the highest in the region, because STMicroelectronics is adding 4 000 300 mm wafers per week at Agrate and directing 40 % of a EUR 1 billion (USD 1.06 billion) European Investment Bank line into local research and development. Lombardy and Emilia-Romagna medical-device clusters are early adopters of global-shutter sensors for 120 frames-per-second inspections. Avezzano-based LFoundry’s 110 nm ARCADIA process further diversifies national capability beyond consumer-grade imaging. These developments cement Italy as a high-growth pillar within the Europe image sensors market.
France, the United Kingdom, and Rest of Europe jointly comprised about 46% of 2025 value. Crolles STMicroelectronics’ flagship fab will reach 14 000 wafers per week by 2027 and anchors optical sensing and silicon photonics in France, while Sofradir and Ulis ship thermal arrays for defense. In the United Kingdom, Teledyne e2v supplies large-format CCD sensors for space telescopes, and Clarity Sensors secured a EUR 2.49 million (USD 2.63 million) grant in 2025 to productize perovskite X-ray detectors. Austria’s ams-OSRAM and the Czech Republic’s forthcoming onsemi silicon-carbide line diversify the supply chain across Rest of Europe. Collectively, these nodes enlarge the geographic breadth and resilience of the Europe image sensors market.
Regulatory Landscape
The Europe image sensors market is shaped by safety, AI governance, and machinery compliance rules that drive higher camera content in vehicles and increase compliance requirements for machine-vision deployments. The EU General Safety Regulation (applicable from July 2024) and Euro NCAP 2025-2026 assessment protocols are major pull factors for forward-facing and in-cabin imaging used in AEB, pedestrian detection, and driver monitoring. These requirements raise sensor unit count per vehicle and tighten qualification timelines for automotive-grade CIS modules.
For industrial vision systems, EU-wide policy is increasingly centered on trustworthy AI and connected-equipment safety. The EU AI Act entered into force on 1 August 2024, with full application starting 2 August 2026, increasing documentation and risk-management needs for high-risk vision use cases and reinforcing on-device processing approaches that reduce unnecessary data transfer. Regulation (EU) 2023/1230 (Machinery Regulation) becomes mandatory from 20 January 2027 and introduces explicit cybersecurity requirements for safety functions in network-connected machinery. This pushes vision system builders toward tamper-evident logging and hardened sensor-to-processor links as part of conformity assessment planning.
Competitive Landscape
Sony, Samsung, and onsemi controlled more than 70% of regional revenue in 2025, giving the Europe image sensors market a concentrated structure. Sony’s portfolio spans industrial Pregius, security Starvis, and mobile Exmor lines, and the company hinted at spinning off its sensor unit to unlock USD 35–49 billion in enterprise value. onsemi dominates automotive advanced driver-assistance cameras with a 68 % 2025 share, leveraging in-house East Fishkill 300 mm capacity to avoid external foundry bottlenecks. STMicroelectronics holds 8–10 % of regional turnover, yet its EUR 1 billion (USD 1.06 billion) credit line positions it to scale optical-sensing and silicon-photonics integration, reinforcing Europe’s indigenous stake.
Chinese challengers SmartSens, Gpixel, and GalaxyCore intensified European design-win activity in security and industrial markets during 2025, offering devices priced 20–30 % below incumbents. European vendors counter with differentiated SWIR, SPAD, and perovskite detectors that demand specialized process know-how. ams-OSRAM’s EUR 567 million (USD 602 million) Premstaetten program quadruples through-silicon-via capacity for stacked automotive and medical imagers, while STMicroelectronics’ silicon-photonics roadmap integrates diffractive optics on CIS wafers to shrink part count. Mergers, such as STMicroelectronics’ planned USD 950 million acquisition of NXP’s MEMS portfolio, broaden sensor footprints and deepen customer lock-in.
Supply concentration encourages vertical integration, with Tier-1 suppliers embedding proprietary image-signal-processing algorithms that raise switching costs. Strategic splinters in SWIR, photon-counting X-ray, and solid-state LiDAR offer whitespace for startups, yet access to scarce 300 mm lines remains a gatekeeper. Overall, sustained capital deployment by incumbents and EU grant frameworks temper share erosion, keeping leadership positions stable within the Europe image sensors market.
Europe Image Sensors Industry Leaders
Sony Semiconductor Solutions
STMicroelectronics
Samsung System LSI (ISOCELL)
OmniVision Technologies
ON Semiconductor Corporation.
- *Disclaimer: Major Players sorted in no particular order

Market Opportunities and Future Outlook
European supplier opportunities cluster around regulated automotive safety stacks and edge AI-enabled industrial inspection. In these settings, performance, traceability, and cybersecurity requirements raise the barrier to low-cost commodity sensors. Euro NCAP 2025-2026 protocols and the post-July 2024 EU General Safety Regulation have already compressed sourcing timelines for camera modules, favoring vendors that can deliver qualified NIR and visible sensors alongside robust software and interface ecosystems. In parallel, Horizon Europe-backed programs such as IMOCO4.E (EUR 17 million) and PhotonHub Europe are reducing integration friction for low-latency, on-sensor or near-sensor AI. This supports demand for global-shutter, high-frame-rate devices used in robotics, logistics, and quality control.
Another opportunity is the move toward specialized, Europe-rooted capabilities that are harder to reproduce at scale, including stacked CIS, integrated photonics, and space-grade imaging. STMicroelectronics commenced high-volume production of its PIC100 silicon photonics platform in March 2026, indicating progress toward productized integrated photonics building blocks that can pair with imaging and sensing modules in industrial and automotive systems. EU R&D pipelines also point to advanced imaging roadmaps, including the TENSIS project (with X-Fab and Airbus Defence and Space) targeting a 400-megapixel CMOS detector by 2026, supporting demand for radiation-tolerant and high-performance sensors in European space and defense programs. Together, these initiatives align with the need to manage limited CIS-grade 300 mm capacity by prioritizing higher-value, differentiated sensors over commodity mobile parts.
Recent Industry Developments
- June 2026: Sony Semiconductor Solutions announced upcoming releases of new LYTIA mobile CMOS image sensors, including the LYTIA L910 (50 effective megapixels) with 100 dB dynamic range and the LYTIA 610 (64 effective megapixels) featuring an RB2x2 On Chip Lens pixel structure. These launches reinforce the premium mobile race in Europe by pushing dynamic range and low-light performance, which in turn increases demand for advanced optics, tighter module tolerances, and higher-value sensor integration.
- October 2025: STMicroelectronics introduced the VD1943, VB1943, VD5943, and VB5943 family of 5-megapixel CMOS image sensors for industrial automation and smart retail under its ST BrightSense portfolio. The expansion targets machine-vision sockets that value robust imaging under challenging lighting and high-throughput inspection, supporting diversification beyond handset-driven cycles and strengthening European supply in industrial end markets.
- December 2024: Photonics Management acquired BAE Systems Imaging Solutions division, adding aerospace-grade CMOS capabilities to its portfolio. The deal consolidated specialized imaging know-how relevant to defense and space applications and strengthened Europe-facing access to high-reliability sensor design and manufacturing resources.


Research Methodology Framework and Report Scope
Market Definition and Coverage
This market covers the revenue generated from image sensors sold and used across Europe, where sensors convert light into electronic signals for imaging in devices and systems across end uses.
Scope exclusions: We exclude downstream camera modules, lenses, software, and full imaging systems, and we count only the sensor component value within Europe.
Segmentation Overview
- By Type
- CMOS
- CCD
- By Resolution
- Less Than Equal to 8 MP
- 9 - 24 MP
- 25 - 64 MP
- 65 - 200 MP
- More than 200 MP
- By Spectrum
- Visible (RGB)
- Near-Infrared (NIR)
- Short-Wave Infrared (SWIR)
- Ultraviolet (UV)
- Thermal / Long-Wave Infrared (LWIR)
- By Shutter Technology
- Rolling-Shutter CMOS
- Global-Shutter CMOS
- By End-User Industry
- Consumer Electronics
- Healthcare
- Industrial
- Security and Surveillance
- Automotive and Transportation
- Aerospace and Defense
- Other End-User Industries
- By Country
- United Kingdom
- Germany
- France
- Italy
- Rest of Europe
Data Sources, Market Sizing, and Validation
Desk Research
Desk research started with public and official references to anchor the demand environment for imaging and electronics in Europe. We leaned on sources such as Eurostat for industrial production and trade context, the European Commission and EU legislation portals for safety and technology policy signals, and EPO and other patent databases to track activity around CMOS, global shutter, and emerging spectra sensors.
To avoid building the model on one single data series, we added context from company filings and investor presentations, trade association pages, and reputable press coverage of manufacturing output, automotive safety timelines, and device cycles. A paid company financials and intelligence subscription was used selectively to standardize revenue mapping and cross-check regional exposure where public disclosures were not directly comparable. These desk research sources are illustrative only, and many other public references were also reviewed for data collection, validation, and clarification.
Primary Interviews and Surveys
Primary work was used to pressure-test the desk assumptions with people who see pricing, mix shifts, and adoption up close, including sensor suppliers, channel participants, and contacts from the device and module ecosystem, plus engineering or procurement stakeholders tied to major end uses. Because this is a Europe market, inputs were balanced across major European demand centers, and interviews were used to confirm where value is moving (for example, toward automotive, industrial vision, and higher performance CMOS designs).
Distribution of primary research fieldwork respondents
| Company type | Respondent position |
|---|---|
| Top tier: 33% | CXOs: 14% |
| Mid tier: 53% | Functional/Unit leaders: 28% |
| Smaller Players: 14% | Managers: 58% |
Market-Sizing & Forecasting
The core model is built using a top-down approach where Europe demand is reconstructed from end-market activity and adoption, and then allocated into image sensor value based on penetration and content per device (for example, cameras per vehicle and imaging intensity in industrial automation). After that, selective bottom-up approximations are used as a check, such as sampled shipment runs multiplied by practical average selling price bands and channel conversations on mix.
A few inputs that matter for this market were tracked closely, which include camera content per vehicle tied to ADAS and in-cabin monitoring, smartphone and consumer device replacement cycles, industrial machine vision investment trends, and the share shift between CMOS and CCD in Europe shipments. Resolution and spectrum mix (RGB versus NIR and SWIR) were treated as value levers because they influence pricing and design wins, and shutter type (rolling versus global) was used as another pricing and application marker. Forecasting was then done using scenario analysis, where the base case is guided by expert consensus on adoption timing and pricing progression, and the scenarios flex variables like automotive camera content, industrial demand, and average price erosion.
Where bottom-up checks were incomplete due to limited visibility on smaller shipments, gaps were handled through conservative ranges tied to validated end-use demand indicators, and then reviewed again with primary inputs before finalizing totals.
Data Validation & Update Cycle
Validation was done through multiple passes, where model totals were compared against independent signals like end-market production indicators, technology adoption milestones, and observed pricing and mix direction from interviews. Any large variances were flagged, and the underlying drivers were re-checked, followed by a second analyst review so assumptions stay consistent across years within the Europe scope.
The report is refreshed annually, and interim updates are made when material events shift demand, supply, or pricing. Before delivery, a final pass is completed to incorporate the latest public releases and to re-contact sources when a key assumption moves beyond an acceptable range.
Mordor Intelligence's Europe Image Sensors Market Market Size Versus Other Published Estimates
Published market sizes for Europe image sensors can vary even when they look like they are talking about the same thing, since each publisher draws the boundary of what is counted and which year is treated as the anchor point. Differences also show up when pricing is modeled as a simple average versus a mix-driven average that changes with resolution, spectrum, and shutter types.
By tracking pricing mix by key specifications and refreshing scope checks across Europe end uses, Mordor Intelligence keeps the 2025 value tied to sensor-only revenue rather than broader imaging stacks, which is one common reason totals drift across sources.
Benchmark comparison
| Source | Market Size | Gaps in Research Methodology |
|---|---|---|
| Mordor Intelligence | USD 3.75 B (2025) | |
| Global Consultancy A | USD 3.44 B (2024) | Uses an earlier base year and often blends sensor value with broader imaging electronics assumptions, and then applies a smoother CAGR path that can understate mix-led price uplift in automotive and industrial. |
| Regional Consultancy B | USD 4.10 B (2024) | Tends to include a wider set of sensor types and application mappings (for example, infrared and ToF treated as a broader bucket), and the Europe cut can be scaled using less consistent regional exposure logic across companies. |
The spread in the table is mainly explained by year alignment and what gets counted as part of the image sensor value chain. When scope is kept sensor-only and inputs are tied back to adoption and mix variables that buyers can verify, the final number becomes easier to explain and repeat across updates.


Key Questions Answered in the Report
What is the forecast value of the Europe image sensors market by 2031?
It is expected to reach USD 6.21 billion, up from USD 4.1 billion in 2026.
Which country is projected to grow fastest in European image-sensor demand?
Italy, with a 9.31% CAGR driven by new 300 mm capacity additions and a growing medical-device base.
Why are global-shutter sensors gaining share in factory automation?
They eliminate motion blur at high line speeds, improving defect-detection accuracy and reducing false rejects.
How are EU regulations influencing automotive camera adoption?
Euro NCAP and the General Safety Regulation mandate forward and driver-monitoring cameras, lifting the minimum camera count per new vehicle.
What technology shift supports higher resolution without thicker camera modules?
Wafer-level optics bond lenses directly onto the sensor wafer, cutting module height by as much as 40%.
Which spectral band is growing fastest in Europe's image-sensor applications?
Short-wave infrared sensors, expanding at an 8.94% CAGR as industries adopt spectral imaging for quality control.
Page last updated on:


 Your data is secure and never sold or shared.


