Aerospace & Defense
8th MayFeasibility Analysis for FBO Services in East Africa
3 Min Read
The Europe Defense Market Report is Segmented by Armed Forces (Air Force, Army, and Navy), Type (Personnel Training and Protection, Vehicles, Weapons and Ammunition, Unmanned Systems, and More), Domain (Land, Air, Naval, and More), Procurement Nature (Indigenous Production and Foreign Procurement), and Geography (United Kingdom, Germany, France, Italy, Spain, and More). The Market Forecasts are Provided in Terms of Value (USD).
Market Overview
| Study Period | 2019 - 2031 |
|---|---|
| Base Year For Estimation | 2025 |
| Forecast Data Period | 2026 - 2031 |
| Market Size (2026) | USD 142.42 Billion |
| Market Size (2031) | USD 194.39 Billion |
| Growth Rate (2026 - 2031) | 6.42 % CAGR |
| Market Concentration | High |
Major Players *Disclaimer: Major Players sorted in no particular order. Image © Mordor Intelligence. Reuse requires attribution under CC BY 4.0. |
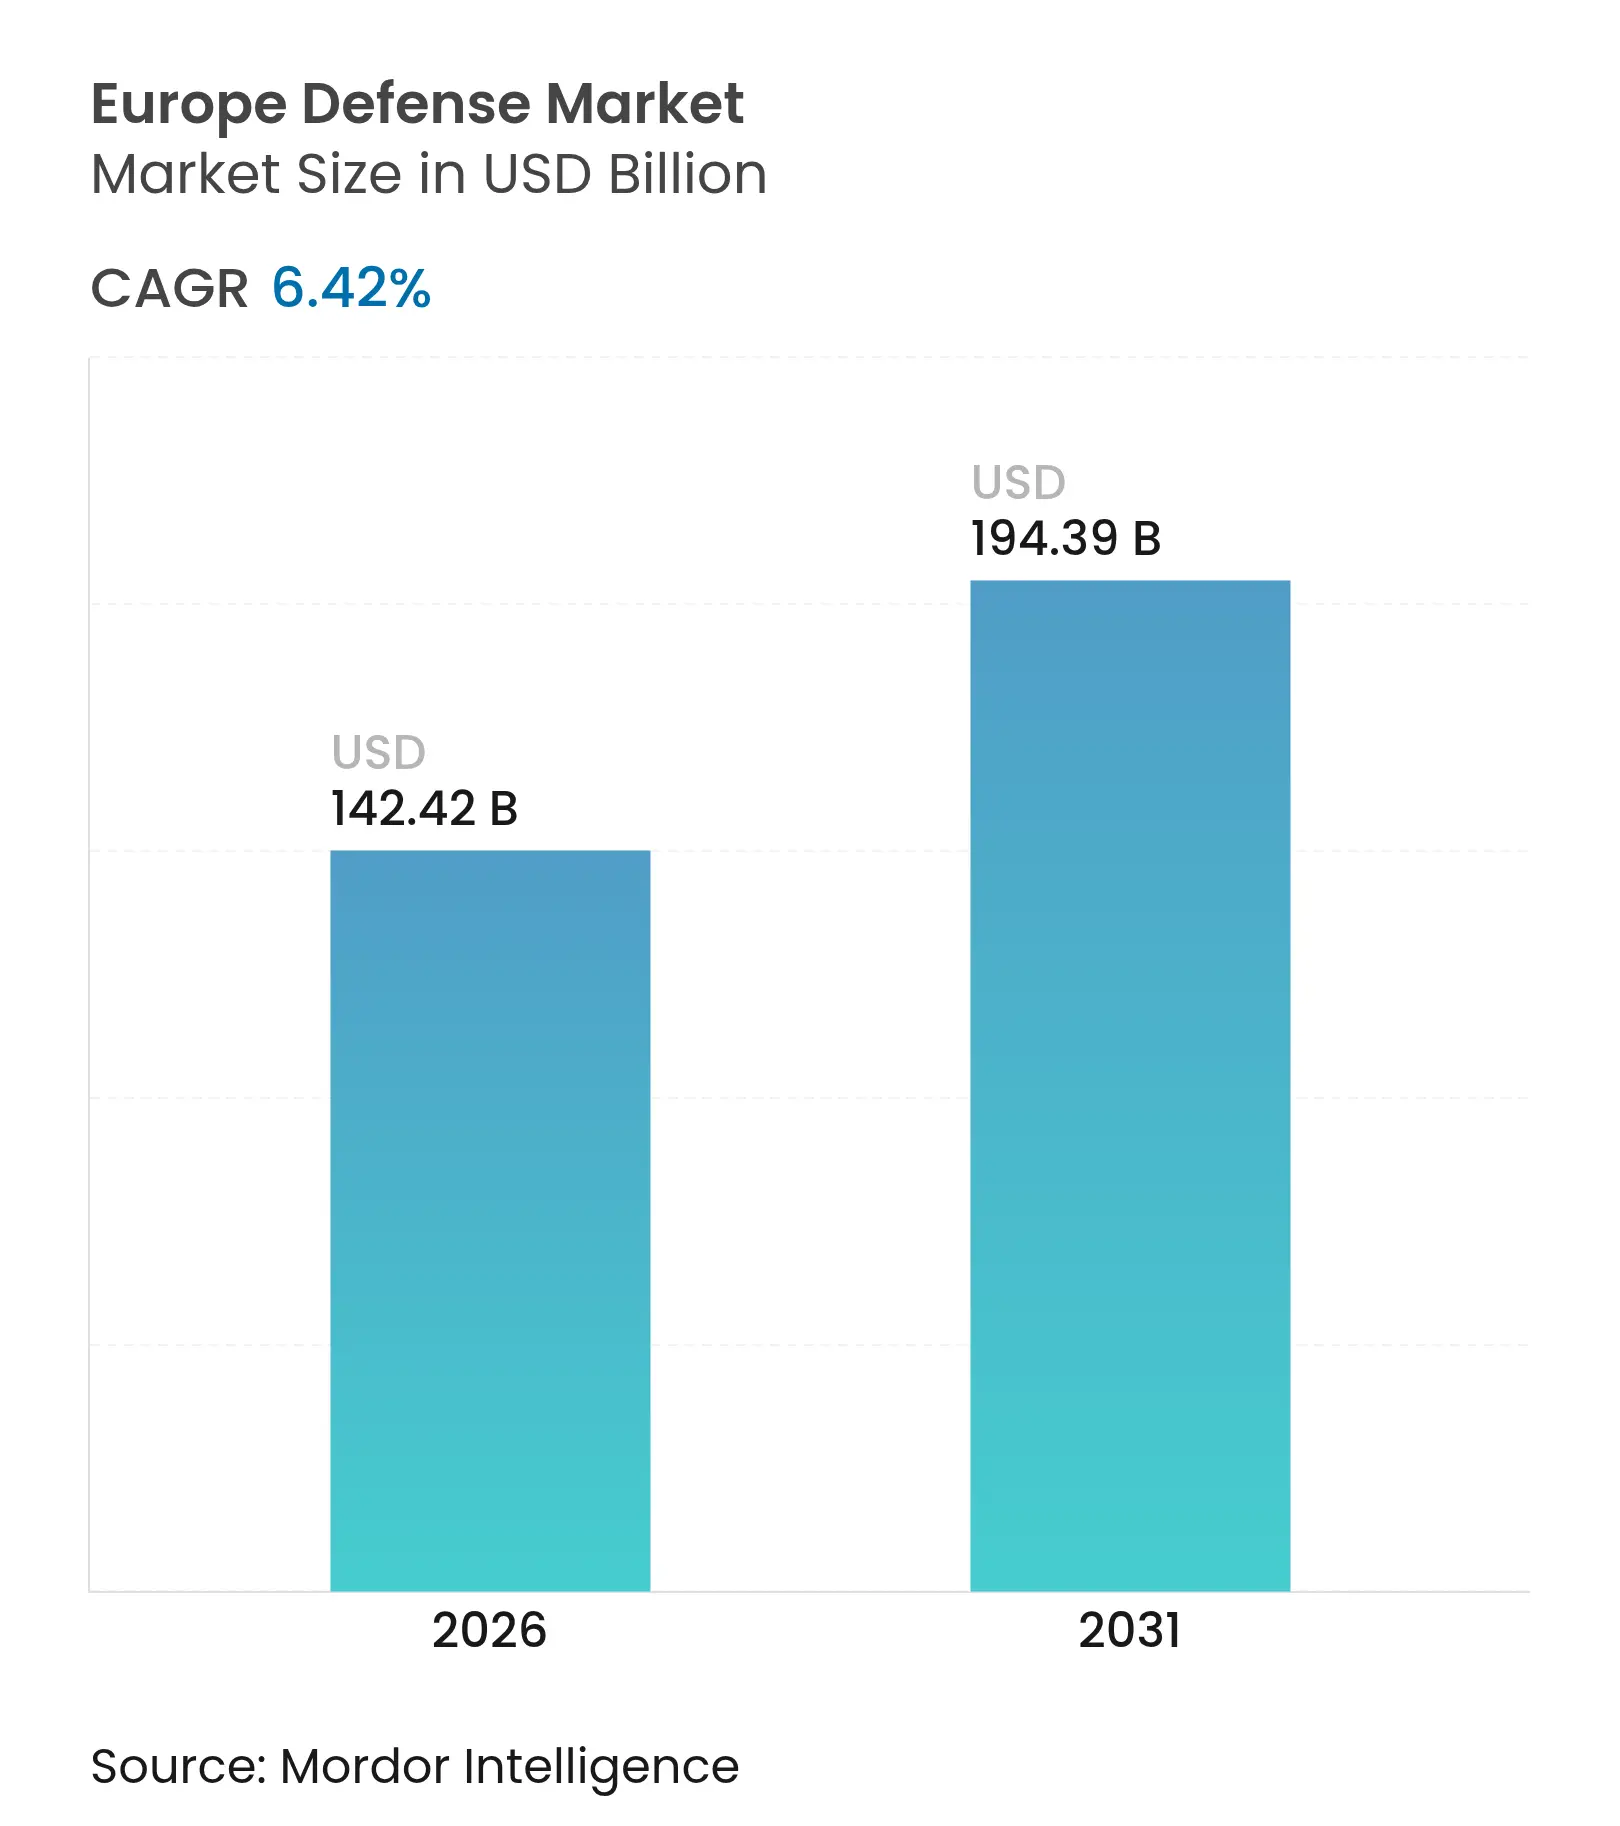
The Europe defense market size is expected to grow from USD 133.54 billion in 2025 to USD 142.42 billion in 2026 and is forecasted to reach USD 194.39 billion by 2031 at a 6.42% CAGR over 2026-2031. Expanding NATO commitments to higher, sustained defense outlays are pushing multi‑year procurement pipelines and capacity investments across land, air, maritime, and space programs, reinforcing structural growth in the Europe defense market. Russia’s 2024 defense budget reached USD 149 billion, equal to 7.1% of GDP, which sharpened focus on munitions production, integrated air defense, and naval deterrence in frontline and near-frontline countries. Governments are elevating resilience through common procurement frameworks and local industrialization rules that favor European content and interoperable systems across alliances. The European defense market is also seeing a shift toward network‑centric concepts, where software and data integration drive battlefield advantage and create opportunities for new entrants to complement legacy primes.
Key Report Takeaways
Note: Market size and forecast figures in this report are generated using Mordor Intelligence's proprietary estimation framework, updated with the latest available data and insights as of January 2026.
Drivers Impact Analysis
| Driver | (~) % Impact on CAGR Forecast | Geographic Relevance | Impact Timeline | |||
|---|---|---|---|---|---|---|
NATO defense spending threshold accelerates national budget alignments NATO defense spending threshold accelerates national budget alignments | +1.2% | Global, strongest in Eastern Europe | Medium term (2-4 years) | (~) % Impact on CAGR Forecast:+1.2% | Geographic Relevance:Global, strongest in Eastern Europe | Impact Timeline:Medium term (2-4 years) |
EU defense fund incentives boost cross-border R&D and capability programs EU defense fund incentives boost cross-border R&D and capability programs | +0.8% | EU27, EEA, Ukraine eligible under EDIP | Medium term (2-4 years) | |||
Russia–Ukraine conflict intensifies defense preparedness and threat awareness Russia–Ukraine conflict intensifies defense preparedness and threat awareness | +1.8% | Global with spillover to APAC core | Short term (≤ 2 years) | |||
Adoption of multi-domain operations reshapes European force planning Adoption of multi-domain operations reshapes European force planning | +0.7% | NATO core, early gains in Germany, UK, France | Medium term (2-4 years) | |||
Rapid prototyping pathways (EDIDP, ASAP) Rapid prototyping pathways (EDIDP, ASAP) | +0.5% | EU27, Norway | Medium term (2-4 years) | |||
Sovereign missile defense development gains traction through initiatives like Sky Shield Sovereign missile defense development gains traction through initiatives like Sky Shield | +1.0% | ESSI members, strongest in Germany, Baltics | Medium term (2-4 years) | |||
| Source: Mordor Intelligence | ||||||
NATO Defense Spending Threshold Accelerates National Budget Alignments
Allied governments are anchoring defense allocations to GDP formulas that reduce annual volatility and enable industry to plan multi‑year capacity expansions in the Europe defense market. NATO members signaled a path to higher, sustained outlays beyond the longstanding 2% guidance, and all Allies continued to prioritize readiness and stockpile rebuilding in 2026 after a notable step‑up in 2025. The UK has committed to reaching 2.5% of GDP by 2027, with an ambition to reach 3% in the next Parliament, which tightens the demand outlook for air power, land systems, and maritime protection.[1]HM Government, “Strategic Defence Review 2025: Making Britain Safer,” GOV.UK, gov.uk Sweden met the 2.0% benchmark in its first year of NATO membership, reinforcing the broader European pivot to territorial defense and deterrence. Germany’s new Act on Accelerated Planning and Procurement, effective January 15, 2026, is designed to streamline acquisitions and give preference to interoperable, off-the-shelf European solutions that support scale efficiencies in the Europe defense market. As these measures take hold, budget automaticity is creating predictability for contractors to expand ammunition, air‑defense, and C4ISR capacity without overexposure to stop‑start cycles in the Europe defense market.
EU Defense Fund Incentives Boost Cross‑Border R&D and Capability Programs
EU instruments are bringing together Member States and industry into larger, cross-border teams that share risk across research, development, and early procurement in the Europe defense market. The European Defence Industry Programme embeds a “Buy European” presumption that caps non‑EU content at 35% on common procurements and permits up to 25% EU co‑funding when nations aggregate demand, which lifts participation by mid‑tier suppliers and dual‑use innovators. EDF and EDIP create incentives for at least three entities from three countries to collaborate, accelerating technology transfer between primes and software‑centric suppliers across sensors, AI, and counter‑UAS. The Commission’s Defence Readiness Roadmap, published in October 2025, outlined a pathway to scale defense and space within the post‑2027 budget framework, signaling durable institutional support for the Europe defense market.[2]European Commission Staff, “Defence Readiness Roadmap,” European Commission, commission.europa.eu As these mechanisms mature, common standards and pooled logistics are likely to compress unit costs and reduce fragmentation in key product lines. This architecture encourages suppliers to invest in modular designs and digital engineering that meet both national requirements and joint European specifications.
Russia–Ukraine Conflict Intensifies Defense Preparedness and Threat Awareness
Russia’s spending rose to USD 149 billion in 2024, at 7.1% of GDP, which raised the stakes for European readiness, stockpile health, and strategic depth in the Europe defense market. The war exposed shortfalls in artillery ammunition, integrated air defense, and repair capacity that European governments are now addressing with targeted investments and coordinated procurement. Donor support to Ukraine has also sharpened focus on standardization and sustainment, since the diversity of platforms in theater strained logistics and maintenance planning across multiple supply lines. Frontline states increased outlays at the fastest pace and moved to larger active forces, which is reshaping the mix of orders toward air defense, armor, and layered ISR in the Europe defense market. The cumulative effect is a more urgent and sustained posture that prioritizes rapid fielding and high-volume production over bespoke, long‑cycle programs. This momentum is influencing alliance doctrine and accelerating the adoption of multi‑domain command constructs that rely on resilient communications and sensor fusion.
Adoption of Multi‑Domain Operations Reshapes European Force Planning
NATO’s multi‑domain focus brings land, air, maritime, cyber, and space under unified command processes, which is steering budgets toward data‑centric architectures and attritable systems in the Europe defense market. During Exercise Dynamic Front 25, the US Army coordinated cross‑domain fires with multinational partners across Northern and Central Europe, demonstrating the operational benefits of integrated targeting and digitally networked formations. Germany’s deployment of AI‑enabled battle management tools is improving real‑time processing of reconnaissance data from drones, satellites, and radar nodes, illustrating how software accelerates decision cycles in the Europe defense market. The UK’s Strategic Defence Review sets out a “Digital Targeting Web” by 2027, anchored by sovereign cloud and data pipelines that push actionable information to the tactical edge. This doctrine increases demand for affordable drones, loitering munitions, and software‑defined radios that can be iterated quickly to match evolving threats. The shift rewards suppliers that can integrate sensors, effectors, and command apps into resilient kill chains at scale.
Restraints Impact Analysis
| Restraint | (~) % Impact on CAGR Forecast | Geographic Relevance | ||||
|---|---|---|---|---|---|---|
Budget constraints due to competing energy transition priorities Budget constraints due to competing energy transition priorities | -0.6% | EU27, strongest in Southern Europe | Medium term (2-4 years) | (~) % Impact on CAGR Forecast:-0.6% | Geographic Relevance:EU27, strongest in Southern Europe | :Medium term (2-4 years) |
Supply chain disruptions in energetic materials Supply chain disruptions in energetic materials | -0.9% | Global, concentrated in EU ammunition producers | Short term (≤ 2 years) | |||
Inconsistent export licensing policies across EU member states Inconsistent export licensing policies across EU member states | -0.4% | EU27, EEA | Long term (≥ 4 years) | |||
Limited availability of skilled labor for systems integration Limited availability of skilled labor for systems integration | -1.1% | EU27, UK, Norway | Medium term (2-4 years) | |||
| Source: Mordor Intelligence | ||||||
Budget Constraints Due to Competing Energy Transition Priorities
Member States are balancing a multi-year rearmament push with the financing demands of the energy transition, keeping budget trade-offs in focus in the Europe defense market. REPowerEU requires significant additional public and private investment through 2027, and compliance costs for carbon‑intensive inputs continue to influence production economics for heavy industry.[3]Source: European Commission Staff, “REPowerEU,” European Commission, commission.europa.eu Italy’s 2026 defense allocation stands at EUR 31.3 billion (USD 36.83 billion), around 1.2% of GDP, according to European Commission projections, underscoring fiscal constraints in Southern Europe. EU fiscal rules have been adapted to improve flexibility, but national deficit procedures still limit the speed at which some countries can lift spending to alliance targets. Where governments have created special funds or procurement fast‑tracks, execution remains the key variable that determines industrial throughput in the Europe defense market. Over the medium term, the pacing challenge is to lock in stable defense cash flows without crowding out energy transition priorities in already tight budgets.
Supply Chain Disruptions in Energetic Materials
Europe’s ammunition ramp depends on inputs such as cotton linters for nitrocellulose propellants and niche metals, where import concentration raises operational risk in the Europe defense market. China accounts for a large share of cotton linters used in European nitrocellulose, and export controls on several critical materials since 2024 have tightened global supply. Shortfalls and long lead times affected delivery schedules, and the EU missed its shell replenishment goal for 2024 by several months, highlighting fragility in the upstream chain. New investments under the EU’s raw materials agenda will take several years to bring supply online, keeping a multi‑year vulnerability window for energetic materials. Ammunition producers have responded with capacity additions and, where possible, dual sourcing, but scale remains constrained by feedstock availability. In the near term, targeted stockpiles and collaborative procurement aim to smooth demand, while governments pursue de‑risking of critical inputs in the Europe defense market.
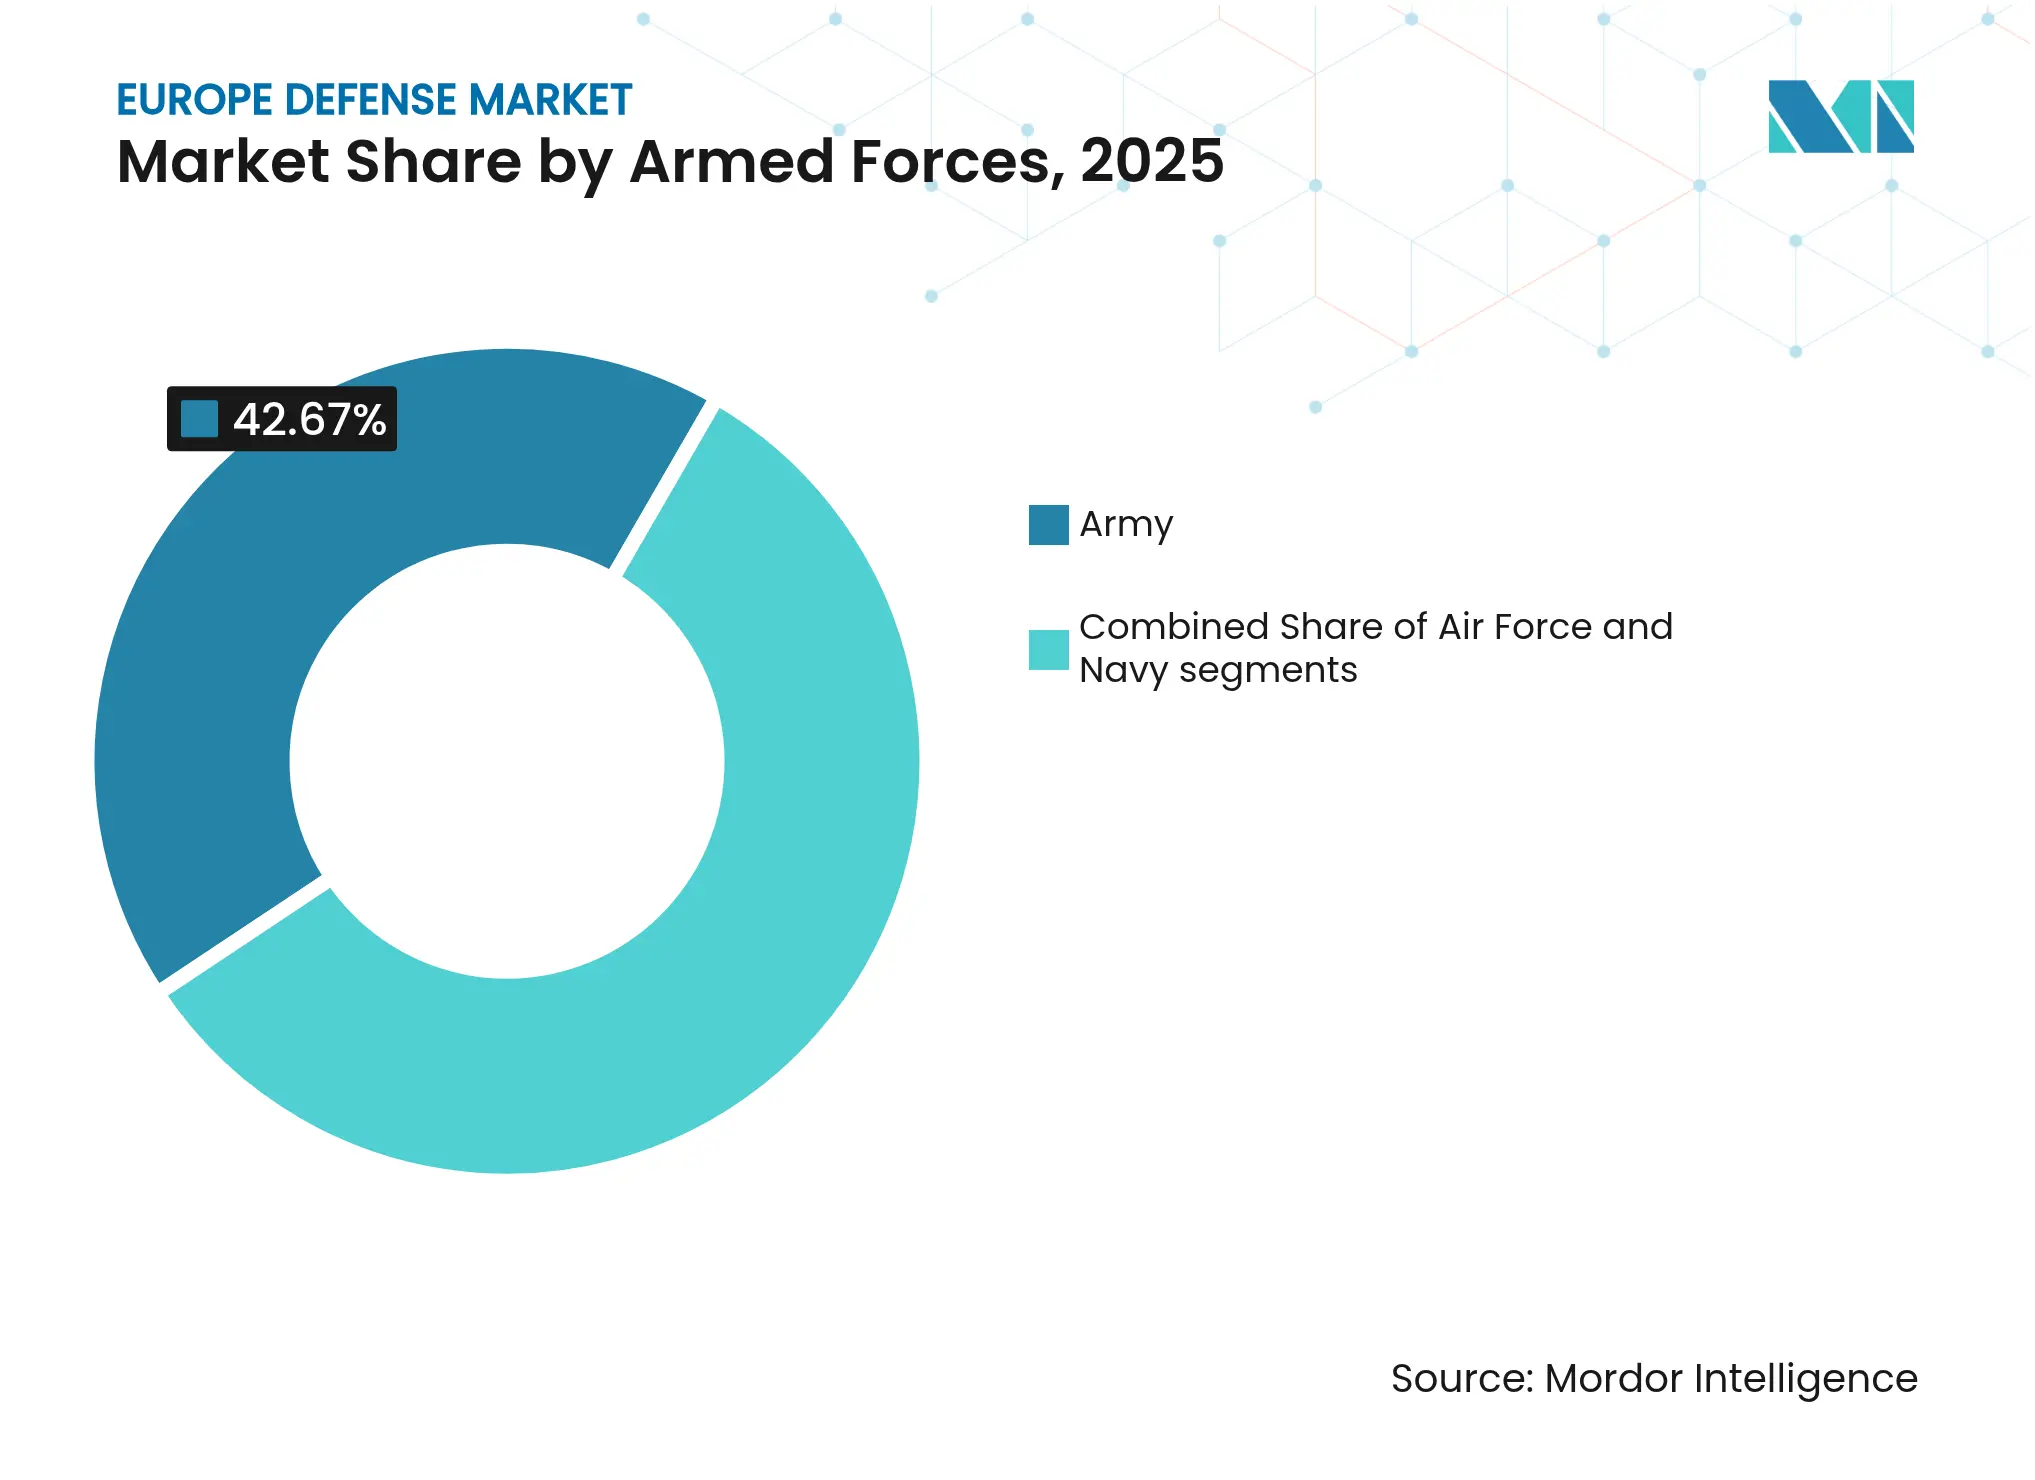
By Armed Forces: Navy Expansion Leads Growth
The Army held 42.67% of the Europe defense market share in 2025, reflecting the renewed emphasis on territorial defense, integrated air and missile defense, and mechanized formations. This share aligns with the shift toward higher readiness levels and deeper munitions and spares stocks across European land forces. The Navy is projected to expand the fastest at 7.67% CAGR through 2031, supported by Baltic and North Atlantic initiatives that prioritize anti‑submarine warfare, surface combatants, and maritime domain awareness. Cross‑domain integration is also lifting demand for maritime ISR and command‑and‑control nodes that connect naval assets with joint fires networks in the Europe defense market. Kongsberg’s December 2025 agreements to provide combat‑system elements and navigation systems for German and Norwegian 212CD submarines illustrate momentum in undersea capabilities and industry partnerships.
Across air forces, upgrades continue on sensors, electronic warfare, and air policing, while planning for next‑generation combat air emphasizes sovereign data pipelines and joint effectors. Exercises such as Dynamic Front 25 validate coalition fire coordination and logistics at scale, reinforcing procurement of interoperable radios, data links, and software‑defined capabilities in the Europe defense market. Naval modernization goals are drawing attention to shipyards able to deliver on time with proven systems integration, a factor that is consolidating orders with vendors demonstrating reliable execution. Interoperability within NATO is driving purchases of munitions and communications that meet standardized standards, reducing sustainment risk and accelerating fielding in the Europe defense market. The Army’s enduring share and the Navy’s growth profile underscore a portfolio rebalancing that supports deterrence across land corridors and maritime chokepoints.
Note: Segment shares of all individual segments available upon report purchase
By Type: Unmanned Systems Outpace Platforms
Vehicles captured 48.85% of the European defense market in 2025, underpinned by main battle tank recapitalization, infantry fighting vehicle procurement, and self‑propelled artillery programs. Orders for layered air defense and integrated firepower continue to complement ground combat systems, with suppliers integrating sensors and effectors into digital command networks across the European defense market. Unmanned systems are forecast to grow the fastest, at a 7.12% CAGR, as drone swarms, counter‑UAS, and loitering effectors reshape the tactical edge and compress the targeting cycle. Germany’s rollout of AI‑enabled reconnaissance processing for brigade‑level formations highlights how autonomy and software lift operational tempo and survivability, including against massed aerial threats. Orders for mobile air‑defense cannons such as Skyranger also reflect the urgency of kinetic counter‑UAS solutions that can be fielded fast and sustained at scale in the Europe defense market.
Munitions and missile production are accelerating with multi‑year funding visibility and factory expansions, reinforcing strategic depth for deterrence and allied support. MBDA’s intake surged in 2024 and 2025 versus pre‑2021 levels, signaling multi‑layer air‑defense demand and long‑range precision fires momentum in the Europe defense market. Software‑centric C4ISR, EW, and training solutions are also gaining share as doctrine moves toward multi‑domain operations where data fusion and targeting automation define advantage. The United Kingdom’s force‑mix concept, which balances crewed and uncrewed systems, prioritizes reusable platforms and consumable effectors, a shift that favors modularity and high‑volume production. Taken together, the mix of vehicles, missiles, and autonomy underscores a cycle favoring iterative upgrades, rapid prototyping, and plug‑and‑play architectures in the Europe defense market.
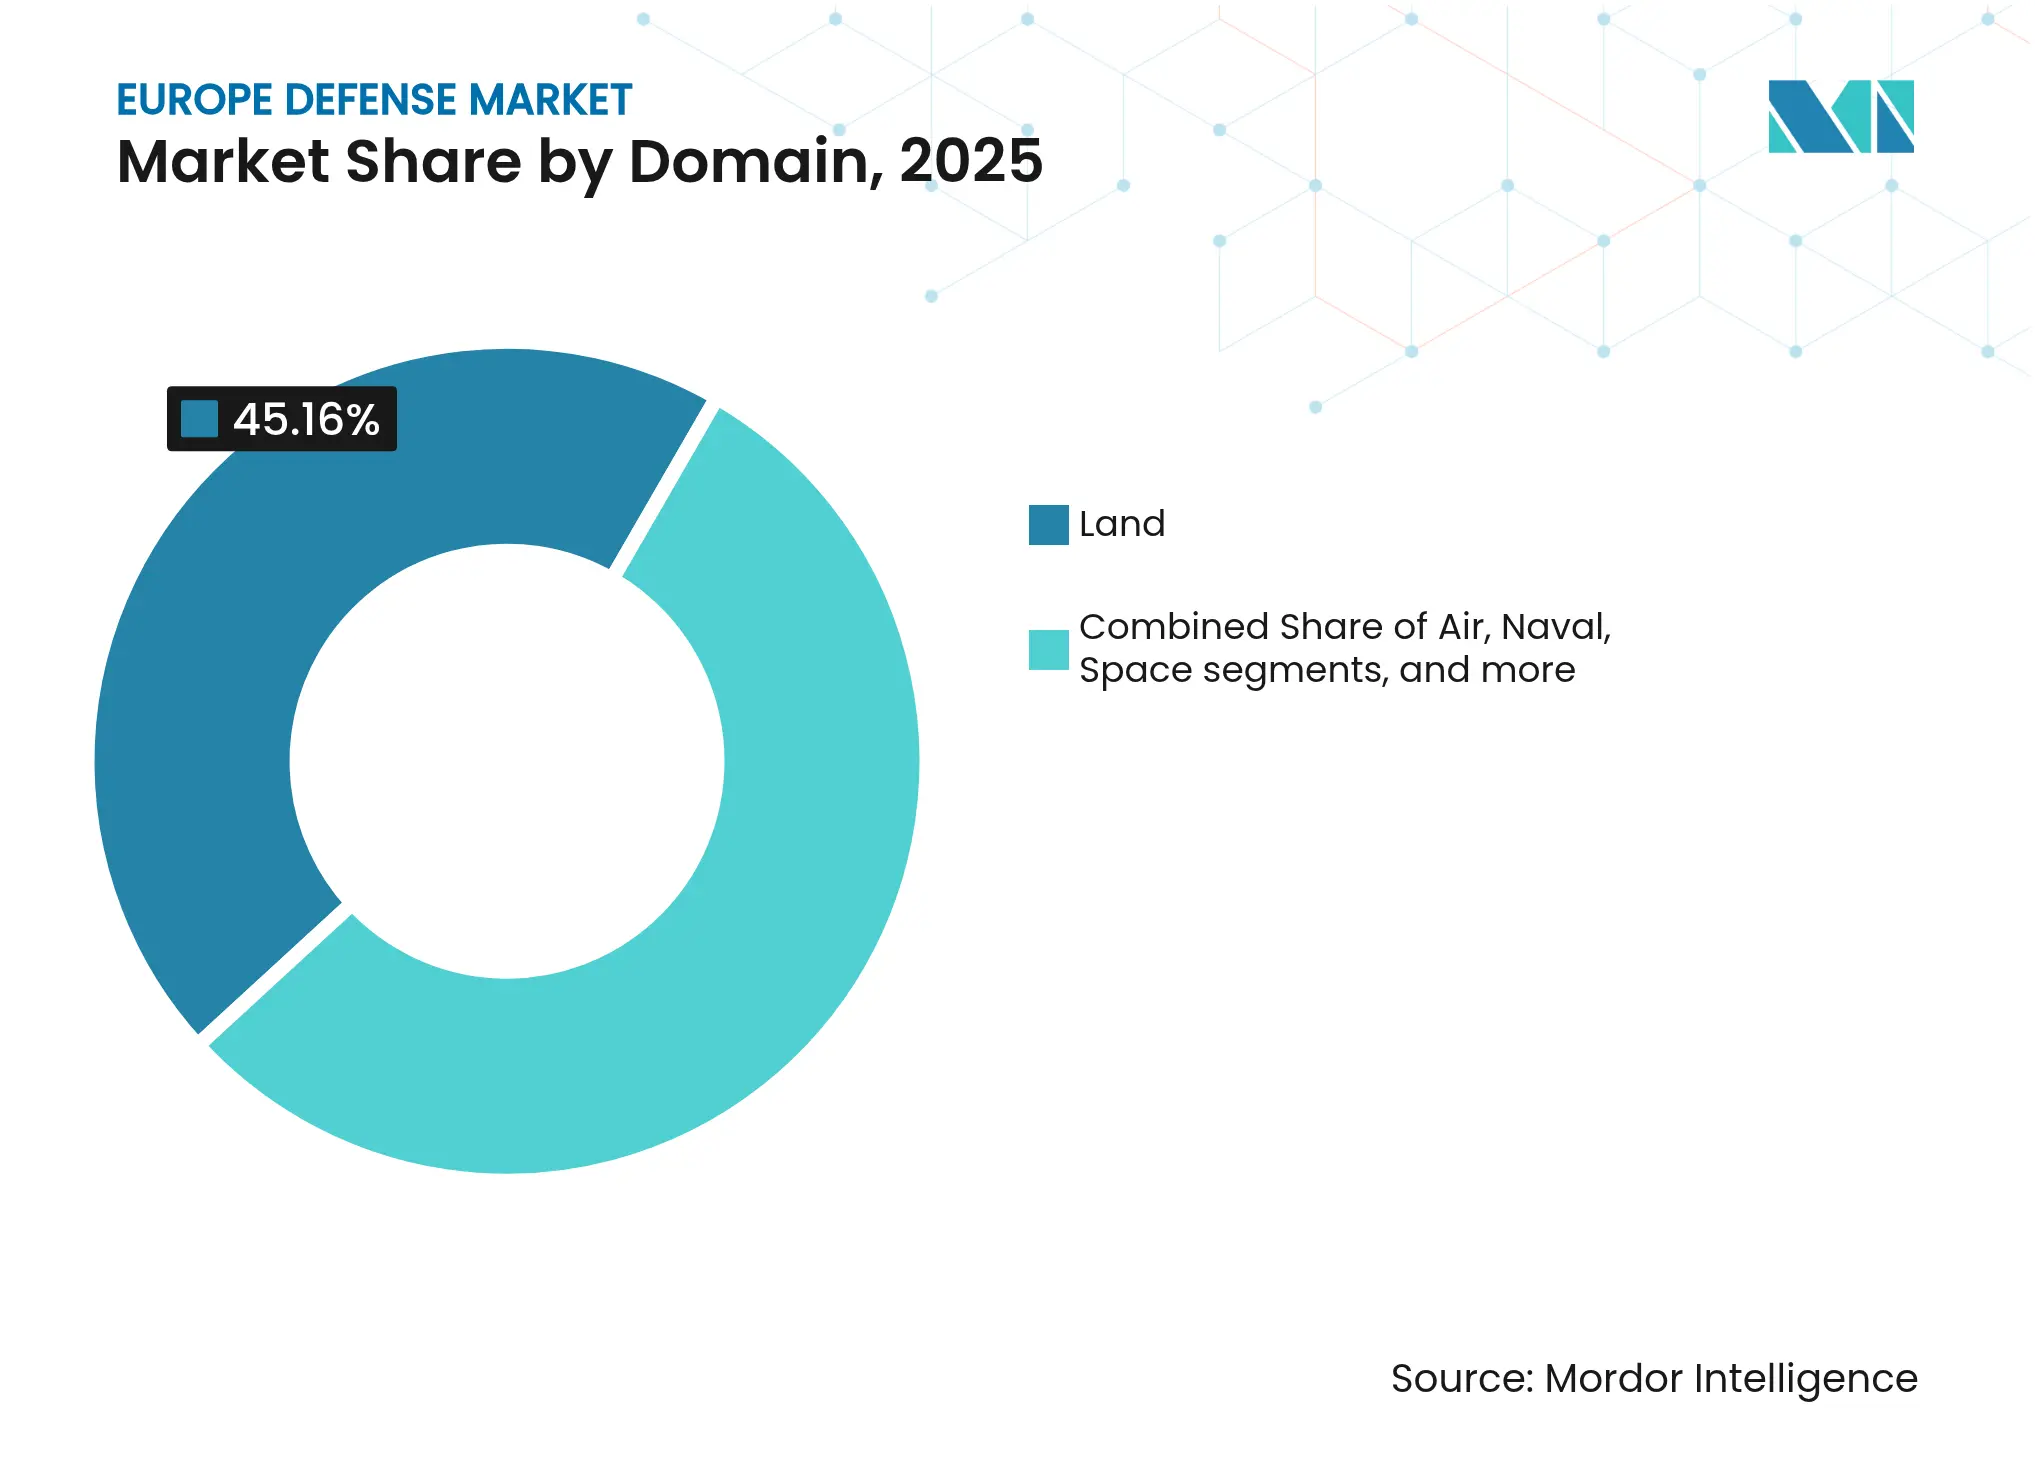
By Domain: Space Surges on Intelligence Demands
Land operations accounted for 45.16% of the market in 2025 as armor, fires, ground‑based air defense, and sustainment received funding priority in the Europe defense market. Procurement plans focus on layered air defense, survivability upgrades, and integrated communications to enable maneuver under contested electromagnetic conditions. Air domain investments continue in sensors, EW, and command networks as European air forces balance near‑term upgrades with future combat air planning that emphasizes data‑driven operations. Space is projected to post the highest growth at an 8.15% CAGR to 2031, with governments investing in satellite constellations for early warning, ISR, and resilient communications that connect multi‑domain kill chains in the Europe defense market. In 2025, Rheinmetall and ICEYE won a billion‑euro contract to supply satellite‑intelligence constellations to the German Armed Forces, underscoring the pivot to sovereign space‑based ISR.[4]
Consolidation in the European space sector, such as the Airbus‑Leonardo‑Thales MoU to merge space activities, is aimed at achieving scale, autonomy, and export competitiveness by 2027. As allied doctrine shifts to multi‑domain constructs, space‑to‑ground integration and protected satcom links have become foundational, supporting secure targeting and cross‑domain fires in the Europe defense market. The accelerating fielding of commercial‑heritage satellites and synthetic‑aperture radar adds refresh cycles that are faster than legacy space programs. These capabilities reduce dependence on non‑European providers and harden communications against jamming and cyber threats. The space domain’s growth premium reflects both the demand for resilience and the maturation of Europe’s technology base.
Note: Segment shares of all individual segments available upon report purchase
By Procurement Nature: Indigenous Production Dominates
Indigenous production accounted for 66.22% of the market in 2025 and is projected to post the fastest growth at 7.89% CAGR, supported by EU frameworks that promote European content and cross‑border teaming in the Europe defense market. EDIP’s “Buy European” clause caps non‑EU content at 35% in qualifying common procurements and raises co‑funding intensity for aggregated demand, which strengthens local supply chains and standardization. Germany’s 2026 procurement law centralizes and accelerates awards for off‑the‑shelf and interoperable solutions, improving predictability and favoring firms with proven delivery records. The Commission’s SAFE facility, approved in January 2026, channels funding to Member States, with the requirement that at least 65% of procurement originate in Europe or Ukraine, thereby reinforcing regional capacity and allied support goals.
Foreign procurement, at 33.78%, remains vital in categories where European alternatives are still scaling or where alliance interoperability favors specific systems. Air‑defense and air‑power portfolios continue to include transatlantic programs alongside European kits, with commonality and availability shaping purchase decisions in the Europe defense market. An immediate test for Europe’s new procurement incentives will be whether framework agreements and higher thresholds can translate policy intent into factory output. The Commission’s Defense Readiness roadmap and proposed procurement omnibus aim to streamline execution and sustain capacity over multiple budget cycles. In an elevated threat environment, predictable orders and shorter acquisition paths are critical for closing supply gaps in missiles, ammunition, and sensors across the Europe defense market.
Russia retained a 31.23% share in 2025, reflecting the scale of its defense allocation and production mobilization, which sharpened European focus on deterrence and stockpile rebuilding. Poland is projected to expand at the fastest rate, with an 8.32% CAGR through 2031, as it continues to place multi‑year orders and increase manpower focused on territorial defense and integrated air defense. Poland's defense burden of 4.48% of GDP led the alliance in 2025, followed by Baltic peers that maintained high shares in response to proximity risks on the eastern flank. Germany's industrial base is also scaling in 2026, with prime contractors signaling higher revenue run‑rates tied to armor, air defense, and ammunition demand in the Europe defense market.
Western European core markets are aligning their long‑term plans with alliance benchmarks, including the UK's commitment to reach 2.5% of GDP by 2027, with a longer‑term ambition of 3%. France advanced its defense trajectory into the current budget cycle, and Sweden met the 2.0% level in its first year of NATO membership in 2025, indicating broad‑based momentum across the Europe defense market. Southern Europe continues to calibrate the pace of uplift within fiscal constraints, while the Netherlands and the Nordics have advanced air defense and ISR programs that enhance regional deterrence. These shifts are redistributing growth toward Central and Eastern Europe, where threat proximity and infrastructure needs are most acute.
Europe's collective assistance to Ukraine remains substantial, with France reporting that Europe has become the primary donor and principal source of military financing, including a loan package earmarked primarily for defense equipment with Ukrainian and European preference. This funding flow aligns with procurement incentives that prioritize European content and joint production, which supports capacity growth and common standards in the Europe defense market. The result is a more integrated regional posture across munitions, air defense, and ISR that is reinforcing deterrence credibility. Over the forecast horizon, Poland's and the CEE cluster's growth leadership will likely persist as long as threat assessments and procurement execution remain aligned with alliance planning.

Reports are available across multiple geographies.
Gain in-depth market insights across regions to support informed decisions.
Market Concentration
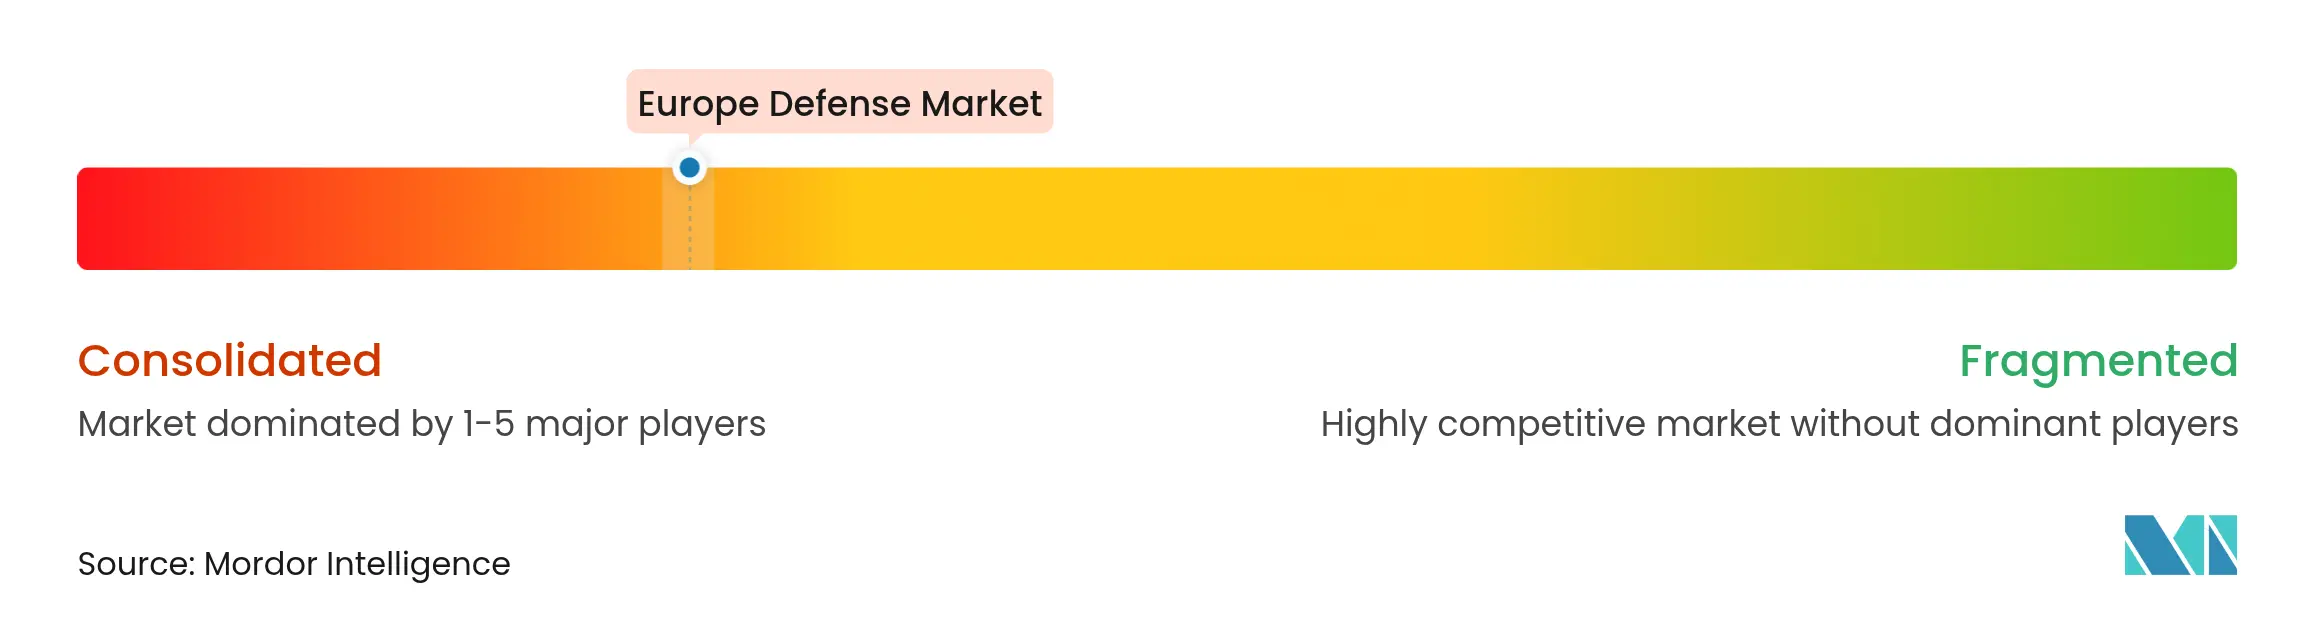
Competitive intensity is high, and fragmentation persists across key product lines, creating opportunities for cross-border teaming and modular standards in the European defense market. Missile demand accelerated sharply, with MBDA’s annual intake in 2024 and 2025 rising to levels around triple its pre‑2021 average, supported by layered air‑defense and stand‑off munitions programs. Space is consolidating through the Airbus‑Leonardo‑Thales MoU to combine space activities by 2027, aiming for scale, autonomy, and export competitiveness.[5] These moves signal a broader pivot from platform‑centric portfolios to integrated sensor‑shooter‑network ecosystems that can be iterated quickly.
Partnerships and acquisitions remained active in late 2025 and early 2026. Kongsberg acquired Zone 5 Technologies, adding affordable, mass‑producible missiles to its portfolio and expanding its US presence through a growing pipeline of strike and counter‑UAS solutions in the Europe defense market. Kongsberg also signed multiple contracts in December 2025 across undersea combat systems and coastal defense, highlighting demand for proven maritime effectors and integration expertise. On the land side, Germany’s procurement streamlining in 2026 is set to prioritize interoperable, off‑the‑shelf solutions and to enable faster decision cycles, which may reward suppliers with ready‑to‑field kits in the Europe defense market. These strategic actions reflect a pattern of focusing on scalable product lines backed by predictable funding.
Doctrine and technology are moving together. Germany’s AI‑enabled field systems and the UK’s “Digital Targeting Web” demonstrate how digital backbones, sovereign cloud, and tactical apps will define future combat effectiveness in the Europe defense market. Exercises like Dynamic Front 25 showcased cross‑domain fire coordination and data‑driven targeting, reinforcing requirements for interoperable radios, resilient satcom, and layered ISR. Contractors able to fuse sensors and effectors into robust C2 networks are best positioned to capture share as buyers favor software‑rich systems. Over the forecast horizon, buyers in the Europe defense market are likely to continue favoring suppliers that can deliver at speed and scale, with interoperable architectures.

*Disclaimer: Major Players sorted in no particular order
1. INTRODUCTION
2. RESEARCH METHODOLOGY
3. EXECUTIVE SUMMARY
4. MARKET LANDSCAPE
5. MARKET SIZE AND GROWTH FORECASTS (VALUE)
6. COMPETITIVE LANDSCAPE
7. MARKET OPPORTUNITIES AND FUTURE OUTLOOK
The Europe defense market report includes an analysis of different defense equipment used to maintain the region's military strength.
The Europe defense market is segmented based on armed forces, type, domain, procurement nature, and geography. By armed forces, the market is segmented into the Air Force, the Army, and the Navy. By type, the market is classified into personnel training and protection, C4ISR and electronic warfare, vehicles, weapons and ammunition, unmanned systems, and space and cyber systems. By domain, the market is segmented into land, air, naval, space, and cyber and electromagnetic spectrum. By nature of procurement, the market is divided into indigenous production and foreign procurement. The report also offers the market size and forecasts for 10 countries across the region. For each segment, the market size and forecast are provided in terms of value (USD).
Feasibility Analysis for FBO Services in East Africa
3 Min Read
When decisions matter, industry leaders turn to our analysts. Let’s talk.