
Employee Benefits Market Size and Share
Market Overview
| Study Period | 2021 - 2032 |
|---|---|
| Market Size (2027) | USD 4 Trillion |
| Market Size (2032) | USD 5.20 Trillion |
| Growth Rate (2027 - 2032) | 5.40 % |
| Fastest Growing Market | Asia-Pacific |
| Largest Market | North America |
| Market Concentration | Low |
Major Players *Disclaimer: Major Players sorted in no particular order Image © Mordor Intelligence. Reuse requires attribution under CC BY 4.0. | |
Employee Benefits Market Analysis by Mordor Intelligence
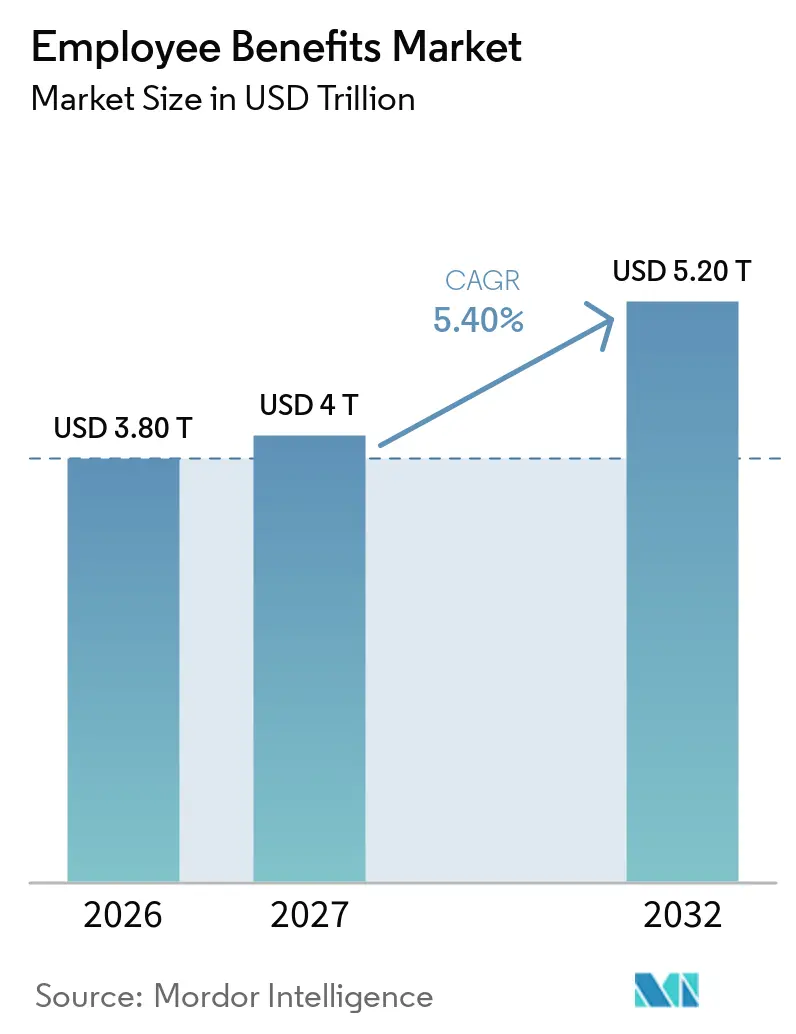
The Employee Benefits Market size was valued at USD 3.80 trillion in 2026 and is estimated to grow from USD 4 trillion in 2027 to reach USD 5.20 trillion by 2032, at a CAGR of 5.40% during the forecast period (2027-2032).
The employee benefits market is expanding as employers treat benefit programs as part of talent retention, workforce health, and operating productivity. Digital administration platforms are replacing disconnected processes and giving employers better access to enrollment and claims information. Medical cost pressure is also prompting employers to redesign plans, compare vendors, and adopt different funding structures. Competition is moving beyond premium placement toward plan customization and employee decision support. These forces create opportunities for insurers, brokers, administrators, and technology providers that can combine advice with practical administration.
Key Report Takeaways
- By benefit type, retirement and pension benefits captured 51.4% of the employee benefits market share in 2025, while life, disability, and other occupational risk benefits are projected to grow at a 7.5% CAGR through 2031.
- By funding vehicle, occupational pension funds and trusts held 47.8% of the employee benefits market share in 2025, while self-insured/ASO plans are forecast to grow at a 6.8% CAGR through 2031.
- By distribution channel, insurance and benefits brokers/consultants captured 55.2% of the employee benefits market share in 2025, while digital and benefits-platform-originated channels are projected to grow at a 10.4% CAGR through 2031.
- By administration model, insurer- or pension-provider administered models held 49.3% of the employee benefits market share in 2025, while third-party administrator/ASO models are forecast to grow at a 6.5% CAGR through 2031.
- By organization size, large enterprises captured 56.4% of the employee benefits market share in 2025, while small enterprises are projected to grow at a 6.3% CAGR through 2031.
- By end-user industry, manufacturing held 19.7% of the employee benefits market share in 2025, while information technology and telecommunications are forecast to grow at a 7.0% CAGR through 2031.
- By geography, North America captured 61.2% of the employee benefits market share in 2025, while Asia-Pacific is projected to grow at a 7.9% CAGR through 2031.
Note: Market numbers in this report are based on Mordor Intelligence's proprietary estimation framework, which combines nine months of actuals with Q4 projections for base year 2026.
Market Trends and Insights
Drivers Impact Analysis of Employee Benefits Market*
| Driver | (~) % Impact on CAGR Forecast | Geographic Relevance | Impact Timeline |
|---|---|---|---|
| Rising use of benefits for talent attraction and retention | +0.8% | Global, concentrated in North America, Western Europe, and Asia-Pacific technology hubs | Short term (≤ 2 years) |
| Rising employer healthcare and benefits costs are driving optimization | +0.6% | North America and Europe, plus the Asia-Pacific markets, with high medical inflation | Short term (≤ 2 years) |
| Digitalization of benefits administration and enrolment | +0.9% | Global, led by North America, India, and Southeast Asia | Medium term (2-4 years) |
| Growing demand for personalized and flexible programs | +0.7% | North America, Western Europe, and core Asia-Pacific markets | Medium term (2-4 years) |
| Greater employer focus on health, mental health, and financial well-being | +0.6% | Global, with European regulatory support and growing emphasis in the Asia-Pacific | Medium term (2-4 years) |
| Expansion of global programs among multinational employers | +0.4% | North America-Europe and Europe-Asia-Pacific corridors | Long term (≥ 4 years) |
| Source: Mordor Intelligence | |||
Rising Use of Employee Benefits as a Talent Attraction and Retention Tool
Benefits are becoming a more visible part of how employers compete for and retain workers. The Society for Human Resource Management reported that 46% of employers in the United States offered paid parental leave in 2026, compared with 39% in 2025[1]. The same pattern is evident in Asia-Pacific, where 61% of employers planned to reallocate benefit spending to obtain greater value over the next 3 years. Employers are therefore extending nonstatutory support where statutory programs do not meet employee expectations. Childcare, transportation, and housing support have become more relevant in manufacturing workforces with persistent hiring needs. This broadens the addressable scope of the employee benefits market beyond health coverage and retirement plans.
Rising Employer Healthcare and Benefits Costs Driving Demand for Benefits Optimization
Higher benefit costs are making plan design and vendor management more important to employers. The Business Group on Health reported a median 9% employer health care cost trend for 2026, which declined to 7.6% when employers made plan design changes. Actual costs exceeded forecasts for the second consecutive year, which has increased pressure to evaluate both insured and self-funded arrangements. The same survey found that 67% of multinational employers said United States health care cost pressure affected benefits offered worldwide[2]. This links domestic cost management with cross-border benefit planning for global employers. The employee benefits market benefits from demand for cost benchmarking, funding analysis, and administration tools that support more informed plan decisions.
Digitalization of Employee Benefits Administration and Enrollment
Digital administration is becoming a core requirement in the employee benefits market as employers seek clearer information and easier employee access. A Mercer survey found that 89% of employers had centralized benefits or planned to do so within 1 year, and 50% used artificial intelligence in benefits technology. The survey also found that 24% of United States employers used artificial intelligence in benefits communications, including 17% using artificial intelligence-enabled question-and-answer tools. Digital systems can connect human resources workflows, carrier information, payroll, enrollment, and reporting in one operating environment. Employers can use these systems to reduce administrative friction while preserving the advisory role of brokers. Privacy rules, including the General Data Protection Regulation in Europe and state-level rules in the United States, also encourage platforms to build stronger controls into enrollment workflows.
Growing Demand for Personalized and Flexible Benefits Programs
Employee needs differ by age, family status, income, location, and career stage, making uniform plans less suitable for many workforces. Businessolver research found that 85% of employees faced benefits literacy challenges, while 79% remained confident in their final decisions. This gap supports the use of guided enrollment, recommendation tools, and year-round communication. In France, 50% of companies cited talent competition as the leading driver of benefits strategy, while more than 60% expected further cost escalation over 3 years. Japanese research also identified greater employee interest in retirement accumulation and well-being support. Flexible allowances, lifestyle accounts, modular health options, and portable programs are becoming more central to benefit program design.
Restraints Impact Analysis of Employee Benefits Market*
| Restraint | (~) % Impact on CAGR Forecast | Geographic Relevance | Impact Timeline |
|---|---|---|---|
| Medical inflation and rising healthcare benefit costs | -0.7% | Global, most acute in Asia-Pacific and North America | Short term (≤ 2 years) |
| Complexity of integrating platforms with human resources, payroll, and insurance systems | -0.5% | Global, especially fragmented mid-market and small and medium-sized employer segments | Medium term (2-4 years) |
| Regulatory and data privacy complexity in cross-border management | -0.3% | Europe and multinational corridors across the Asia-Pacific and Middle East, and Africa | Long term (≥ 4 years) |
| Difficulty demonstrating financial return on wellbeing and ancillary benefits | -0.3% | Global, concentrated in mature core-benefit programs | Medium term (2-4 years) |
| Source: Mordor Intelligence | |||
Medical Inflation and Rising Healthcare Benefit Costs
Medical cost inflation limits the affordability of broad benefit packages for both employers and employees. Industry estimates projected an 11.3% rise in Asia-Pacific employer medical plan costs in 2026, including 16.9% in Indonesia, 16.0% in Malaysia, and 14.8% in Thailand[3]. Pharmacy represented 24% of employer health care spending in 2024, and pharmacy costs were expected to rise 11-12% through 2026. Specialty medicines, including GLP-1 therapies, have added a separate source of budget pressure. Rising per-employee costs can lead to plan redesign, employee cost sharing, and vendor renegotiation rather than broader coverage. Large multinational employers also face the challenge of managing benefit costs consistently across countries.
Complexity of Integrating Benefits Platforms With Human Resources, Payroll, and Insurance Systems
Integration remains a practical constraint on benefits modernization. Many employers operate separate human resources information systems, payroll platforms, and insurer portals that were not designed to exchange information in real time. This can create repeated data entry, slower eligibility updates, and inconsistent reporting across a workforce. Small and medium-sized employers often lack the internal technology capability required to configure and manage application programming interface connections. Specialty Program Group acquired HCM Unlocked in September 2026 to add payroll, leave, human resources, benefits administration, and compliance capabilities to its services[4]. This complexity supports demand for brokers and third-party administrators that offer managed implementation alongside advisory services.
*Our forecasts treat driver/restraint impacts as directional, not additive. The impact forecasts reflect baseline growth, mix effects, and variable interactions.
Employee Benefits Market Segment Analysis
By Benefit Type:
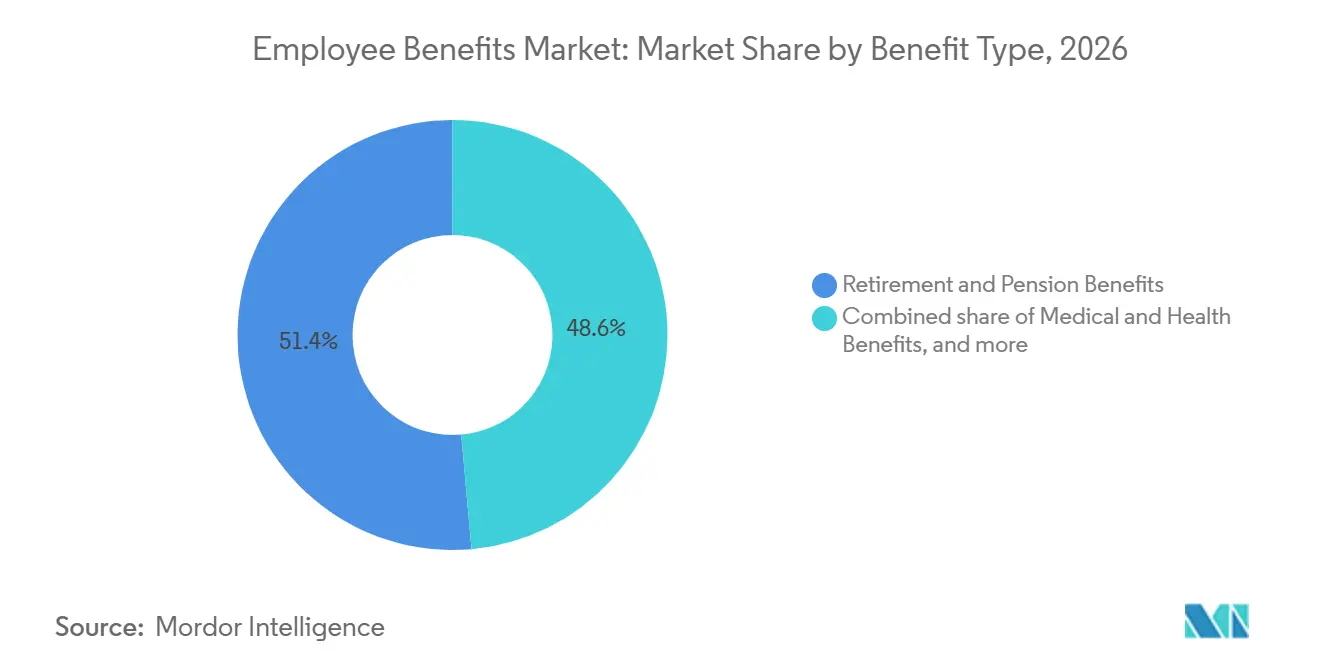
Retirement Anchors Scale While Risk Benefits Grow FasterRetirement and pension benefits captured 51.4% of the employee benefits market share in 2026. Their position reflects defined contribution plans in North America and Northern Europe, along with mandatory superannuation structures in Australia and New Zealand. Organization for Economic Co-operation and Development retirement assets grew 10% in 2024 to USD 63.1 trillion, supported by equity markets, wage-linked contributions, and policy mandates. Australia’s employer superannuation contribution rate reached 11.5% in 2024 and was scheduled to increase to 12% in July 2025. These policies help keep retirement plans central to the employee benefits market. They also maintain long-term demand for pension administration, investment support, and compliance services.
Life, disability, and other occupational risk benefits are forecast to grow at a 7.5% CAGR through 2032. Aging workforces and more focused actuarial management of disability claims support this growth. Milliman reported that combined long-term disability, short-term disability, and paid family and medical leave in-force premiums reached USD 19.9 billion in 2024. The report recorded 4.2% long-term disability and 5.2% short-term disability growth among the same companies. Medical and health benefits remain the second-largest benefit type and face the strongest cost pressure. The shift from fully insured plans toward self-insured designs, narrow networks, and pharmacy carve-outs makes administrative capability more important than simple premium aggregation.
By Funding Vehicle:
Occupational Trusts Maintain a Large Base While ASO Plans ExpandOccupational pension funds and trusts held 47.8% of the employee benefits market size for funding vehicles in 2026. Their position is supported by regulatory treatment and by trust structures that separate benefit assets from corporate balance sheets. Pension fund contributions increased in most Organization for Economic Co-operation and Development jurisdictions during 2024. Real wage growth and broader mandatory participation supported these inflows. These arrangements continue to provide a stable funding base for the employee benefits market. They also reinforce the role of trustees, administrators, and investment providers in long-duration benefit programs.
Self-insured/ASO plans are projected to grow at a 6.8% CAGR through 2032. The United States Department of Labor counted nearly 50,700 self-insured plans covering nearly 39 million participants in 2026, and small self-insured plans increased more than 13-fold since 2014. Level-funded designs are extending self-funding to employers with 25-250 employees. Fully insured group contracts still serve many employers with fewer than 100 employees and employers in markets where self-insurance is constrained. Brokers increasingly need to advise across fully insured, level-funded, and ASO structures as clients grow and change their plan requirements.
By Distribution Channel:
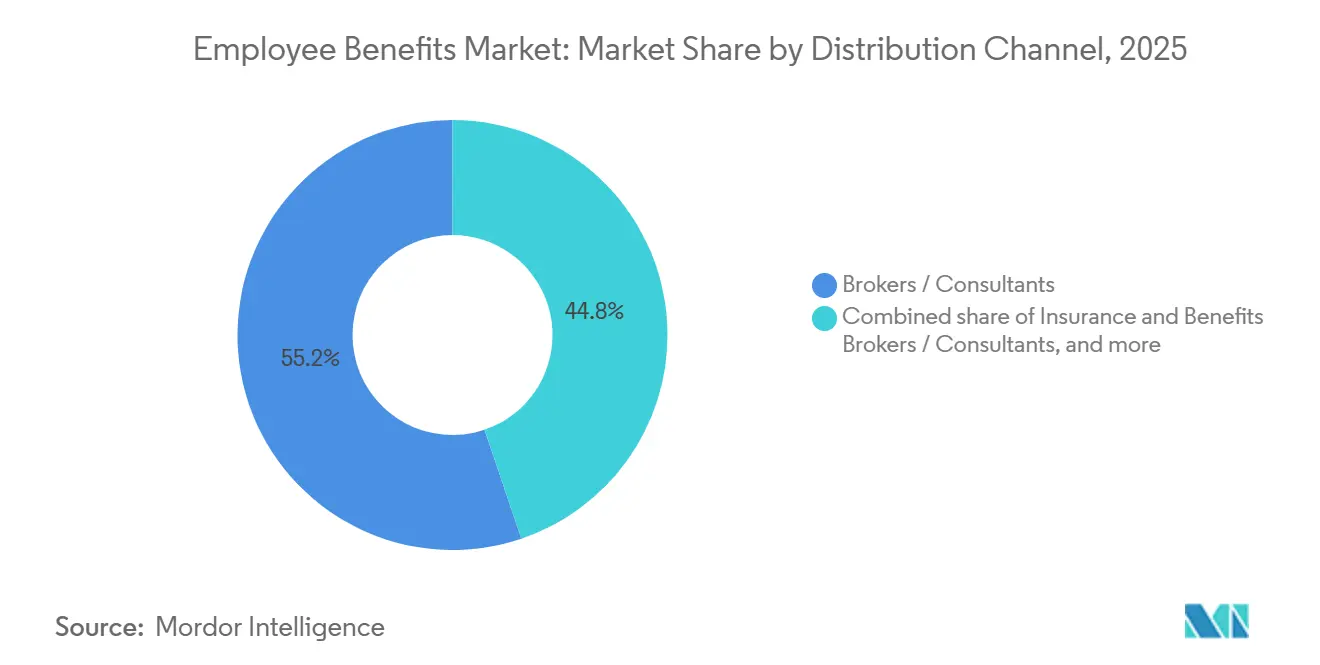
Brokers Retain Scale While Digital Channels Set the PaceInsurance and benefits brokers/consultants captured 55.2% of the share of the employee benefits market within distribution in 2026. Their role rests on regulatory knowledge, carrier negotiation, and employer-specific plan design. Broker and agent compensation from health and welfare benefit sales reached USD 3.4 billion in 2025, including USD 2.5 billion in commissions and USD 845 million in fees. Brokers continue to be important where employers need help comparing complex financing and coverage options. They are also adding technology capabilities to protect client relationships. Alliant Insurance Services’ agreement to acquire Nava Benefits in 2026 illustrates this strategy of combining advisory scale with an artificial intelligence-native benefits platform.
Digital and benefits-platform-originated channels are projected to grow at a 10.4% CAGR through 2032. Employers are adopting mobile enrollment, real-time analytics, and guided decision support to simplify employee choices. Workday launched Workday Total Benefits in September 2026, bringing health, wealth, and well-being programs into one platform with an artificial intelligence self-service agent. Embedded distribution through payroll and human capital management workflows may also reduce enrollment costs for smaller employers. Tied, bancassurance, affinity, and embedded channels have slower growth, but they can reach employers through existing operational systems. United States disclosure requirements add an incentive to use platforms that record enrollment decisions and benefit information consistently.
By Administration Model:
Insurer-Led Models Hold Share While TPA and ASO Models ExpandInsurer- or pension-provider-administered models held 49.3% of the share of the employee benefits market within administration in 2026. This reflects the historic link between underwriting and administration in fully insured plans. Employers that move toward self-insurance often seek more detailed claims information, plan customization, and vendor neutrality. Health Affairs research found that insurers administered nearly four times as many ASO enrollees as fully insured enrollees in 2022. The three largest ASO contractors served more than 70 million enrollees.
Third-party administrator/ASO models are projected to grow at a 6.5% CAGR through 2032. Employers are using these models to gain access to claims information and more control over vendor decisions. Empower acquired Milliman’s retirement administration business in September 2026 to extend its defined benefit, defined contribution, and health and welfare administration capabilities. Employer-operated in-house administration remains feasible mainly for large global employers with substantial human resources technology resources. Microsoft’s MyBenefits Hub served more than 37,000 employees in 13 countries and processed more than 1 million information points annually. The case shows the scale and platform investment needed to sustain global in-house administration.
By Organization Size:
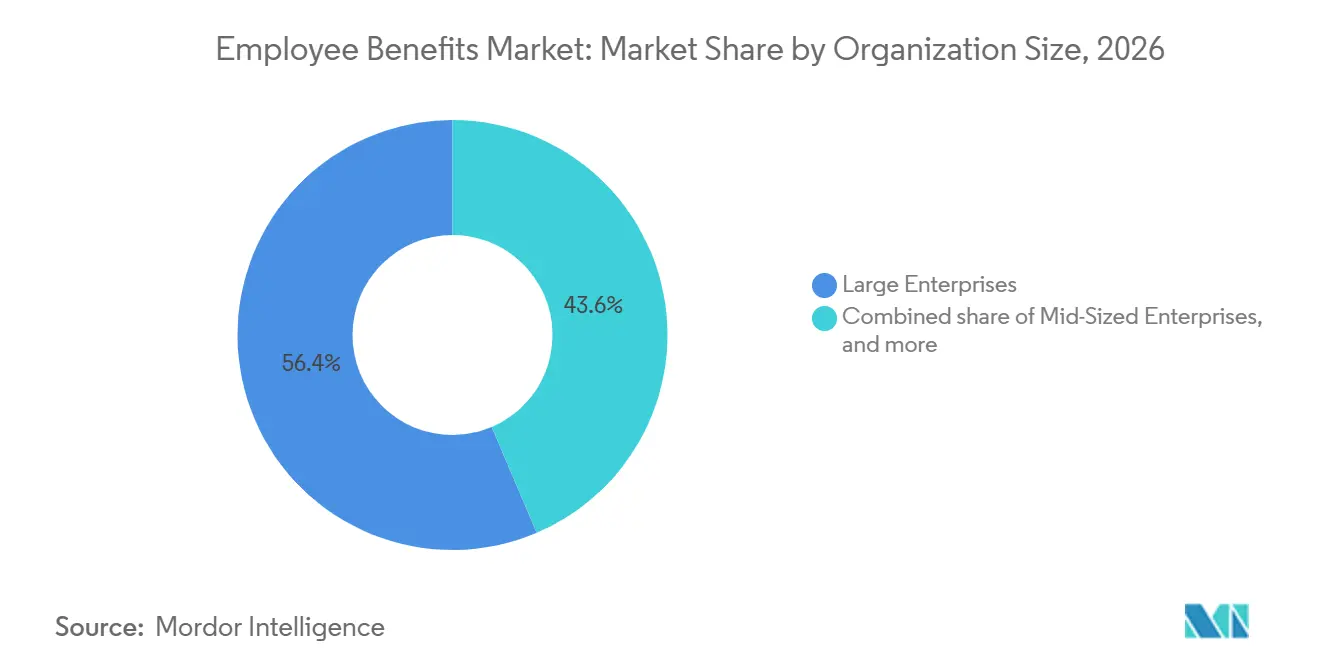
Large Enterprises Lead While Small Enterprises Gain AccessLarge enterprises captured 56.4% of the share of the employee benefits market in 2026. Their scale supports premium negotiation, self-insurance, and dedicated human resources systems for plan management. Larger employers benefit from pooled risk, carrier discounts, and multi-year contracting. These advantages support broader plan choice and more customized administration. The employee benefits market, therefore, retains a large enterprise base even as technology becomes easier to access. Large employers also remain an important source of demand for cross-border benefit coordination.
Small enterprises are forecast to grow at a 6.3% CAGR through 2032. The Urban Institute found that workers at firms with fewer than 50 employees had lower access to health, retirement, life, disability, and financial benefits than workers at larger firms. The gap represents a substantial unmet need for simpler plans and lower-cost administration. SECURE 2.0 provisions with phased implementation through 2025 and 2026 improved 401(k) accessibility through expanded tax credits. TriNet agreed to acquire Cocoon in April 2026 to strengthen leave management for small and medium-sized businesses. Automated compliance, connected carrier access, and guided enrollment can make benefit adoption more feasible for these employers.
By End-User Industry:
Manufacturing Provides Largest Share While Technology Leads GrowthManufacturing held 19.7% of the employee benefits market size by end-user industry in 2026. Its large formal workforce, occupational risk exposure, and established retirement arrangements support this position. In 2025, 95% of manufacturing employees were eligible for employer-sponsored health insurance. Total employer compensation averaged USD 46.89 per hour in the second quarter of 2026, and benefits represented 30% of labor costs. Manufacturing employers are also using transportation, childcare, and housing support to improve retention. In 2026, 57% of manufacturing respondents used fully insured coverage, down from 61% in 2025, while 29% were self-insured.
Information technology and telecommunications are projected to grow at a 7.0% CAGR through 2032. Global talent mobility and competition for specialized skills support demand for portable and personalized coverage. These employers are important users of artificial intelligence-enabled enrollment, benefits wallets, and global administration tools. Their needs align with rapid growth in risk benefits, digital distribution, and TPA/ASO administration. Banking, financial services, and insurance, healthcare and life sciences, and professional and business services also represent substantial demand because they have formal employment structures and established group benefit practices. Government and public sector programs provide stable volume through defined benefit obligations and statutory health coverage mandates in many countries.
Geography Analysis
North America Employee Benefits Market
North America captured 61.2% of the share of the employee benefits market in 2026. The United States employer-sponsored system remains a major channel for health insurance and retirement savings among working-age adults. Employer-sponsored artificial intelligence tool subscriptions doubled from 16% in 2025 to 33% in 2026, according to the Society for Human Resource Management. Employers projected a 9% median cost trend in 2026, even after plan design changes, while pharmacy costs were expected to rise 11-12%. Canada adds demand for supplemental group life and disability benefits. Mexico is increasing its mandatory individual-account contribution rate and is scheduled to reach 15% of salary by 2030.
APAC Employee Benefits Market
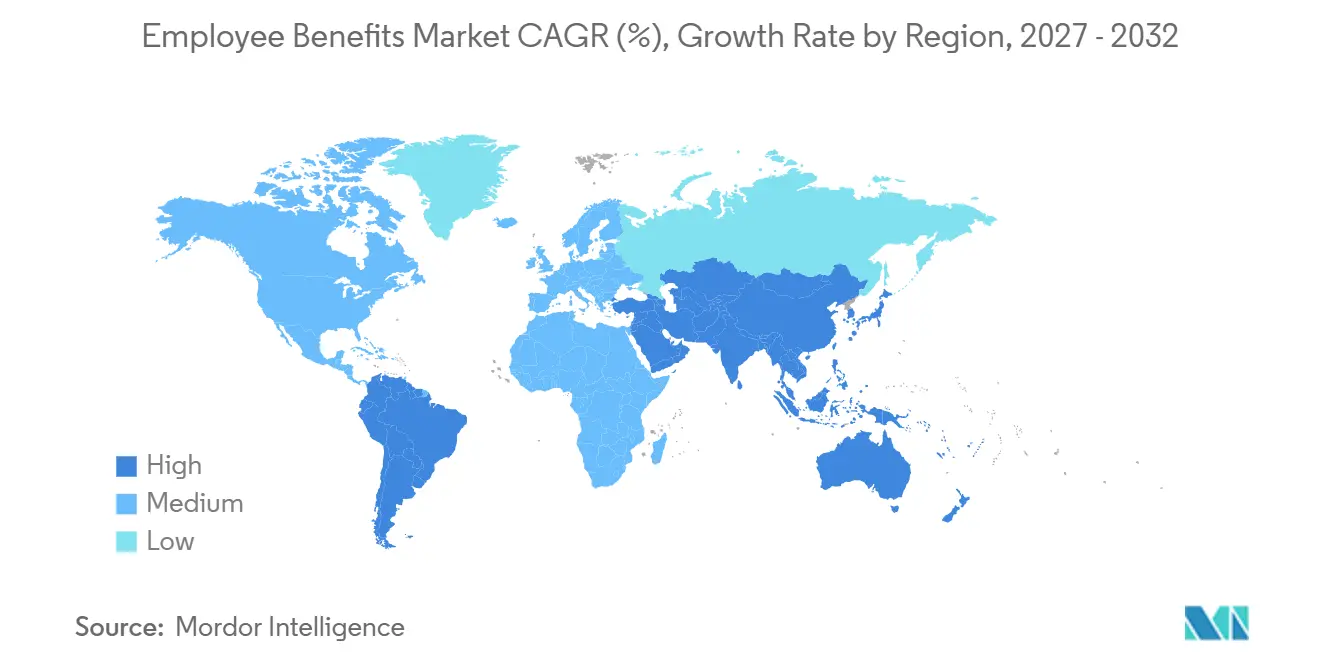
Asia-Pacific is projected to grow at a 7.9% CAGR through 2032. Expanding formal employment, employer investment in group coverage, and pension reform support the regional employee benefits market. Medical plan costs in Asia-Pacific were projected to increase 11.3% in 2026, with Indonesia at 16.9%, Malaysia at 16.0%, and Thailand at 14.8%. In the Asia-Pacific region, 51% of employers sought better vendor value for health care benefits, and 61% planned to reallocate spending over 3 years. China, India, South Korea, and Southeast Asia form the main growth area. Japan’s discretionary nonstatutory benefit spending rose 4.8% in 2025 to JPY 17.419 million (USD 0.1 million) per company, marking a third consecutive year of growth above 4% after the 2021 contraction.
EMEA and South America Employee Benefits Market
Europe has a significant position in the employee benefits market because statutory social insurance operates alongside employer-funded health, life, disability, and retirement plans. French companies reinforced retirement rights in 2026 through greater use of mandatory supplemental retirement plans. Germany implemented its Pay Transparency Law in June 2026, creating requirements to disclose pay and benefit criteria for comparable roles. The Netherlands scored 85.4, and Denmark scored 82.3 in the 2025 Global Pension Index, reflecting mature pension systems. South America, led by Brazil and Argentina, faces inflation and macroeconomic conditions that complicate multi-year benefit planning. The Middle East and Africa are still developing, while pension reforms in Saudi Arabia and South Africa support formal benefit coverage.
Competitive Landscape
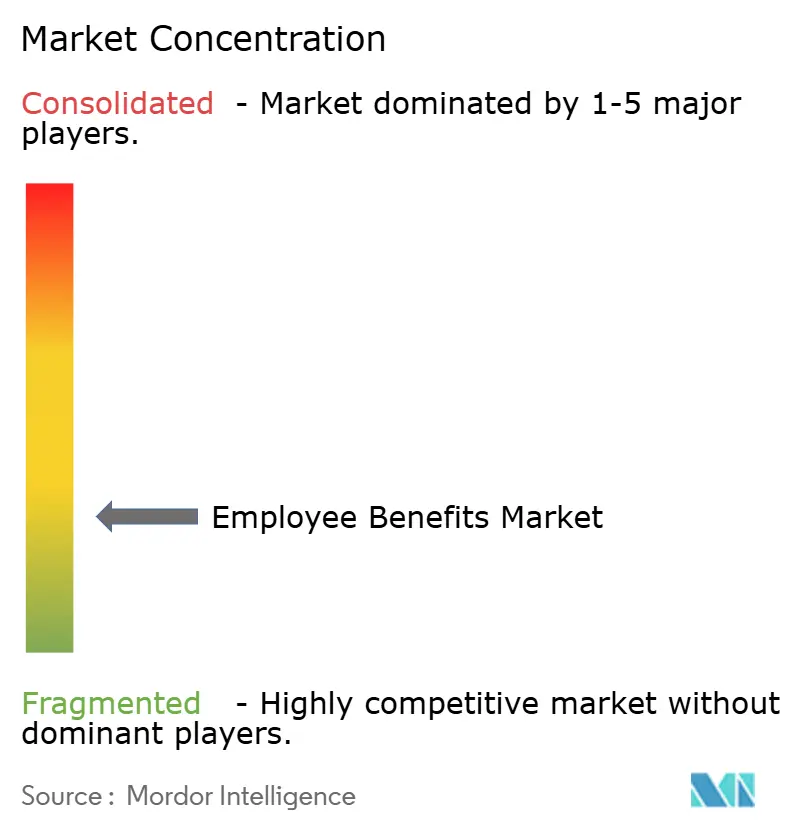
The employee benefits market is fragmented. Aon, WTW, Mercer, and Arthur J. Gallagher hold important positions in advisory and brokerage. ADP, Workday, and Fidelity Investments are major providers of large-enterprise human resources and retirement administration. Established firms are acquiring digital capabilities to retain clients who seek more integrated administration. Empower completed its acquisition of Milliman’s retirement administration business in September 2026. Principal Financial Group completed its acquisition of Beam Benefits in September 2026, adding digital-first small and medium-sized business capabilities serving more than 25,000 small businesses.
Digital providers, including Nayya, bswift, Businessolver, and Benifex, compete through guided enrollment, personalization, and claims-related information. Nayya acquired Northstar in September 2025 and introduced an artificial intelligence-driven health and wealth benefits solution. This reflects a broader move to combine health navigation with financial well-being support. White-space opportunities remain in benefits infrastructure for small and medium-sized employers, local administration in emerging markets, and more connected employee decision tools. Generali Group announced a partnership with Swiss Life Global Solutions in 2026 to create a combined global employee benefits network for multinational employers. The partnership shows how insurers are adjusting multi-country distribution models for global mandates.
Competitive strategies in the employee benefits market increasingly combine advisory services, administration, and employee-facing technology. Workday’s September 2026 Total Benefits launch placed health, wealth, and well-being functions in one employer dashboard. HUB International expanded its Global Benefits practice in May 2026 and introduced its GlobalView platform for centralized global benefits data, reporting, and governance. These moves show that providers are competing on the ability to coordinate programs across employers, countries, and benefit categories.
Employee Benefits Industry Leaders
-
Mercer LLC
-
Aon plc
-
WTW
-
Alight Solutions
-
Arthur J. Gallagher & Co.
- *Disclaimer: Major Players sorted in no particular order
Employee Benefits Market Companies Covered in this Report
- ADP
- Alight Solutions
- Aon plc
- Arthur J. Gallagher & Co.
- Benifex
- Benefitfocus
- Benepass
- bswift
- Businessolver
- Darwinbox
- Edenred SE
- Employment Hero
- Fidelity Investments
- Mercer
- Nayya
- PlanSource
- Sodexo S.A.
- Workday
- WTW
- Paychex
Recent Industry Developments in Employee Benefits Market
- September 2026: Workday launched Workday Total Benefits, an AI-native platform unifying health, wealth, and wellbeing into a single employer dashboard with real-time analytics and an AI Self-Service Agent, positioning Workday as a full-stack benefits administration competitor spanning HR, payroll, and carrier ecosystems.
- September 2026: Empower completed the acquisition of Milliman's retirement administration business, announced in June 2026, expanding its defined benefit, defined contribution, and health and welfare administration capabilities, reinforcing its position as one of North America's largest integrated retirement platform operators.
- September 2026: Vitality and HealthEquity announced a strategic partnership integrating behavioral health incentive programs with consumer-directed health spending accounts (HSAs), connecting health behavior data with healthcare financing for nearly 18 million HealthEquity account holders.
- September 2026: Principal Financial Group completed the acquisition of Beam Benefits (effective September 1, 2026), adding digital-first SME benefits capabilities covering more than 25,000 small businesses to Principal's protection and retirement portfolio.
Global Employee Benefits Market Report Scope
Segmentation Overview
| Medical and Health Benefits |
| Retirement and Pension Benefits |
| Life, Disability and Other Occupational Risk Benefits |
| Fully Insured Group Contracts |
| Self-Insured / ASO Plans |
| Occupational Pension Fund or Trust |
| Insurance and Benefits Brokers / Consultants |
| Direct to Employer |
| Tied / Bancassurance / Affinity and Embedded |
| Digital / Benefits-Platform Originated |
| Insurer- or Pension-Provider Administered |
| Third-Party Administrator / ASO |
| Employer- or Sponsor-Operated (In-House) |
| Large Enterprises |
| Mid-Sized Enterprises |
| Small Enterprises |
| Banking, Financial Services and Insurance |
| Information Technology and Telecommunications |
| Healthcare and Life Sciences |
| Manufacturing |
| Retail and Consumer Goods |
| Professional and Business Services |
| Education |
| Government and Public Sector |
| Energy, Utilities and Natural Resources |
| Transportation, Logistics and Travel |
| Construction and Real Estate |
| Other Industries |
| North America | United States |
| Canada | |
| Mexico | |
| South America | Brazil |
| Argentina | |
| Rest of South America | |
| Europe | United Kingdom |
| Germany | |
| France | |
| Italy | |
| Spain | |
| Rest of Europe | |
| Asia-Pacific | China |
| Japan | |
| India | |
| South Korea | |
| Australia | |
| Indonesia | |
| Thailand | |
| Malaysia | |
| Singapore | |
| Vietnam | |
| Rest of Asia-Pacific | |
| Middle East and Africa | Saudi Arabia |
| United Arab Emirates | |
| Turkey | |
| South Africa | |
| Egypt | |
| Rest of Middle East and Africa |
| By Benefit Type | Medical and Health Benefits | |
| Retirement and Pension Benefits | ||
| Life, Disability and Other Occupational Risk Benefits | ||
| By Funding Vehicle | Fully Insured Group Contracts | |
| Self-Insured / ASO Plans | ||
| Occupational Pension Fund or Trust | ||
| By Distribution Channel | Insurance and Benefits Brokers / Consultants | |
| Direct to Employer | ||
| Tied / Bancassurance / Affinity and Embedded | ||
| Digital / Benefits-Platform Originated | ||
| By Administration Model | Insurer- or Pension-Provider Administered | |
| Third-Party Administrator / ASO | ||
| Employer- or Sponsor-Operated (In-House) | ||
| By Organization Size | Large Enterprises | |
| Mid-Sized Enterprises | ||
| Small Enterprises | ||
| By End-User Industry | Banking, Financial Services and Insurance | |
| Information Technology and Telecommunications | ||
| Healthcare and Life Sciences | ||
| Manufacturing | ||
| Retail and Consumer Goods | ||
| Professional and Business Services | ||
| Education | ||
| Government and Public Sector | ||
| Energy, Utilities and Natural Resources | ||
| Transportation, Logistics and Travel | ||
| Construction and Real Estate | ||
| Other Industries | ||
| By Geography | North America | United States |
| Canada | ||
| Mexico | ||
| South America | Brazil | |
| Argentina | ||
| Rest of South America | ||
| Europe | United Kingdom | |
| Germany | ||
| France | ||
| Italy | ||
| Spain | ||
| Rest of Europe | ||
| Asia-Pacific | China | |
| Japan | ||
| India | ||
| South Korea | ||
| Australia | ||
| Indonesia | ||
| Thailand | ||
| Malaysia | ||
| Singapore | ||
| Vietnam | ||
| Rest of Asia-Pacific | ||
| Middle East and Africa | Saudi Arabia | |
| United Arab Emirates | ||
| Turkey | ||
| South Africa | ||
| Egypt | ||
| Rest of Middle East and Africa | ||
Key Questions Answered in the Report
What is the projected size of the employee benefits market by 2032?
The employee benefits market is projected to reach USD 5.2 trillion by 2032, rising from USD 4.0 trillion in 2027 at a 5.4% CAGR.
Which benefit category has the largest share?
Retirement and Pension Benefits held 51.4% of the share of the employee benefits market in 2026.
Which distribution channel is growing fastest?
Digital and Benefits-Platform originated channels are projected to grow at a 10.4% CAGR through 2032.
Why are employers moving toward self-insured plans?
Employers seek greater cost control, plan design flexibility, and access to claims data, supporting a 6.8% CAGR for Self-Insured/ASO Plans.
Which region is expected to grow fastest?
Asia-Pacific is expected to grow at a 7.9% CAGR through 2032, supported by formal employment growth and deeper benefit coverage.
How are small employers affecting employee benefits adoption?
Small Enterprises are projected to grow at a 6.3% CAGR as connected platforms and regulatory support make plans more accessible.