Electronic Shelf Labels Market Size and Share
Market Overview
| Study Period | 2019 - 2030 |
|---|---|
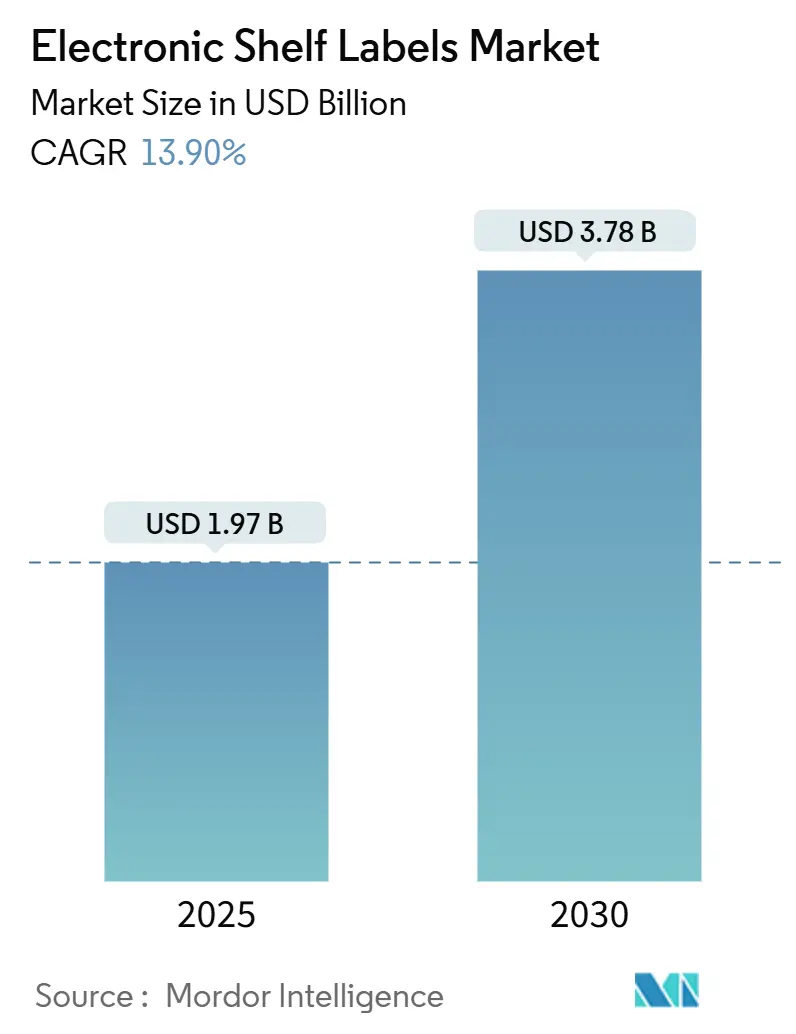
| Market Size (2025) | USD 1.97 Billion |
| Market Size (2030) | USD 3.78 Billion |
| Growth Rate (2025 - 2030) | 13.90% CAGR |
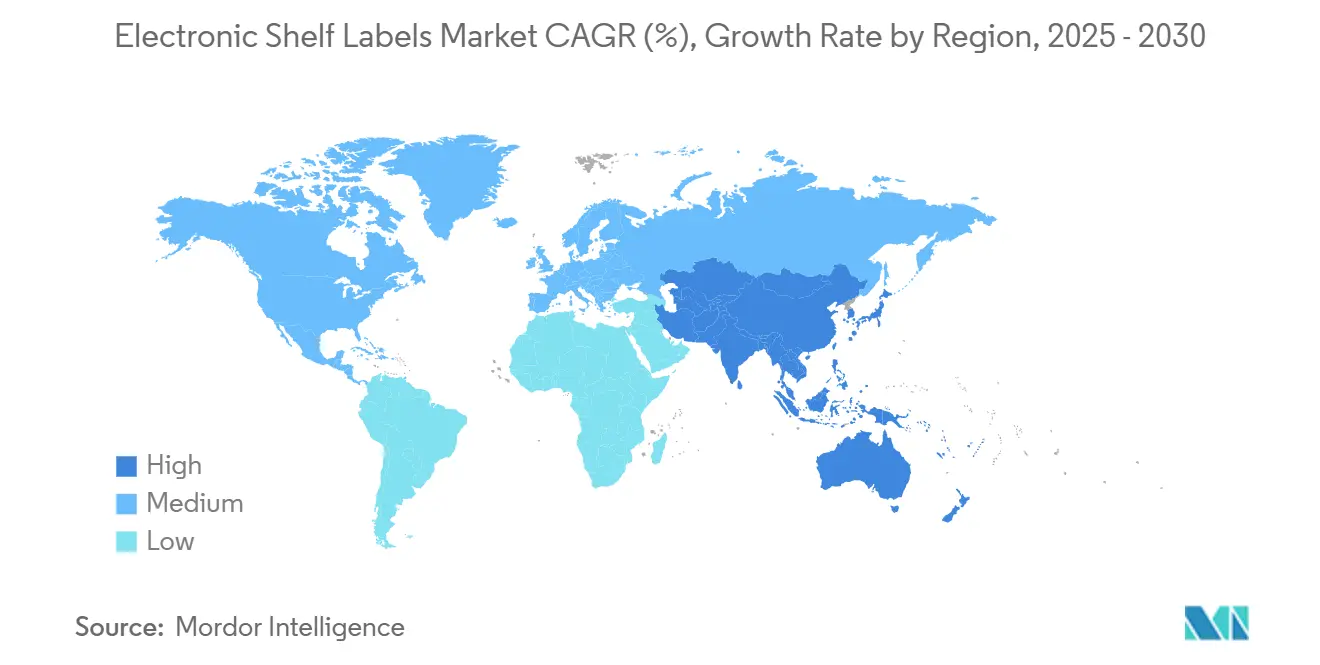
| Fastest Growing Market | Asia Pacific |
| Largest Market | Asia Pacific |
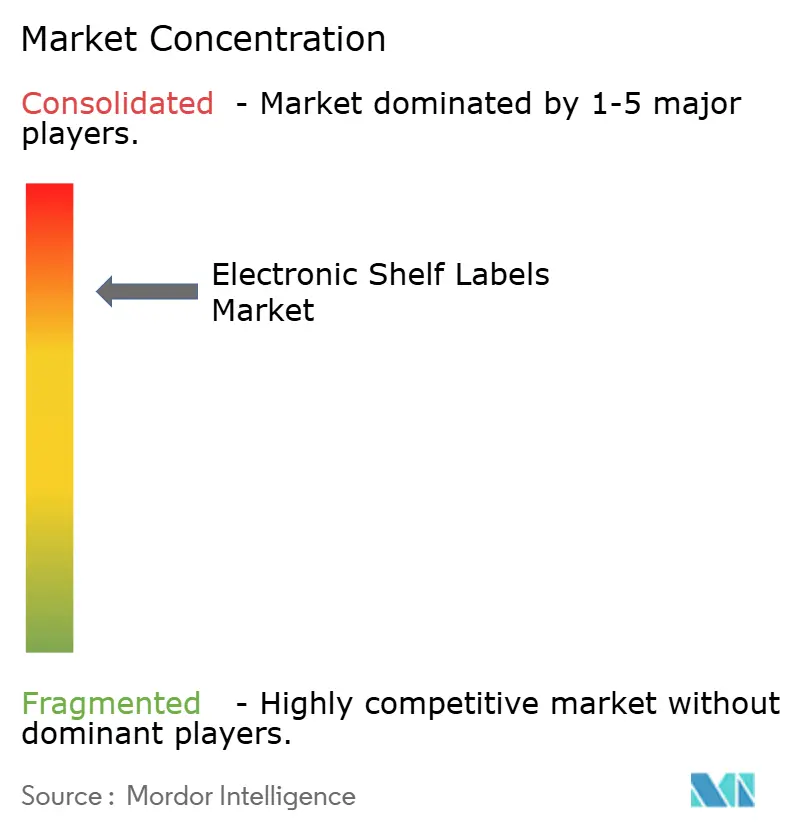
| Market Concentration | High |
Major Players *Disclaimer: Major Players sorted in no particular order Image © Mordor Intelligence. Reuse requires attribution under CC BY 4.0. | |
Electronic Shelf Labels Market Analysis by Mordor Intelligence
The electronic shelf labels market was valued at USD 1.97 billion in 2025 and is forecast to expand to USD 3.78 billion by 2030, registering a 13.9% CAGR. Mandatory disclosures such as the EU Digital Product Passport, sustained omnichannel price competition, and lower semiconductor lead times encourage retailers to move away from paper labels. Large-scale rollouts by tier-one chains signal mainstream acceptance, while AI-ready platforms and battery innovations lengthen product life and reduce maintenance visits. Asia Pacific regulations, particularly Japan’s goal for full convenience-store automation by 2025, further accelerate adoption. Meanwhile, rising labor costs in North America strengthen the financial case for label automation across thousands of SKUs. Collectively, these forces shape a market that is no longer driven solely by cost savings but by compliance, data transparency, and customer experience.
Key Report Takeaways
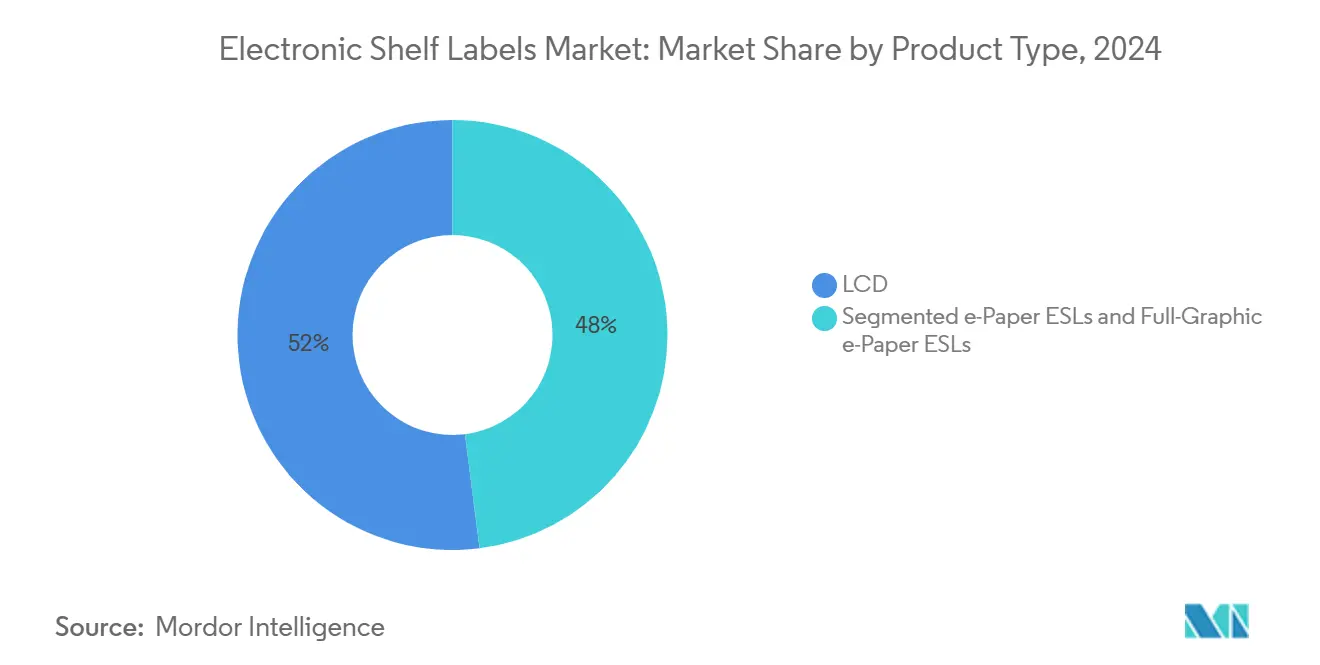
- By product type, LCD units held 52% of the electronic shelf labels market share in 2024, whereas full-graphic e-Paper units are expected to grow at a 20.5% CAGR to 2030.
- By communication technology, radio frequency systems commanded a 61% revenue share in 2024, while near-field communication solutions are projected to post the fastest 16.21% CAGR through 2030.
- By component, displays accounted for 45% of total system costs in 2024; batteries represent the fastest-rising cost line with a 17.1% CAGR forecast.
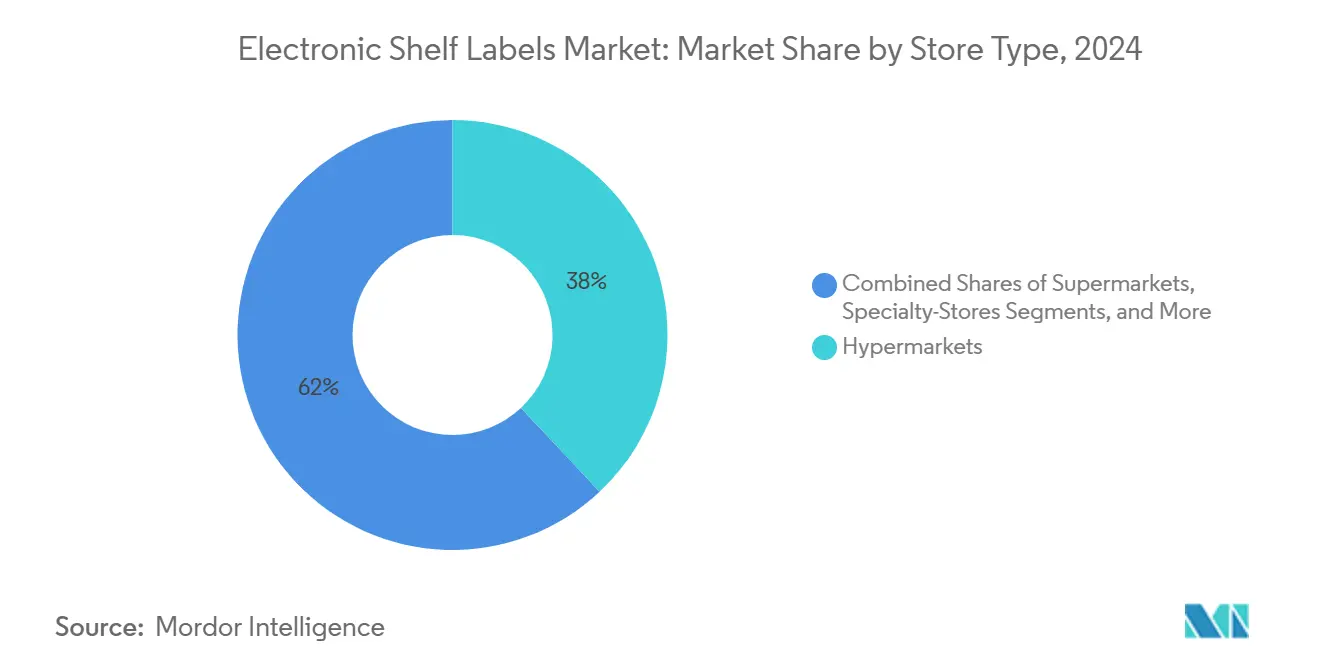
- By store type, hypermarkets deployed 38% of the installed labels in 2024, whereas specialty stores are set to record the highest 14.51% CAGR from 2024 to 2030.
- By geography, the Asia Pacific led the electronic shelf labels market with a 32.2% share in 2024 and is projected to expand at a 15.23% CAGR through 2030.
Global Electronic Shelf Labels Market Trends and Insights
Drivers Impact Analysis*
| Driver | (~) % Impact on CAGR Forecast | Geographic Relevance | Impact Timeline |
|---|---|---|---|
| Retail automation and omnichannel pricing pressure | +4.2% | North America and Europe with global spillover | Medium term (2–4 years) |
| Cost-efficient alternative to paper labels | +3.1% | Strongest in Asia Pacific and emerging markets | Short term (≤2 years) |
| Contactless payments accelerating ESL adoption | +2.8% | North America and Europe expanding into Asia Pacific | Medium term (2–4 years) |
| AI-driven computer-vision shrinkage analytics integration | +1.9% | Premium retail chains in North America and Europe | Long term (≥4 years) |
| EU Digital Product Passport mandates | +1.6% | Europe with global compliance effects | Medium term (2–4 years) |
| Scope-3 carbon reporting requirements | +1.2% | Global corporate retail groups | Long term (≥4 years) |
| Source: Mordor Intelligence | |||
Retail Automation and Omnichannel Pricing Pressure
Omnichannel retailing requires identical prices online and in store, a task that manual tickets cannot deliver at scale. Retailers therefore integrate electronic shelf labels market platforms with dynamic pricing engines that analyse inventory, competitor prices, and demand signals every few minutes. VusionGroup’s 2024 rollout with The Fresh Market illustrates how cloud orchestration links in-store displays with e-commerce engines, eliminating mismatches that erode trust. Labour costs rising in hypermarkets turn daily ticket swaps into a material expense, and automated labels help chains redeploy staff to value-adding roles. Promotional agility improves as a nationwide campaign can be launched in seconds, supporting same-day marketing tactics that paper systems cannot execute.
Cost-Efficient Alternative to Paper Labels
At deployments above 10,000 labels, the electronic shelf labels market reaches cost parity with legacy paper systems because it eliminates printing, transportation, and labor. Semiconductor prices dropped by 15% in 2024, and battery life now extends to 7-10 years, which lowers total ownership costs and smooths cash flow planning. Accuracy gains also reduce fines and customer disputes that arise from mismatched shelf and till prices. Paper and ink volatility exposes retailers to budgeting risk, whereas an amortised electronic solution delivers predictable depreciation. These financial levers collectively widen the customer base from early adopters to value-driven mid-tier chains.
Contactless Payments Accelerating ESL Adoption
NFC-enabled tags turn the shelf into a transactional endpoint. Shoppers tap their phones, settle the payment, and trigger pick-up or delivery workflows without queuing, an experience prized in high-traffic convenience stores. Qualcomm’s handset-level RAIN RFID roadmap suggests broader consumer hardware support, while Japan’s 2025 automation mandate provides regulatory impetus for frictionless checkout. Retailers gain behaviour data on every tap, refining planograms and promotions based not only on sales but also on in-aisle engagement. These insights transform the label from static signage into a data collection node inside the wider electronic shelf labels market network.
AI-Driven Computer-Vision Shrinkage Analytics Integration
Computer-vision cameras connected to ESL gateways monitor shelf conditions in real time. When price tags show an item in stock but the camera detects an empty slot, the system triggers replenishment and flags potential shrink events. arXiv research shows that RFID-vision fusion can cut shrinkage by up to 30% through rapid anomaly detection. Machine-learning models also analyze dwell time in front of each SKU, informing pricing engines that adjust prices according to demand elasticity. These added layers of value shift buyer discussions from capex to revenue protection, sustaining momentum in the electronic shelf labels market beyond basic label replacement.
Restraints Impact Analysis*
| Restraint | (~) % Impact on CAGR Forecast | Geographic Relevance | Impact Timeline |
|---|---|---|---|
| High upfront deployment costs | −2.8% | Global small and medium retailers | Short term (≤2 years) |
| Interoperability and standards fragmentation | −1.9% | Multinational chains facing mixed standards | Medium term (2–4 years) |
| Urban 2.4 GHz RF spectrum congestion risk | −1.2% | Dense retail districts in developed economies | Medium term (2–4 years) |
| Battery-disposal compliance under EU Battery Directive 2027 | −0.8% | Europe with global knock-on effects | Long term (≥4 years) |
| Source: Mordor Intelligence | |||
High Upfront Deployment Costs
Hardware averages USD 15–25 per tag, and supporting gateways can push a mid-sized rollout above USD 100 000, a hurdle for independents with tight credit lines. Integration with point-of-sale software and staff training often doubles that figure, extending payback beyond two budget cycles. SME adoption, therefore, lags large formats despite clear operational upside. Stabilising chip supply in 2025 should soften price swings, but retailers still prefer phased pilots financed through leasing or outcome-based contracts.
Interoperability and Standards Fragmentation
The electronic shelf labels market still lacks a universal communication stack. RF is dominant, NFC is rising, and some vendors support infrared or visible light communication. Mixed estates require chains to maintain multiple back-end systems, increasing lifetime service costs and locking them into proprietary roadmaps. A retailer operating hypermarkets in Europe and convenience stores in Asia may require two protocol families to comply with local regulations and consumer device requirements. This fragmentation prolongs decision cycles and occasionally causes stalled projects when technology committees cannot align on a single path.
*Our forecasts treat driver/restraint impacts as directional, not additive. The impact forecasts reflect baseline growth, mix effects, and variable interactions.
Segment Analysis
By Product Type: Full-Graphic e-Paper Drives Premium Adoption
Full-graphic e-Paper units recorded the fastest 20.5% CAGR forecast, benefiting from color visuals that support brand imagery and high contrast readability under varied lighting conditions. LCD retained a 52% share in 2024 due to scale economics and acceptable performance for price-led formats. The electronic shelf labels market size for full-graphic e-paper is expected to reach nearly half of the segment’s revenue by 2030, driven by declining pigment costs and increased consumer engagement metrics. Retailers with premium assortments value the ability to blend promotional artwork with dynamic pricing, while discount banners still favour LCD because upfront costs remain 15–20% lower. Segmented e-Paper bridges this gap by offering black-white-red palettes that improve call-out visibility without the full expense of multi-colour matrices. Technological progress, such as the 75-inch Spectra 6 panel, shows that shelf labels and digital signage are converging into unified in-store media assets.[1]E Ink Holdings, “Spectra 6 Large Color ePaper Announcement,” eink.com Over the outlook period, the twin themes of experiential marketing and energy efficiency will steer many retailers toward richer display types, even if unit prices remain above those of legacy LCD.
Second-generation e-Paper incorporates front-light layers and hard coats that withstand cleaning chemicals, extending service life in grocery environments. Integration with low-power Bluetooth sensors allows these labels to broadcast temperature or humidity readings to edge gateways. LCD tags are also innovating; new driver ICs reduce refresh time below 200 ms, enabling multi-page promotions that partially erode e-Paper’s differentiation. Yet, LCD still draws constant power for the backlight in dim aisles, keeping battery swaps at 5-year intervals versus up to a decade for e-Paper. Taken together, the product-type battle will increasingly revolve around total energy budgets and marketing flexibility rather than static cost comparisons, a dynamic that underpins sustained growth within the electronic shelf labels market.


By Communication Technology: NFC Integration Accelerates Mobile Commerce
Radio frequency solutions claimed a 61% share in 2024 and remain the backbone for large floor areas because of their 30-50 m range and tolerance to obstacles. The electronic shelf labels market size for RF systems will continue to grow; yet, NFC’s 16.21% CAGR reflects retailers' increasing appetite for customer-centric features. NFC-enabled labels pair with shopper smartphones to deliver instant product data and one-tap payments. South Korea’s high mobile wallet penetration demonstrates how linking price display with checkout shortens visit times and lifts basket size, as observed in pilot data from 2024 rollouts. These wins encourage global grocery banners to budget NFC overlays inside new store builds. Meanwhile, infrared and visible light communication serve edge cases where the RF spectrum is congested or where healthcare regulations restrict radio emissions. Trials using aisle-mounted LEDs for data backhaul show promise, although installation requires dense luminaire grids that raise capex.
Platform vendors now ship hybrid chips that support both RF and NFC, allowing a single tag to be managed by the store network while still interacting with consumer devices. This dual-mode architecture mitigates the standards risk that restrains some procurement teams. Europe’s pending harmonisation of NFC secure-element rules could further unlock deployment in pharmacies and electronics retailers that stock high-value goods. Hence, technology choice is becoming an exercise in designing the desired customer journey rather than a purely engineering debate, reinforcing the multi-protocol trajectory within the electronic shelf labels market.
By Component: Battery Innovation Drives System Evolution
Displays represented 45% of bill-of-materials costs in 2024 because each tag’s screen dictates both visibility and energy draw. Lithium manganese dioxide cells currently dominate, yet new solid-state chemistries promise a 30% higher density and operate safely across wider temperature ranges. Battery components are therefore the fastest-growing line at a 17.1% CAGR. Wider adoption of energy-harvesting microcontrollers will enable tags to recharge from aisle lighting or HVAC airflow, reducing eventual disposal volumes. Within the electronic shelf labels market share split, processors and transceivers saw lower relative growth but benefited from the 28 nm node migration that halves standby current. Edge logic now supports local caching and image rendering, reducing gateway traffic by up to 50%. This architectural change will, over time, shift more intelligence to the tag, enabling value-added apps such as planogram compliance snapshots captured through embedded cameras.
The EU Battery Regulation 2023/1542 imposes stringent recycling and data-matrix tracking requirements. Vendors already embed QR codes that record chemistry and manufacture date, easing reverse logistics at the end of life.[2]European Commission, “Regulation (EU) 2023/1542 on Batteries and Waste Batteries,” eur-lex.europa.eu Compliance costs may add USD 0.20-0.30 per tag but help retailers meet corporate sustainability goals. Component suppliers collaborate on reference designs that standardise pinouts and firmware across brands, lowering the switching cost that historically locked buyers into single-vendor estates. This push for modularity should gradually compress margins on commoditised parts while positioning software analytics as the key differentiator in the broader electronic shelf labels market.
By Store Type: Specialty Stores Lead Innovation Adoption
Hypermarkets deployed 38% of tags in 2024, justified by large SKU counts and high labour hours for price checks. Specialty stores, ranging from beauty chains to organic grocers, will log the strongest 14.51% CAGR to 2030 because they rely on curated assortments where real-time pricing and storytelling lift conversion. The electronic shelf labels market size for specialty formats is forecast to double over the period as these retailers bundle colour displays with QR codes linking to provenance data. Convenience outlets value contactless checkout, yet unit economics remain sensitive as average SKUs per site are lower than in supermarkets. For non-food outlets such as consumer electronics, labels tilt toward larger dimensions to show technical specs and financing offers.
Seasonal departments exploit schedule-based template changes to roll from Halloween to holiday pricing overnight, a workflow impossible with paper tags. Stock-room efficiency also improves when back-office staff use handheld readers to flash-update clearance items. Retailers report error reductions of 90% in promotional compliance audits after label digitisation. The growing expectation of accurate omnichannel pricing among shoppers means any segment that runs both online and store channels now views ESL as foundational infrastructure. This supply-chain logic will secure long-run penetration gains across every store type inside the electronic shelf labels market.
By Communication Technology: RF Dominance Faces NFC Challenge
Radio Frequency (RF) continues to lead with 61% of the electronic shelf labels market share in 2024, as it scales affordably. Antenna redesigns in 2024 extended the signal reach, allowing chains to reduce the number of gateway units by 15% in new layouts. However, the user-experience advantages of near-field communication (NFC) are reshaping upgrade roadmaps growing at a 16.21% CAGR through 2030. Smartphones do not need an app launch if fast pairing is enabled, allowing shoppers to pull nutrition facts or initiate click-and-collect in situ. Retailers deploying mixed RF-NFC estates have noted a basket uplift among younger demographics who value self-directed journeys.
Visible light communication garners interest for refrigerated cases where RF can be attenuated by metal and liquids. Early trials in beverages show error-free updates despite condensation, hinting at future niche expansion. Ultimately, the electronic shelf labels market will mirror broader IoT patterns, characterized by the coexistence of protocols tailored to environmental, which are, cost, and customer-facing objectives.
Geography Analysis
The Asia Pacific region held 32.2% of 2024 revenue and is expected to lead growth at a 15.23% CAGR through 2030. Government programmes in Japan compel convenience chains to reach full RFID or ESL coverage by 2025, and provincial subsidies in China lower investment barriers for small grocers. Component fabrication proximity cuts freight and duty costs, letting integrators bundle turnkey packages below the global average. Mobile-first consumers in South Korea are further driving the adoption of NFC labels that sync with the country's dominant e-wallets. Local display OEMs supply bespoke form factors within 8 weeks, accelerating pilot-to-scale cycles and cementing the region’s status as both production and demand hub for the electronic shelf labels market.
Europe exhibits mixed drivers. The EU Digital Product Passport enters force in 2026 and will require real-time access to ingredient and recycling data at the point of sale. ESL platforms are the logical conduit; however, compliance adds specification complexity and upfront costs. The EU Battery Directive 2027 also raises disposal obligations. Retailers offset these burdens through energy savings and reduced ticket waste. German service stations have already demonstrated that high-visibility labels can withstand outdoor fuel price boards, thereby expanding the addressable use cases.[3]Retail Technology Review, “Panasonic ESLs boost service-station pricing accuracy,” retailtechnologyreview.com Southern European grocers adopt phased upgrades, prioritising fresh zones where dynamic markdowns prevent waste.
North America’s uptake surged after Walmart began multi-state deployments in 2024. High wages drive a clear ROI from automating label changes. Retail culture is accustomed to digital signage, so the hurdles to customer acceptance are low. State-level privacy laws do, however, impose stricter rules on data collected from NFC interactions, forcing platform vendors to build compliant consent flows. Canadian grocers focus on bilingual templates that switch between English and French instantly, illustrating how localisation remains a critical requirement. Continued penetration in dollar-store and pharmacy channels is expected as vendors offer subscription financing that converts capex to opex inside electronic shelf labels market contracts.

Competitive Landscape
The market is moderately concentrated. VusionGroup, SOLUM, E Ink, and Panasonic represent the core tier of global suppliers, but regional integrators add fragmentation by packaging local software and support. VusionGroup rebranded from SES-imagotag in 2024 to signal its pivot from hardware toward data platforms and closed a landmark roll-out with a US premium grocery chain in December 2024.[4]VusionGroup, “Corporate rebrand from SES-imagotag to VusionGroup,” vusion.com Patent filings reveal a strong focus on low-power driving circuits and reflective color layers by display specialists such as Samsung Display and Sony Semiconductor Solutions. Battery innovators partner with label vendors to embed state-of-health sensors that can be read wirelessly, promoting predictive maintenance.
New entrants target specialty verticals rather than volume retail. For example, start-ups integrate vision analytics, allowing a single rail-mounted camera to inspect both planograms and stock voids, thereby creating incremental value. Established firms answer with API-centric roadmaps, opening label data to third-party app builders. Component price normalisation in 2024 eroded one barrier to entry, but scale economies in global logistics and after-sales service still protect incumbents. Over the forecast years, competition will revolve around artificial intelligence capabilities and sustainability certifications, rather than merely hardware cost, shaping future consolidation waves in the electronic shelf labels market.
Electronic Shelf Labels Industry Leaders
E Ink Holdings Inc.
Displaydata Ltd
Samsung Electro-Mechanics Co. Ltd
Pricer AB
Panasonic Corporation
- *Disclaimer: Major Players sorted in no particular order

Recent Industry Developments
- January 2025: SOLUM accelerated global expansion initiatives, broadening product ranges and channel partnerships to support retail digital transformation.
- January 2025: E Ink extended collaboration with MediaTek on advanced eReader system-on-chips to raise processing power and energy efficiency in next-generation labels.
- December 2024: VusionGroup and The Fresh Market announced a nationwide Vusion 360 roll-out across US stores, marking one of the region’s largest ESL projects.
- December 2024: SES-imagotag completed its corporate rebrand to VusionGroup, underscoring a shift toward integrated retail platforms.


Global Electronic Shelf Labels Market Report Scope
The Electronic Shelf Labels Market Report is Segmented by Product Type (LCD ESLs, Segmented E-Paper ESLs, and Full-Graphic e-Paper ESLs), Communication Technology (Radio Frequency (RF), Near Field Communication (NFC), Infrared (IR), and Visible Light Communication (VLC)), Component (Displays, Batteries, Processors, and Transceivers), Store Type (Hypermarkets, Supermarkets, Specialty Stores, Non-food Retail Stores, and Convenience Stores), and Geography (North America, Europe, Asia Pacific, South America, and Middle East and Africa). The Market Forecasts are Provided in Terms of Value (USD).
| LCD ESLs |
| Segmented e-Paper ESLs |
| Full-Graphic e-Paper ESLs |
| Radio Frequency (RF) |
| Near Field Communication (NFC) |
| Infrared (IR) |
| Visible Light Communication (VLC) |
| Displays |
| Batteries |
| Processors |
| Transceivers |
| Hypermarkets |
| Supermarkets |
| Specialty Stores |
| Non-food Retail Stores |
| Convenience Stores |
| North America | United States | |
| Canada | ||
| Mexico | ||
| Europe | Germany | |
| United Kingdom | ||
| France | ||
| Italy | ||
| Spain | ||
| Benelux | ||
| Nordics | ||
| Russia | ||
| Asia Pacific | China | |
| India | ||
| Japan | ||
| South Korea | ||
| ASEAN | ||
| Rest of Asia Pacific | ||
| South America | Brazil | |
| Argentina | ||
| Chile | ||
| Middle East and Africa | Middle East | GCC (Saudi Arabia, UAE, Qatar, Kuwait, Oman, Bahrain) |
| Turkey | ||
| Israel | ||
| Africa | South Africa | |
| Nigeria | ||
| Egypt | ||
| By Product Type | LCD ESLs | ||
| Segmented e-Paper ESLs | |||
| Full-Graphic e-Paper ESLs | |||
| By Communication Technology | Radio Frequency (RF) | ||
| Near Field Communication (NFC) | |||
| Infrared (IR) | |||
| Visible Light Communication (VLC) | |||
| By Component | Displays | ||
| Batteries | |||
| Processors | |||
| Transceivers | |||
| By Store Type | Hypermarkets | ||
| Supermarkets | |||
| Specialty Stores | |||
| Non-food Retail Stores | |||
| Convenience Stores | |||
| By Geography | North America | United States | |
| Canada | |||
| Mexico | |||
| Europe | Germany | ||
| United Kingdom | |||
| France | |||
| Italy | |||
| Spain | |||
| Benelux | |||
| Nordics | |||
| Russia | |||
| Asia Pacific | China | ||
| India | |||
| Japan | |||
| South Korea | |||
| ASEAN | |||
| Rest of Asia Pacific | |||
| South America | Brazil | ||
| Argentina | |||
| Chile | |||
| Middle East and Africa | Middle East | GCC (Saudi Arabia, UAE, Qatar, Kuwait, Oman, Bahrain) | |
| Turkey | |||
| Israel | |||
| Africa | South Africa | ||
| Nigeria | |||
| Egypt | |||


Key Questions Answered in the Report
What is the current value of the electronic shelf labels market?
The market is valued at USD 1.97 billion in 2025 and is forecast to reach USD 3.78 billion by 2030.
Which technology dominates electronic shelf labels deployments today?
Radio frequency systems hold 61% share, although NFC is the fastest-growing protocol at a 16.21% CAGR.
Why are retailers shifting from paper to electronic labels?
Drivers include omnichannel price alignment, rising labour costs, compliance with EU Digital Product Passport rules, and lower total cost of ownership as battery life extends to 7-10 years.
Which region is adopting electronic shelf labels the fastest?
Asia Pacific leads both current share at 32.2% and growth at a 15.23% CAGR owing to supportive regulations and manufacturing proximity.
How long is the typical payback period for an ESL project?
Payback averages 18–24 months for large chains once savings from labour, printing, and pricing errors are captured.
What emerging feature adds value beyond price automation?
Integration with AI-powered computer-vision shrinkage analytics helps cut inventory loss and improves shelf availability, enhancing the investment case for ESL systems.
Page last updated on:


