
Electrical Stimulation Devices Market Size and Share
Market Overview
| Study Period | 2020 - 2031 |
|---|---|
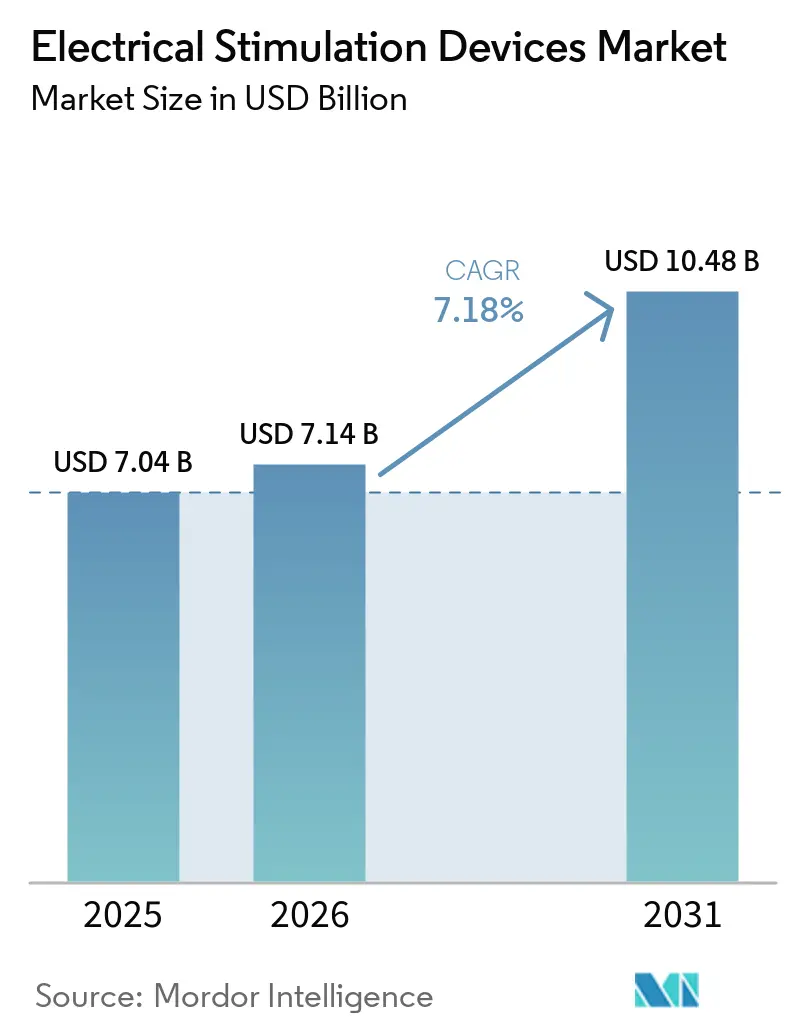
| Market Size (2026) | USD 7.14 Billion |
| Market Size (2031) | USD 10.48 Billion |
| Growth Rate (2026 - 2031) | 7.18 % |
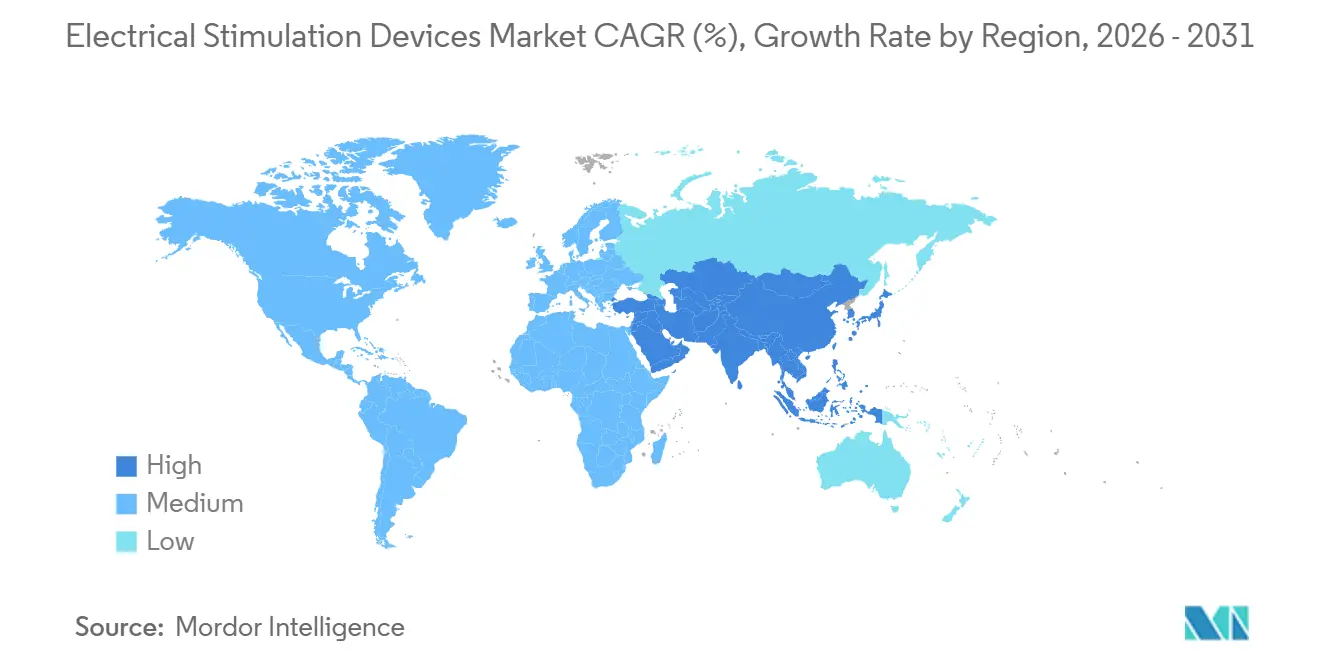
| Fastest Growing Market | Asia Pacific |
| Largest Market | North America |
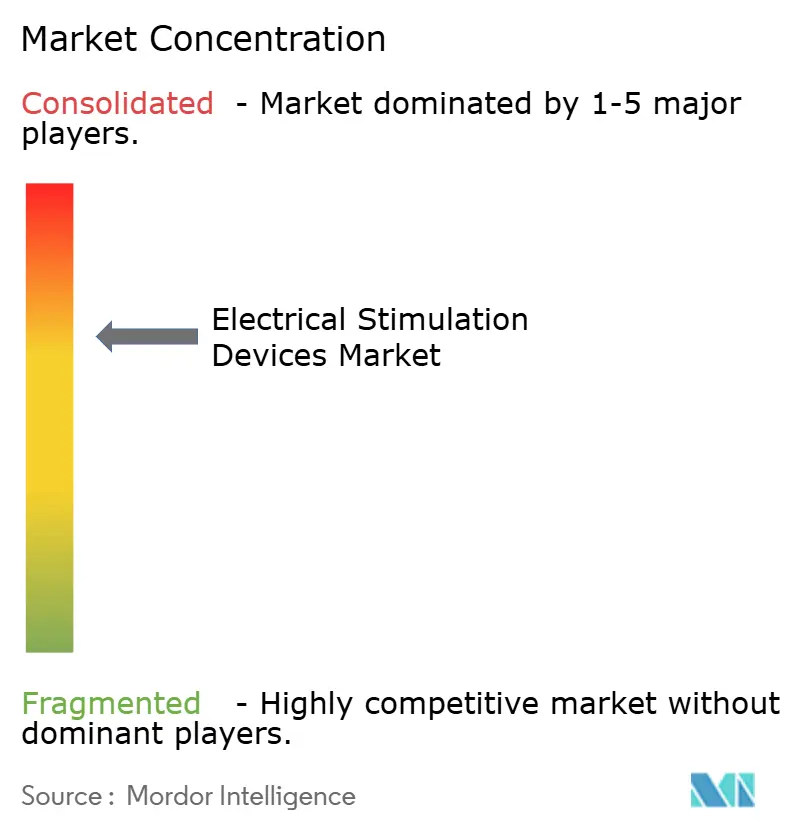
| Market Concentration | Medium |
Major Players *Disclaimer: Major Players sorted in no particular order Image © Mordor Intelligence. Reuse requires attribution under CC BY 4.0. | |
Electrical Stimulation Devices Market Analysis by Mordor Intelligence
The Electrical Stimulation Devices Market size is projected to expand from USD 7.04 billion in 2025 and USD 7.14 billion in 2026 to USD 10.48 billion by 2031, registering a CAGR of 7.18% between 2026 to 2031.
Demand is shifting toward closed-loop, adaptive neurostimulation that fine-tunes therapy in real time, easing the trial-and-error burden that clinicians face with first-generation, open-loop systems. Abbott’s Infinity DBS platform with directional leads, cleared in 2024, lets surgeons steer current away from sensitive brain regions and cut programming time by two-thirds. In parallel, the Centers for Medicare & Medicaid Services broadened its National Coverage Determination to reimburse high-frequency and burst spinal cord stimulation, eliminating prior-authorization delays for chronic-pain patients.[1]Centers for Medicare & Medicaid Services, “National Coverage Determination for Spinal Cord Stimulation,” Centers for Medicare & Medicaid Services, cms.govDevice makers are converting this policy momentum into wider access, especially as payers link neurostimulation coverage to reduced opioid prescriptions and shorter hospital stays. Manufacturers also see an addressable opportunity in aesthetic uses such as muscle toning, where the U.S. Food and Drug Administration has cleared non-invasive body-contouring platforms that merge electrical myostimulation with radiofrequency heating.[2]U.S. Food and Drug Administration, “Medical Devices,” Food and Drug Administration, fda.gov
Key Report Takeaways
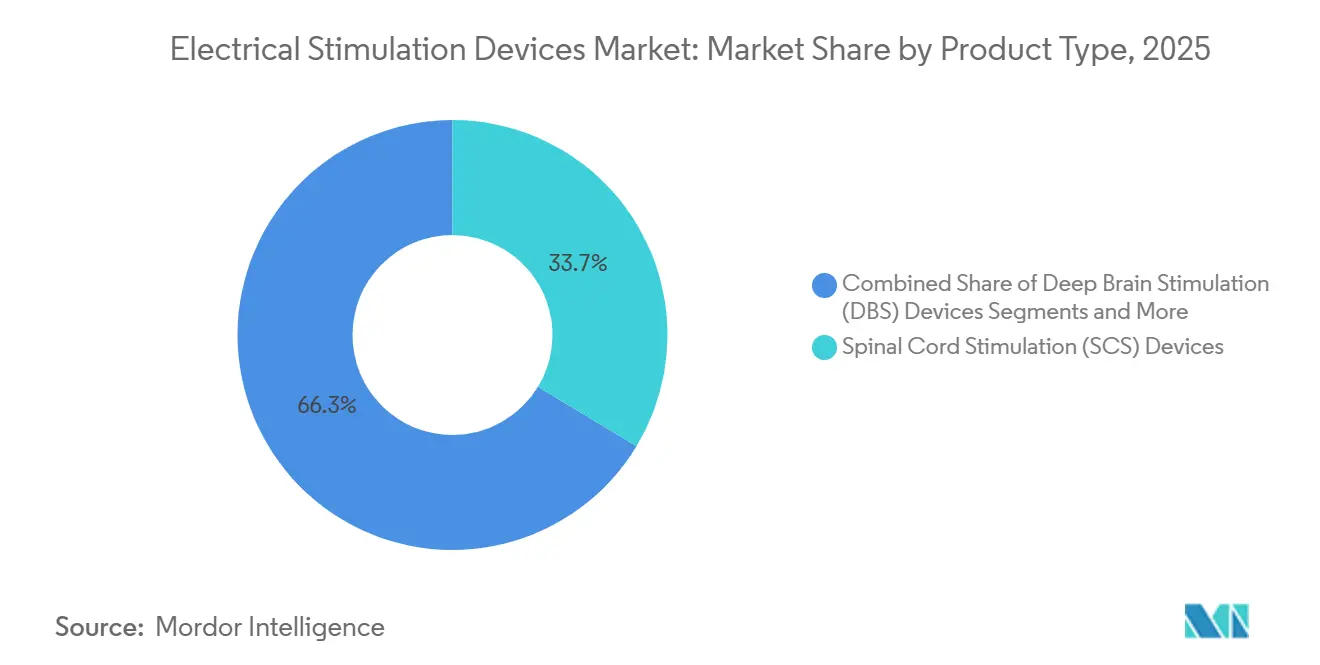
- By product category, spinal cord stimulation devices held 33.66% of 2025 revenue, while deep brain stimulators are forecast to advance at a 9.45% CAGR through 2031, the fastest among all products.
- By application, pain management commanded 44.23% of 2025 revenue; aesthetic and cosmetology uses are poised for an 11.38% CAGR to 2031, outpacing every other therapeutic area.
- By end user, hospitals and clinics generated 49.55% of 2025 revenue, yet home-care settings are projected to post a 10.33% CAGR through 2031 as payers reimburse take-home TENS units.
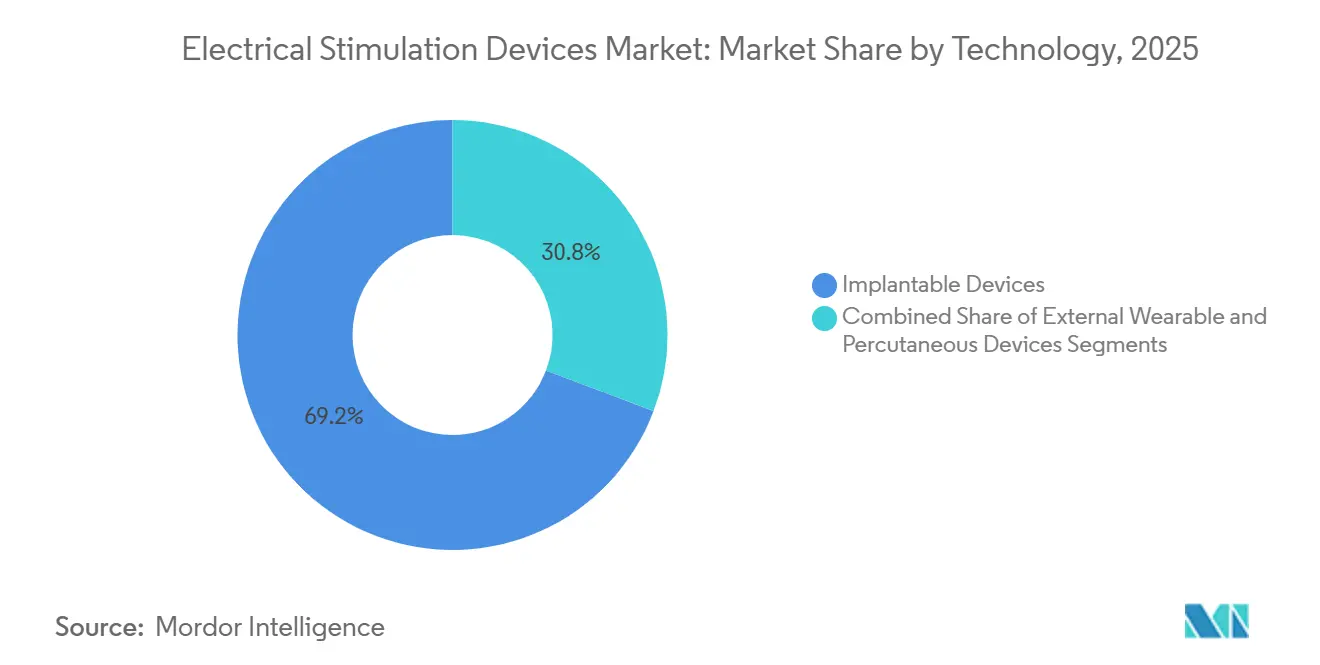
- By technology, implantable platforms collected 69.24% of 2025 revenue; percutaneous devices are set to grow at 9.62% as ambulatory surgery centers favor shorter, local-anesthesia procedures.
- By geography, North America represented 39.34% of 2025 sales, but Asia-Pacific will lead growth at a 9.05% CAGR through 2031, catalyzed by fast-tracked approvals in Japan and China.
Note: Market size and forecast figures in this report are generated using Mordor Intelligence’s proprietary estimation framework, updated with the latest available data and insights as of 2026.
Global Electrical Stimulation Devices Market Trends and Insights
Drivers Impact Analysis*
| Driver | (~) % Impact on CAGR Forecast | Geographic Relevance | Impact Timeline |
|---|---|---|---|
| Rising prevalence of chronic pain and musculoskeletal disorders | +1.2% | Global, highest in North America and Europe | Long term (≥ 4 years) |
| Growing geriatric population with neurological conditions | +1.0% | Global, APAC aging faster than other regions | Long term (≥ 4 years) |
| Increasing adoption of minimally invasive neurostimulation therapies | +1.3% | North America & EU, spreading to APAC | Medium term (2-4 years) |
| Favorable reimbursement for neurostimulation implants | +1.1% | North America, Germany, France | Short term (≤ 2 years) |
| Integration of closed-loop adaptive stimulation algorithms | +1.5% | Early adoption in North America & EU | Medium term (2-4 years) |
| Surge in tele-rehabilitation programs using home-based stimulators | +0.9% | Global where digital health infrastructure exists | Short term (≤ 2 years) |
| Source: Mordor Intelligence | |||
Rising Prevalence of Chronic Pain & Musculoskeletal Disorders
Chronic pain affects one-fifth of adults worldwide, with musculoskeletal diseases ranking as the leading source of disability in World Health Organization burden-of-disease metrics published in 2024. Electrical stimulation offers a drug-free alternative that sidesteps opioid dependence and gastrointestinal side effects tied to non-steroidal anti-inflammatory drugs. The U.S. Department of Veterans Affairs added TENS devices to its formulary in 2025, targeting 1.2 million veterans enrolled in pain-management programs and trimming reliance on controlled substances.[3]U.S. Department of Veterans Affairs, “Chronic Pain Management Programs,” Veterans Affairs, va.gov Employers are embedding TENS units into wellness plans because low-back pain costs U.S. businesses more than USD 100 billion annually in lost productivity. Spinal cord stimulation now enters the treatment pathway within six months of failed conservative care, a protocol shift that enlarges the eligible pool and prevents central sensitization that worsens long-term outcomes.
Growing Geriatric Population with Neurological Conditions
United Nations forecasts show that people aged 65 and older will number 1.6 billion by 2050, with Parkinson’s prevalence doubling to 12.9 million. Deep brain stimulation is the gold standard when levodopa falters, yet only 15% of qualifying patients undergo surgery. Abbott’s directional-lead technology, cleared in 2024, trims programming sessions from 90 minutes to under 30 minutes, easing the workload at movement-disorder clinics. Japan subsidizes deep brain stimulation through its long-term care insurance, covering up to 70% of device and surgery costs for eligible Parkinson’s patients. Vagus-nerve stimulation for drug-resistant epilepsy gains traction among older adults, with LivaNova’s SenTiva system auto-adjusting output based on heart-rate variability, lifting adherence for users who struggle with manual programming.
Increasing Adoption of Minimally-Invasive Neurostimulation Therapies
Percutaneous lead placement under local anesthesia shortens procedures to 45 minutes, half the time of open laminectomy for paddle leads. Nevro’s HFX iQ platform combines percutaneous leads with AI that auto-programs parameters by interpreting pain scores and activity data from a wrist sensor. Ambulatory surgery centers prefer these approaches because they avoid general anesthesia, enable same-day discharge, and cut facility costs by 40%. The “trial-before-implant” model, where patients test a temporary percutaneous lead for a week, boasts an 85% conversion rate to permanent implants, lowering payers’ financial risk. Regulators now accept registry data to speed approvals of next-gen waveforms such as burst and differential-target multiplexed stimulation.
Favorable Reimbursement for Neurostimulation Implants
CMS removed the psychological-evaluation requirement for high-frequency spinal cord stimulation in 2024, cutting therapy delays by eight weeks. Private U.S. insurers quickly mirrored the change, while Germany’s Federal Joint Committee added deep brain stimulation for treatment-resistant depression to its reimbursable services in 2025. France’s health authority broadened sacral neuromodulation coverage to fecal incontinence, enlarging the eligible population by 30% and spurring referrals earlier in the disease course. Asia-Pacific remains mixed: South Korea covers 80% of spinal cord stimulation costs but caps reimbursement at KRW 20 million (USD 15,000), forcing patients to top up for premium rechargeable systems.
Restraints Impact Analysis*
| Restraint | (~) % Impact on CAGR Forecast | Geographic Relevance | Impact Timeline |
|---|---|---|---|
| High upfront cost of implantable stimulators | -0.8% | Global, greatest in markets without universal coverage | Long term (≥ 4 years) |
| Stringent regulatory approval processes | -0.6% | Global, especially EU and U.S. | Medium term (2-4 years) |
| Battery-longevity concerns limiting home-use adherence | -0.5% | Global, higher where follow-up is scarce | Short term (≤ 2 years) |
| Cyber-security vulnerabilities in wireless neurostim devices | -0.4% | North America & EU | Medium term (2-4 years) |
| Source: Mordor Intelligence | |||
High Upfront Cost of Implantable Stimulators
A spinal cord stimulation episode costs USD 30,000–50,000, exceeding annual per-capita health spending in most middle-income countries. Rechargeable systems add USD 5,000–8,000 yet stretch life to 15 years, a value equation that cost-constrained payers debate. India’s Ayushman Bharat program covers pacemakers but not neurostimulation, so patients self-fund or rely on charitable implants that total fewer than 500 per year. European pilots now tie reimbursement to outcomes—covering devices only when pain drops 50% at 12 months—shifting financial risk to manufacturers. Leasing schemes remain rare because many jurisdictions forbid third-party ownership of implanted hardware, stalling payment-model innovation.
Stringent Regulatory Approval Processes
U.S. FDA pre-market approval demands at least one 12-month pivotal trial, pushing timelines to 30 months and costs to USD 40 million, a hurdle that discourages start-ups. Europe’s Medical Device Regulation, effective 2024, forces legacy products to backfill clinical evidence or exit the market. Japan introduced a conditional pathway in 2025 that grants three-year provisional access based on early data while confirmatory trials proceed. China fast-tracked a dozen neurostimulators in 2024, but domestic data requirements still extend filings to two years. Global harmonization efforts exist, yet divergent stances on cybersecurity and electromagnetic compatibility continue to fragment the approval landscape.
*Our forecasts treat driver/restraint impacts as directional, not additive. The impact forecasts reflect baseline growth, mix effects, and variable interactions.
Segment Analysis
By Product Type: Implantable Neuromodulation Drives Premium Revenue
Deep brain stimulators are expected to post a 9.45% CAGR through 2031 as regulatory labels expand into depression and obsessive-compulsive disorder. Spinal cord stimulators accounted for 33.66% of 2025 revenue, thanks to Nevro’s 10 kHz platform and Boston Scientific’s WaveWriter Alpha with independent current control. Over-the-counter transcutaneous units, such as Omron’s smartphone-linked TENS launched in 2025, widen consumer reach. Neuromuscular systems attract sports medicine, while functional electrical stimulation for foot drop helps stroke survivors restore gait speed. Pelvic-floor stimulators treat incontinence, with Axonics’ rechargeable F15 capturing 25% of the U.S. market within 18 months of its 2024 debut. Vagus-nerve stimulators remain niche but vital for refractory epilepsy.
Regulatory hurdles differ widely: transcutaneous devices clear FDA 510(k) pathways, while spinal and deep brain systems navigate costly pre-market approvals. Average selling prices range from USD 15,000–25,000 for implants to USD 200–500 for external wearables, creating a barbell revenue structure. Hybrid approaches that let patients trial external leads before committing to surgery aim to curb the 10-15% explant rate due to inadequate pain relief.



By Application: Aesthetic Segment Disrupts Traditional Pain Focus
Pain management delivered 44.23% of 2025 revenue, but aesthetic and cosmetology indications are slated for an 11.38% CAGR to 2031. BTL’s Emsculpt Neo, cleared in 2024, combines high-intensity electromagnetic stimulation with RF heating to deliver 25% muscle gain and 30% fat loss over four visits, fueling a USD 500 million U.S. cash-pay niche. Neurological disorders—Parkinson’s, essential tremor, epilepsy, depression—depend on implantable devices for durable symptom control. Musculoskeletal therapy uses TENS and neuromuscular stimulation during rehab, while sacral neuromodulation expands to fecal incontinence with Axonics’ rechargeable system. Wound healing employs low-intensity currents to speed closure of diabetic ulcers. Reimbursement remains fragmented: Medicare backs chronic-pain stimulation but excludes cosmetic uses, while European payers differ on depression coverage despite FDA approval. Manufacturers respond with multi-indication platforms to spread R&D costs and hedge reimbursement risks.
By Technology: Percutaneous Devices Gain on Surgical Simplicity
Implantables generated 69.24% of 2025 technology revenue, buoyed by premium pricing and battery replacements. Percutaneous devices are on track for 9.62% growth, favored by ambulatory centers needing shorter, local-anesthesia procedures. Stimwave’s leadless Freedom-8A removes the subcutaneous pocket, slashing infection sources. Wearable TENS and neuromuscular belts serve home-care and sports markets; however, adherence wanes as 40% of users abandon therapy within six months due to pad irritation and setup time. Sensor-equipped pads made with stimulation materials that flag poor adhesion now extend pad life to 20 uses, lifting compliance.
By End User: Home Care Rises on Payer Pressure
Hospitals and clinics held 49.55% of 2025 revenue, driven by surgical implants. Home-care adoption is forecast at a 10.33% CAGR as payers cover take-home TENS to curb opioid scripts and readmissions. CMS reimburses virtual rehab visits that integrate home-based stimulators, saving Medicare USD 15 billion annually in avoided readmissions. Ambulatory surgery centers now perform 20% of spinal cord stimulator implants, up from 12% in 2023, benefiting from shorter anesthesia times and lower facility fees. Sports medicine applies neuromuscular stimulation for faster muscle recovery, while research institutes deploy investigational platforms funded by eight NIH trials in 2025
Geography Analysis
North America captured 39.34% of 2025 revenue, propelled by Medicare coverage and a dense interventional-pain network that performs more than 50,000 spinal cord stimulations a year. CMS expanded reimbursement to high-frequency waveforms in 2024, removing psychological-evaluation delays. Canada funds deep brain stimulation but not spinal cord stimulators for non-cancer pain, leaving private insurance to fill gaps. Mexico’s public plan excludes neurostimulation, limiting implants to about 200 a year through charity programs.
Europe, with Germany, France, and the U.K. leading. Germany reimburses deep brain stimulation for treatment-resistant depression, paying EUR 25,000 (USD 27,000) for devices plus surgery. The EU Medical Device Regulation forces makers to substantiate clinical data for legacy products or exit the bloc. France widened sacral neuromodulation coverage to fecal incontinence, boosting patient pools by 30%. Spain and Italy lag due to regional budget caps, causing 18-month DBS waitlists.
Asia-Pacific will post the fastest growth at 9.05% through 2031. Japan’s PMDA approved rechargeable sacral neuromodulators in 2025 and subsidizes DBS for Parkinson’s under long-term care insurance. China’s fast-track channel still averages 24 months due to local data rules. India’s national insurance excludes neurostimulation, leaving annual spinal cord stimulator implants below 500 for its 1.4 billion people. South Korea covers 80% of spinal stimulators but caps reimbursement, compelling patients to self-pay for premium models. Australia’s Pharmaceutical Benefits Scheme now covers 75% of Axonics’ sacral neuromodulator cost, spurring uptake.
Gulf states import devices through compassionate-use corridors, implanting under 100 spinal stimulators annually. South Africa’s private insurers fund spinal stimulation for failed back surgery syndrome, but public hospitals lack budget and trained staff. Brazil reimburses DBS for Parkinson’s yet excludes spinal stimulators, fostering a private-sector niche in São Paulo and Rio de Janeiro. Argentina’s currency controls and import licenses extend delivery times by six months.

Regulatory Landscape
Regulation diverges by product risk, and by whether a device is a combination product. In the United States, most implantable neuromodulation systems (for example, SCS and DBS) follow a pre-market approval pathway, while many external stimulators such as TENS/EMS typically use the 510(k) route supported by FDA guidance for powered muscle stimulators. For combination products, FDA oversight is coordinated through the Office of Combination Products and governed by 21 CFR Part 4, which requires manufacturers to demonstrate compliance across device quality system and drug CGMP requirements when applicable.
Recent regulatory changes add to compliance work and also clarify pathways. FDA's Quality Management System Regulation (QMSR) became effective on February 2, 2026, aligning device quality requirements more closely with ISO 13485 concepts and affecting manufacturers that operate device and combination-product quality systems. In Europe, the Medical Device Regulation (Regulation (EU) 2017/745) continues to tighten clinical evidence expectations for legacy portfolios, and the European Commission has updated harmonized standards used to show conformity for medical electrical equipment (for example, via a June 17, 2026 implementing decision update). Separately, the FDA published a proposed rule in March 2024 to ban electrical stimulation devices intended for self-injurious or aggressive behavior, reinforcing that intended use and labeling can materially change the permissible market for certain stimulation product categories.
Value Chain Analysis
Electrical stimulation device value chains cover specialized components, regulated manufacturing, and clinician-led or consumer distribution depending on invasiveness. Upstream supply includes electronic components, electrodes/leads, battery systems for implantables, and precision-machined housings and connectors, where supplier traceability and process validation are central for implantable and software-enabled platforms. Midstream, manufacturers integrate hardware with embedded software, connectivity modules, and therapy algorithms, then complete verification and validation activities such as electromagnetic compatibility and electrical safety testing (often aligned to IEC 60601-1 for applicable non-implantable medical electrical equipment), along with human factors work for home-use systems.
Downstream, purchasing splits between hospitals and ambulatory surgery centers for implantables, and retail or home-care fulfillment for external stimulators. Quality and supplier controls remain a gating factor throughout the chain, reinforced by ISO 13485:2016 purchasing control requirements and, more recently, the International Medical Device Regulators Forum supplier-control guidance released in May 2026, which reiterates risk-based oversight of outsourced products and services. For combination products, FDA primary mode-of-action determinations and Part 4 compliance drive cross-functional coordination across device, drug, and software documentation, adding checkpoints that can lengthen supplier qualification cycles and raise the value of experienced contract manufacturers and validated component suppliers.
Competitive Landscape
The electrical stimulation devices market is moderately concentrated. Competition hinges on closed-loop algorithms, rechargeable power, and multi-indication portfolios. Medtronic’s Intellis sends battery alerts to caregivers’ phones, tackling the 15% surprise-shutdown rate. Abbott’s Infinity DBS directional-lead system trims programming visits by two-thirds, easing clinic workloads. Saluda Medical and Stimwave disrupt incumbents with battery-free, leadless stimulators that harvest wireless energy, removing pocket infections. Saluda’s Evoke device measures evoked potentials in real time to maintain therapeutic dosing and curb the 10-15% explant rate. Forty-seven U.S. patents were issued in 2024-2025 for burst, multiplexed waveforms and AI-powered parameter prediction. FDA’s draft cybersecurity rules favor larger players with robust software engineering, adding compliance costs that may thin smaller rivals.
Electrical Stimulation Devices Industry Leaders
Medtronic plc
Abbott
Boston Scientific Corporation
Nevro Corp.
LivaNova PLC
- *Disclaimer: Major Players sorted in no particular order

Market Opportunities and Future Outlook
The main opportunity centers on expanding indications, moving stimulation into earlier care pathways, and scaling home-managed therapy models where payers and providers can link outcomes to reduced medication burden. In pain and neuromodulation, the shift toward closed-loop and adaptive systems creates room in programming efficiency, explant reduction, and long-term therapy consistency, while reimbursement actions such as CMS coverage broadening for advanced spinal cord stimulation waveforms support provider adoption and patient access. Home-care growth is also tied to tele-rehabilitation workflows, where reimbursed virtual rehab visits integrate home-based stimulators and monitoring, supporting demand for connected, patient-friendly devices with stronger adherence features.
Clinical and company activity in 2026 also points to adjacent expansion spaces beyond traditional chronic pain and movement disorders. NeuroPace disclosed a March 2026 FDA PMA supplement submission aimed at expanding responsive neurostimulation into idiopathic generalized epilepsy, signaling continued label-expansion strategies for established neuromodulation platforms. In rehabilitation and complex neurology, new trials registered on ClinicalTrials.gov include a brain-controlled spinal cord stimulation study for stroke rehabilitation (NCT07610850, registered May 2026) and a Cleveland Clinic pilot study evaluating percutaneous electrical nerve field stimulation for adult gastroparesis (NCT07492108, initiated in 2026). Academic publications likewise support the direction of algorithm-guided, multi-contact epidural stimulation in spinal cord injury (Nature Communications Medicine, May 2026), reinforcing a pipeline of software-driven and multi-contact hardware approaches as evidence matures.
Recent Industry Developments
- June 2026: Bioness Medical announced FDA 510(k) clearance for its PoNS portable neuromodulation stimulator for managing patients recovering from stroke, including chronic stroke-related gait deficit. The authorization expands addressable neuromodulation use cases in rehabilitation and strengthens the non-implantable segment where clinic-to-home continuity is central to outcomes.
- May 2026: NRx Pharmaceuticals reported FDA clearance to proceed with a clinical trial evaluating NRX-101 in combination with robotic-assisted transcranial magnetic stimulation. The program underscores ongoing convergence between neurostimulation modalities and adjunct therapeutic approaches, widening the clinical-development funnel around stimulation-enabled treatment pathways.
- April 2026: ANEUVO disclosed FDA clearance for ExaStim, a stimulation system positioned for spinal cord injury applications. The clearance supports competitive momentum in neurorehabilitation-focused stimulation and adds another entrant targeting function-restoration settings beyond conventional pain-centric neurostimulation.


Research Methodology Framework and Report Scope
Market Definition and Coverage
This market covers medical devices that deliver controlled electrical pulses to nerves or muscles to manage pain, restore function, support rehabilitation, or treat specific neuro and pelvic conditions, across implantable and external formats sold through clinical and home settings.
Scope exclusions: Cosmetic body toning gadgets and non-medical wellness stimulators sold without a clinical indication are excluded from the market totals.
Segmentation Overview
- By Product Type
- Neuromuscular Electrical Stimulation (NMES) Devices
- Transcutaneous Electrical Nerve Stimulation (TENS) Devices
- Functional Electrical Stimulation (FES) Devices
- Spinal Cord Stimulation (SCS) Devices
- Deep Brain Stimulation (DBS) Devices
- Vagus Nerve Stimulation (VNS) Devices
- Pelvic Floor Electrical Stimulation Devices
- By Application
- Pain Management
- Neurological Disorders Management
- Musculoskeletal Disorders
- Incontinence & Pelvic Organ Prolapse
- Aesthetic & Cosmetology
- Wound Healing
- By End User
- Hospitals & Clinics
- Rehabilitation Centers
- Home Care Settings
- Sports Medicine & Fitness Centers
- Research Institutes
- By Technology
- Implantable Devices
- External Wearable Devices
- Percutaneous Devices
- By Geography
- North America
- United States
- Canada
- Mexico
- Europe
- Germany
- France
- United Kingdom
- Italy
- Spain
- Rest of Europe
- Asia-Pacific
- China
- Japan
- India
- South Korea
- Australia
- Rest of Asia-Pacific
- Middle East & Africa
- GCC
- South Africa
- Rest of Middle East & Africa
- South America
- Brazil
- Argentina
- Rest of South America
- North America
Data Sources, Market Sizing, and Validation
Desk Research
Desk research was used to map the device landscape and anchor the demand signals that explain where stimulation therapies are used and paid for. We leaned on public and official sources such as the US FDA device databases, the US Centers for Medicare and Medicaid Services payment schedules, the US CDC for condition prevalence references, and OECD health spending indicators.
To keep the model grounded in real adoption, additional inputs were taken from peer-reviewed clinical journals on stimulation outcomes, clinical guideline bodies, government procurement notices, and manufacturer annual reports and investor decks to cue product mix. Where it helped fill gaps on company revenue splits and pipeline timing, paid subscriptions for company financials and patent databases were used as supporting context. The examples above are not exhaustive, and many other public sources were also checked for data collection, validation, and research clarification.
Primary Interviews and Surveys
Primary work focused on checking what is actually purchased and used across indications, and then reconciling that with what is reimbursed and what is self paid. We spoke with clinicians involved in pain management and neuro and rehab care pathways, as well as procurement and distributor-side respondents who track unit flow, replacement cycles, and typical pricing moves across regions.
Inputs from these discussions were used to confirm adoption rates by setting (hospital, outpatient, and home), refine device mix between implantable and non-implantable categories, and pressure-test assumptions on utilization and pricing in APAC, EMEA, and the Americas.
Distribution of primary research fieldwork respondents
| Company type | Respondent position | Region |
|---|---|---|
| Top tier: 32% | CXOs: 17% | APAC: 53% |
| Mid tier: 51% | Functional/Unit leaders: 33% | EMEA: 29% |
| Smaller Players: 17% | Managers: 50% | Americas: 18% |
Market-Sizing & Forecasting
The sizing starts with a top-down build where treated patient pools and procedure volumes are reconstructed by major therapy areas, and then translated into device demand using penetration and replacement assumptions. The model is then checked using selective bottom-up approximations, such as sampled average selling price bands multiplied by estimated unit volumes for key device classes, followed by channel conversations that help correct any overstatement.
A few practical inputs that shape the totals include implant rates for neurostimulation procedures, usage intensity for external stimulators in rehab pathways, typical generator and lead replacement intervals, reimbursement coverage levels by setting, and observed price moves by device class as new models launch. When bottom-up checks are incomplete for smaller countries, gaps are handled using proxy indicators such as healthcare spend, specialist availability, and procedure capacity, then adjusted after interviews.
For forecasting, scenario analysis is used alongside multivariate regression so the outlook reflects both macro health system capacity and therapy adoption behavior. Growth is primarily linked to variables such as chronic pain prevalence, aging population share, surgical volumes for implant indications, guideline expansion, and reimbursement stability, which are then validated with expert expectations before finalizing the curve.
Data Validation & Update Cycle
Model outputs are validated through triangulation across independent signals such as procedure volumes, reimbursement fee schedules, and reported device class revenue splits, and then reviewed for country-level anomalies. When a variance looks too large, we re-check the input chain, revisit currency timing, and re-contact selected respondents to confirm whether a policy change, pricing move, or supply constraint is the real driver.
Before sign-off, the dataset and calculations go through multiple analyst reviews so the assumptions remain traceable and consistent across regions and device types. Reports are refreshed annually, with interim updates triggered by material events such as major reimbursement edits, product recalls, or new indication approvals. Right before delivery, an analyst performs a fresh pass so clients receive the latest updated view.
Mordor Intelligence's Electrical Stimulation Devices Market Size Measured Against Other Published Estimates
Published numbers for electrical stimulation devices do not always match because the market can be counted from different angles, and even small shifts in what is included can change totals quickly. Differences also show up when firms pick different base years, use different currency conversion timing, or project prices and adoption with more aggressive or conservative assumptions.
Consumer wellness stimulators sold outside a medical treatment pathway sit outside Mordor Intelligence's scope, which commonly explains why some published totals land higher even when the growth story looks similar. Other gaps tend to come from mixing implantable and external devices without consistent therapy definitions, using list prices instead of realized ASP ranges, and projecting procedure growth without checking constraints such as specialist capacity and reimbursement eligibility.
Benchmark comparison
| Source | Market Size | Gaps in Research Methodology |
|---|---|---|
| Mordor Intelligence | USD 7.04 B (2025) | |
| Industry Publisher A | USD 8.25 B (2025) | The estimate appears to use a broader device net that can pull in adjacent consumer and wellness stimulation products, and it does not clearly separate procedure-linked implant demand from home-use utilization assumptions. |
| Research Publisher B | USD 8.43 B (2025) | The scope is presented across several product types, but the sizing can differ if revenues are counted at list price or if service and accessory revenues are blended into device totals without consistent ASP and replacement-cycle checks. |
The spread in the table is mainly explained by scope inclusions and by how pricing and utilization are translated into revenue for each therapy class. By tying the totals back to treated pools, procedure flow, replacement cycles, and realistic ASP ranges, we end up with a number that can be rechecked and repeated year over year.


Key Questions Answered in the Report
How large is the electrical stimulation devices market in 2026?
The market is valued at USD 7.14 billion in 2026 and is projected to reach USD 10.48 billion by 2031.
Which product category is expanding fastest?
Deep brain stimulators are set for a 9.45% CAGR through 2031 as indications broaden to depression and OCD.
What drives Asia-Pacific growth?
Fast-track approvals in Japan and China and aging populations are propelling a 9.05% regional CAGR.
Why are percutaneous systems gaining share?
Shorter, local-anesthesia procedures and 85% trial-to-implant conversion rates make percutaneous leads attractive to ambulatory centers.
How are payers influencing home-care adoption?
Reimbursement for take-home TENS units and virtual rehab visits is fueling a 10.33% CAGR in the home-care segment.
Which restraint has the largest negative impact on growth?
High upfront costs cut CAGR by 0.8%, especially in markets lacking universal health coverage.
Page last updated on:


 Your data is secure and never sold or shared.


