
Market Overview
| Study Period | 2021 - 2031 |
|---|---|
| Forecast Data Period | 2026 - 2031 |
| Base Year Market Size (2025) | 3.59 gigawatt |
| Market Volume (2026) | 4.28 gigawatt |
| Market Volume (2031) | 10.28 gigawatt |
| Growth Rate (2026 - 2031) | 19.18 % |
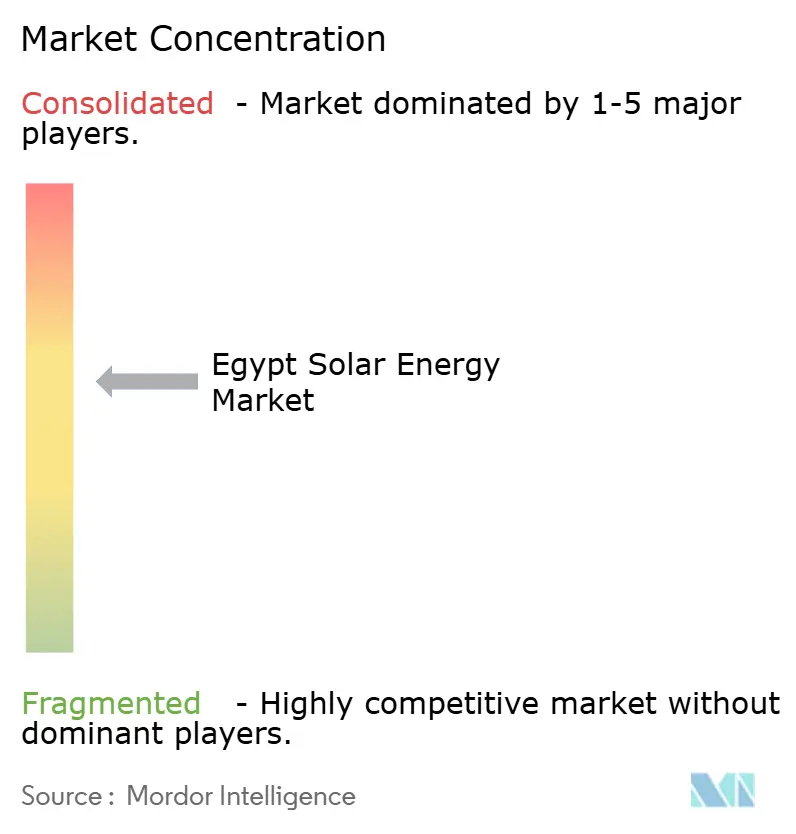
| Market Concentration | Medium |
Major Players *Disclaimer: Major Players sorted in no particular order Image © Mordor Intelligence. Reuse requires attribution under CC BY 4.0. | |
Egypt Solar Energy Market Analysis by Mordor Intelligence
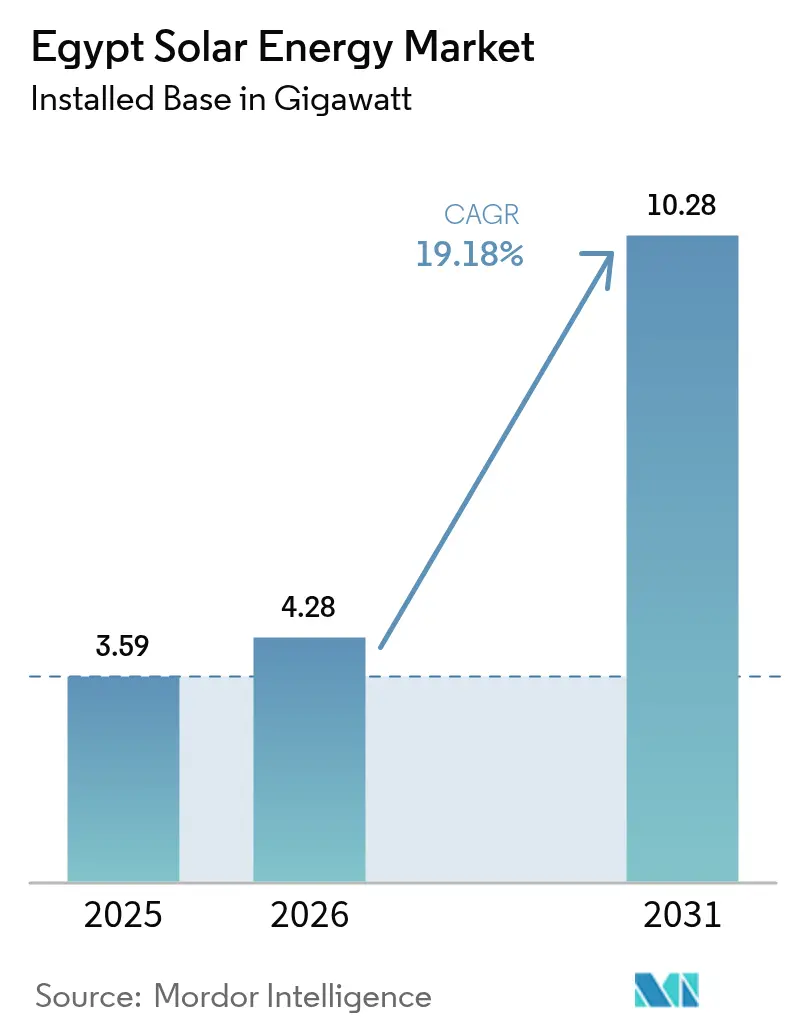
The Egypt Solar Energy Market size was valued at 3.59 gigawatt in 2025 and estimated to grow from 4.28 gigawatt in 2026 to reach 10.28 gigawatt by 2031, at a CAGR of 19.18% during the forecast period (2026-2031).
Robust solar irradiation that exceeds 2,000 kWh/m²/year across vast desert zones, a clear government target of 42% renewable power by 2030, and deep pools of development-bank finance anchor the upward trajectory of the Egyptian solar energy market. International financiers led by the International Finance Corporation and the African Development Bank are funnelling low-cost capital into utility projects, while tariff revisions have strengthened the economics of commercial and industrial (C&I) self-consumption schemes. Localized manufacturing, exemplified by an 8 GW cell-and-module complex in New Alamein, offers a hedge against foreign-exchange swings and may eventually cut module import bills by 15-20% once scaled. Hybrid solar-plus-storage and green-hydrogen chains are emerging as the next growth layer, underpinned by Egypt’s USD 40 billion hydrogen roadmap and prime export corridors through the Suez Canal Economic Zone.
Key Report Takeaways
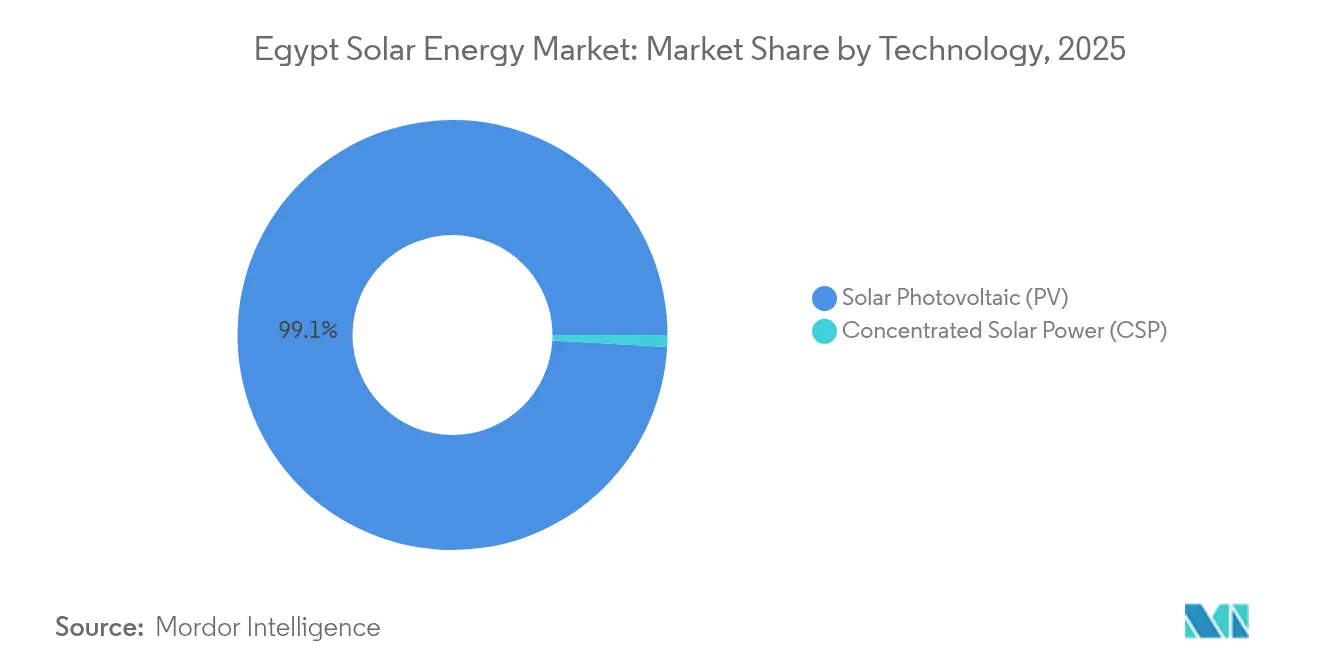
- By technology, solar photovoltaic (PV) led with 99.12% of Egypt's solar energy market share in 2025, while concentrated solar power (CSP) is projected to grow at a 62.9% CAGR through 2031.
- By grid type, on-grid systems held 97.15% share of the Egyptian solar energy market size in 2025, while off-grid solutions are forecast to expand at 26.4% CAGR through 2031.
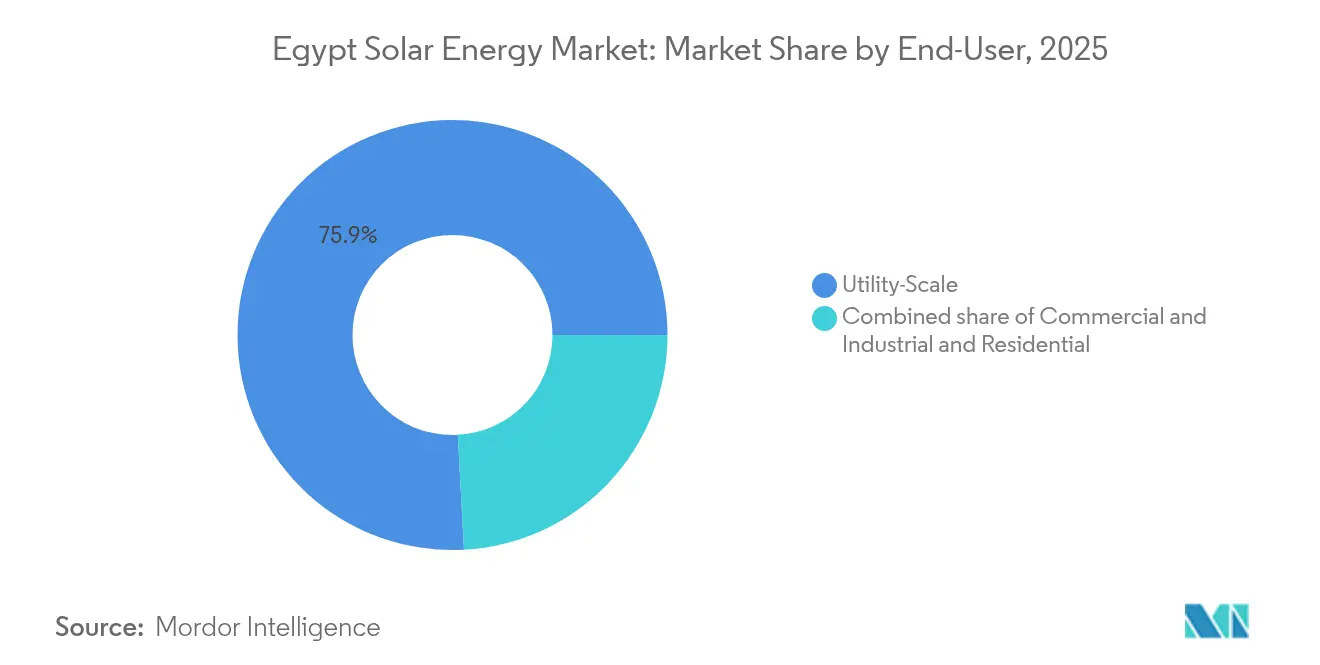
- By end-user, utility-scale plants accounted for 75.85% share of the Egyptian solar energy market size in 2025, and the commercial and industrial segment is advancing at a 28.2% CAGR to 2031.
Note: Market size and forecast figures in this report are generated using Mordor Intelligence’s proprietary estimation framework, updated with the latest available data and insights as of 2026.
Egypt Solar Energy Market Trends and Insights
Drivers Impact Analysis*
| Driver | (~) % Impact on CAGR Forecast | Geographic Relevance | Impact Timeline |
|---|---|---|---|
| Supportive government incentives & FIT revisions | +3.8% | National, especially Aswan, Benban, New Administrative Capital | Medium term (2 – 4 years) |
| High solar-irradiation levels across desert zones | +2.5% | Upper Egypt, Western Desert, Red Sea | Long term (≥ 4 years) |
| Rising international financing (IFC / EBRD / AIIB) | +4.2% | Nationwide utility-scale projects above 500 MW | Short term (≤ 2 years) |
| Green-hydrogen road-map boosting utility demand | +3.1% | Suez Canal Economic Zone, Gulf of Suez | Medium term (2 – 4 years) |
| Solar-powered desalination roll-outs in Red Sea | +1.6% | Red Sea, South Sinai, Marsa Alam | Medium term (2 – 4 years) |
| Agrivoltaics in desert reclamation projects | +1.2% | Western Desert, New Valley | Long term (≥ 4 years) |
| Source: Mordor Intelligence | |||
Supportive Government Incentives & FIT Revisions
Egypt’s recalibrated feed-in tariff (FIT) now balances developer margins with fiscal prudence, a shift amplified by the pledge to allocate 50% of public spending to green projects by FY 2025.[1]Egyptian Electricity Regulatory Agency, “Electricity Tariff Schedule 2025,” egyptera.org New FIT bands sit comfortably below the average commercial grid tariff of 233 Pt/kWh, yet still deliver sub-six-year paybacks for well-sited arrays in sun-rich desert zones. The NWFE programme has mobilised 4.2 GW of bankable solar capacity, signalling policy credibility. As subsidies for conventional power are phased down, C&I entities are accelerating rooftop and ground-mount procurements to lock in long-term cost certainty. These reforms collectively uplift the Egyptian solar energy market by widening the pool of investable projects and compressing financing spreads.
High Solar-Irradiation Levels Across Desert Zones
Irradiation above 2,200 kWh/m²/year in Upper Egypt delivers capacity factors that rival leading global solar regions, easing the levelised cost of electricity below USD 25/MWh for the largest sites.[2]U.S. Commercial Service, “Egypt Wind and Solar Atlas,” trade.govDesert land availability side-steps the use-conflict issues that slow projects elsewhere, enabling mega-complexes such as the Benban cluster to exploit one-stop grid corridors. Recent agrivoltaic trials show yield increases in tomato and wheat crops of 10–15% when partial shading is applied, confirming dual-use land efficiency. [3]Nature, “Agrivoltaics Improves Water-Use Efficiency in Arid Climates,” nature.com Coupling high-insulation deserts with major consumption hubs via upgraded 500 kV lines further elevates project bankability. Long-run, unencumbered solar potential sits at 52 GW, nearly 18× current capacity, providing an enormous runway for the Egyptian solar energy market.
Rising International Financing
The IFC’s record USD 605 million package, matched by parallel lines from the EBRD and AIIB, has materially lowered the weighted average cost of capital for recent bids.[4]International Finance Corporation, “IFC Invests USD 605 Million in Egypt’s Green Transition,” ifc.org Multilateral lenders are now co-financing battery storage and grid-strengthening components, cutting curtailment risk. Local-currency facilities worth USD 150 million introduced by the IFC shield developers from pound volatility, an innovation quickly replicated by Egyptian banks eager to deploy green credit quotas. Grant-funded technical assistance programmes boost tender design and environmental governance, accelerating project close rates. These trends feed directly into the capital-intensity reduction pivotal for the sustained growth of the Egyptian solar energy market.
Green-Hydrogen Roadmap Boosting Utility Demand
Egypt’s aspirational 5 million t/y green-hydrogen target implies roughly 55 GW of new renewable capacity, translating into a multi-gigawatt upside for solar developers. Early-stage memoranda with European offtakers lock in take-or-pay ammonia exports from 2027, giving solar pipelines clear long-term offtake. The Green Hydrogen Incentives Law grants customs-duty relief on electrolyser imports and fast-tracks land allocation around the Suez Canal Economic Zone. Portfolio developers such as ACWA Power have already structured hybrid 2 GW solar-wind-hydrogen complexes to leverage complementary load curves. Market observers expect at least 8 GW of hydrogen-linked PV to reach financial close by 2026, injecting a demand backstop that supports the Egyptian solar energy market curve.
Restraints Impact Analysis*
| Restraint | (~) % Impact on CAGR Forecast | Geographic Relevance | Impact Timeline |
|---|---|---|---|
| Growing wind share in Egypt's generation mix | -2.1% | Gulf of Suez, Ras Ghareb, Red Sea | Medium term (2 – 4 years) |
| FX volatility driving up imported module costs | -2.8% | National, acute for projects >60% imported content | Short term (≤ 2 years) |
| Grid-curtailment risks in Upper Egypt corridors | -1.9% | Aswan, Benban, Qena | Short term (≤ 2 years) |
| Heritage-site land-use restrictions | -0.7% | Giza, Luxor, Aswan | Long term (≥ 4 years) |
| Source: Mordor Intelligence | |||
Growing Wind Share in Egypt's Generation Mix
Ten-gigawatt wind concessions in the Gulf of Suez now absorb grid capacity once earmarked for solar, tightening tender volumes and raising bid competition. Capacity factors above 50% on the Red Sea coast help wind clear tariffs nearly USD 4/MWh lower than new PV at peak sunlight, skewing public-procurement preference. In auction rounds, wind has won two-thirds of awarded megawatts since 2024. While hybrid layouts exist, grid planners still schedule wind priority dispatch in coastal nodes, indirectly capping near-term additions to the Egyptian solar energy market.
FX Volatility Driving Up Imported Module Costs
A cumulative 600 bp policy-rate hike since March 2024 pushed the Egyptian pound into two-way swings exceeding 20%, inflating USD-denominated module contracts and triggering cost overruns on at least 0.7 GW of projects. Importers also face longer L/C approval queues, delaying delivery pipelines. Domestic capacity, led by an 8 GW factory in New Alamein, should supply the first modules in late 2026, but wafer inputs remain dollar-priced. Until local polysilicon output scales, foreign exchange swings may shave 2.1 percentage points from the forecast CAGR of the Egyptian solar energy market.
*Our forecasts treat driver/restraint impacts as directional, not additive. The impact forecasts reflect baseline growth, mix effects, and variable interactions.
Segment Analysis
By Technology: CSP Acceleration From Minimal Base
Photovoltaics commanded 99.12% of Egypt's solar energy market share in 2025, reflecting turnkey EPC prices below USD 900/kW for single-axis tracking systems, while CSP's negligible baseline supports a 62.9% CAGR yet leaves its absolute footprint small through 2031. Developers see value in CSPs' built-in thermal storage for hydrogen hubs, but capital outlays of USD 3,000–11,000/kW remain a barrier.
Thermal energy storage of 6-15 hours lets CSP dispatch at night and during early-morning industrial peaks, complementing PV's daytime production and potentially trimming battery needs. Still, without a mandated CSP quota or a hydrogen off-take guarantee, financiers continue to favor crystalline-silicon PV for near-term capacity additions.



By Grid Type: Off-Grid Gains Amid Transmission Delays
On-grid installations held 97.15% of the Egyptian solar energy market size in 2025, yet new curtailment penalties and a 12- to 18-month substation upgrade gap spur off-grid solutions that grow at a 26.4% CAGR over 2026-2031. Rural clinics, telecom towers, and desert resorts adopt containerized solar-plus-battery kits that compete favorably with diesel at delivered fuel prices above USD 0.90/liter.
March 2024 rules waiving grid-connection fees for 1–500 kW systems sliced up-front costs by EGP 5,000–15,000 and enabled pay-as-you-go financing by local micro-lenders. Scaling hinges on aggregating small systems into portfolios large enough to satisfy institutional investors seeking predictable returns.
By End-User: C&I Surge on P2P Framework
Utility-scale plants represented 75.85% of the Egyptian solar energy market size in 2025, yet commercial and industrial installations will compound at 28.2% annually as factories lock in 25-year PPAs that shield them from gas curtailments and carbon-border taxes. The 1.1 GW Scatec-Egypt Aluminium deal couples 200 MWh batteries to guarantee 24/7 delivery, signaling a pivot to hybrid designs.
Textile, ceramic, and food-processing SMEs follow suit under the GIZ Egypt In-PV program, chasing paybacks under five years by replacing diesel gensets. Residential solar remains niche because subsidized retail tariffs keep household payback times above 10 years.
Geography Analysis
Upper Egypt remains the epicentre of the Egyptian solar energy market, hosting more than 70 % of installed capacity and drawing a further 2 GW pipeline over the next five years. Average irradiation surpasses 2,200 kWh/m²/year, while transmission expansion, anchored by a new 500 kV Aswan-Sohag link, will raise export capacity to the Delta load centres by 35%. Nevertheless, congestion management protocols that cap hourly feeds above 80% of rated output could dampen near-term utilisation rates until a second circuit is commissioned in 2027.
The Red Sea corridor is fast becoming a niche hub for water-energy coupling. Pilot CSP-desalination projects targeting 110 million m³/yr of potable water dovetail with tourism operators seeking carbon-neutral branding. Complementary wind regimes on the same coast enable future hybrid layouts that stabilise supply for hydrogen electrolyser farms envisioned near Ain Sokhna. Importantly, transmission spurs from the Gulf of Suez are already hydrogen-ready, featuring 400 kV ratings and redundant earthing.
The Western Desert and the New Valley Governorate mark a frontier zone where agrivoltaics intersects with desert reclamation. Early-stage data show crop-yield boosts up to 15% and water savings of roughly 50% under raised PV structures. Government grants covering 25 % of capex for dual-use pilots are attracting local farming cooperatives, a foundational customer class for distributed developers. In tandem, New Alamein’s emerging solar-component cluster could shorten inland logistics by 400 km compared with Alexandria port deliveries, tightening the supply chain for projects across the Western Desert. Collectively, geographic diversification cushions the Egyptian solar energy market against single-region policy or grid shocks.
Regulatory Landscape
Egypts solar sector is governed by the Electricity Law No. 87 of 2015 and the Renewable Energy Law No. 203 of 2014, with the Ministry of Electricity and Renewable Energy (MERE) setting policy direction. EgyptERA (Egyptian Electric Utility and Consumer Protection Regulatory Agency) regulates licensing and grid connectivity, while NREA (New and Renewable Energy Authority) plays a central role in renewable land allocation and investor requirements for project development.
Implementation steps have widened routes to market beyond the traditional single-buyer model. In June 2025, Egypt granted its first licenses for private-to-private electricity contracts, enabling renewable producers to supply industrial consumers directly and creating new demand channels for on-grid and hybrid solar projects. For distributed and mid-scale systems, qualification and compliance requirements also tightened, including NREA updates in January 2025 for solar PV system companies up to 20 MW, and rules affecting projects above 500 kW under net-metering and self-consumption frameworks, which influence execution and cost structures for C&I developers.
Competitive Landscape
Strategic joint ventures dominate the competitive chessboard. BP and Masdar’s alliance with Hassan Allam and Infinity Power pools global balance sheets with local permitting acumen, positioning the consortium for hydrogen-linked solar deals exceeding 5 GW. EDF Renewables’ stake in KarmSolar grants EDF access to the fast-growing C&I niche, while injecting international governance standards into local operations. Multilateral banks’ appetite for scale tilts awards toward developers able to marshal ≥ 500 MW blocks, driving moderate consolidation within the Egyptian solar energy market.
Manufacturing localisation has emerged as a second contest front. EliTe Solar’s 8 GW module line and an adjacent USD 172 million silicon smelter promise domestic content ratios above 60% by 2027, a threshold that could unlock extra tariff premiums for qualifying projects. Rival plans tabled by China’s Jinko and the UAE’s AMEA include wafer-cutting and glass plants, signalling a race to anchor upstream value in Egypt. Over time, supply-chain proximity may shave 7-9% off total installed cost for compliant developers, tilting the cost curve in favour of local champions.
Technology differentiation now revolves around integrated storage and digital O&M. Scatec’s 1 GW Obelisk project features 200 MWh of battery storage plus AI-enabled performance analytics that predict soiling losses and automate cleaning schedules. Such innovations extend panel productivity by 3-4 % annually. Meanwhile, micro-inverter providers are courting the rooftop segment with 25-year warranties matched to evolving building-energy codes. Competitive intensity is not solely size-driven; agility in technology deployment and risk-management structures increasingly sets apart market leaders in the Egyptian solar energy market.
Egypt Solar Energy Industry Leaders
Abu Dhabi Future Energy Company PJSC (Masdar)
ACWA Power Company SJSC
Egyptian Electricity Holding Company
Scatec ASA
Infinity Power Holding
- *Disclaimer: Major Players sorted in no particular order

Market Opportunities and Future Outlook
A gap is emerging around utility-scale solar-plus-storage as Egypt shifts from energy-only PV additions toward dispatchable renewable capacity. In January 2026, the Cabinet signed an agreement with Scatec to develop the 1.7 GW Energy Valley solar project in Minya, alongside an agreement with Sungrow to establish a 10 GWh battery energy storage manufacturing facility in the Suez Canal Economic Zone, linking buildout plans with domestic storage supply. This direction is reinforced by project execution evidence: Scatec announced commercial operation of Phase 1 of the Obelisk project in February 2026 (561 MW solar PV paired with a 100 MW/200 MWh BESS), indicating faster delivery cycles for large hybrid plants.
Financing structure innovation is also an opportunity area as developers manage FX exposure and shorten procurement cycles. In June 2026, MERE referenced plans to develop 2,320 MW of solar and 2,000 MWh of BESS using local-currency financing, including a 2,000 MW solar/BESS scheme in Nagaa Hammadi and a 320 MW solar project in the Oases region, pointing to a stronger hybridization pipeline beyond Upper Egypt. Alongside this, the newly licensed private-to-private contracting channel, with first licenses granted in June 2025, expands the addressable market for C&I solar where industrial offtakers seek longer-tenor power price certainty and potential compliance alignment with export-related decarbonization requirements.
Recent Industry Developments
- July 2026: Emerging Africa & Asia Infrastructure Fund (EAAIF) announced a USD 30 million loan to Hassan Allam Utilities to support development of a 1,000 MW Minya solar PV project paired with a large-scale BESS (reported at 660 MWh). The facility adds another scaled funding line behind hybrid utility builds, supporting faster procurement and construction timelines for storage-coupled solar in Upper Egypt.
- June 2026: Sterling and Wilson Renewable Energy Limited, via its 50-50 joint venture with Hassan Allam Construction, secured a USD 560 million order for the 1,000 MWac West Minya Solar Power Project, including a 600 MWh BESS. The award underscores the move toward EPC packages that integrate storage as a standard feature and expands the pool of contractors with proven capability to deliver gigawatt-class hybrid plants in Egypt.
- February 2026: Scatec announced commercial operation of Phase 1 of the Obelisk solar-plus-storage project in Qena, commissioning 561 MW of solar PV together with a 100 MW/200 MWh BESS. Reaching this milestone in a 13-month build cycle strengthens the bankability of large hybrid configurations and provides an operational reference point for future storage-backed PPAs in Egypt.


Research Methodology Framework and Report Scope
Market Definition and Coverage
For this study, the Egypt solar energy market is defined as the installed solar power capacity base in the country, measured in gigawatts and tracked across operating and commissioned systems over time.
Scope exclusions: Revenue from equipment sales, EPC services, and power tariffs is not counted in the market size figure because the core unit tracked here is installed capacity.
Segmentation Overview
- By Technology
- Solar Photovoltaic (PV)
- Concentrated Solar Power (CSP)
- By Grid Type
- On-Grid
- Off-Grid
- By End-User
- Utility-Scale
- Commercial and Industrial (C&I)
- Residential
- By Component (Qualitative Analysis)
- Solar Modules/Panels
- Inverters (String, Central, Micro)
- Mounting and Tracking Systems
- Balance-of-System and Electricals
- Energy Storage and Hybrid Integration
Data Sources, Market Sizing, and Validation
Desk Research
Desk research began with public capacity and power sector context for Egypt, then it was narrowed to solar specific signals that can be verified year by year. We leaned on sources such as IRENA renewable capacity statistics, International Energy Agency (IEA) country electricity datasets, and World Bank energy indicators to anchor the long run time series. Policy and pipeline color was taken from official releases and project lists published by Egyptian authorities (such as the Ministry of Electricity and Renewable Energy and the regulator) and from utility and developer announcements carried in reputed press.
To reduce errors from double counting, we reviewed project commissioning news, tender awards, and grid connection updates, then compared them against capacity totals reported in public dashboards and annual summaries. Patent databases were referenced selectively to understand technology direction, although this mainly supports qualitative assumptions rather than the core sizing math. Where needed, we used paid subscriptions for company financials and intelligence and for import/export shipment level checks to sense module and inverter inflows that can support capacity buildout logic. The sources listed above are illustrative, and many other public and paid references were also used for data collection, cross checks, and clarification.
Primary Interviews and Surveys
Primary work was used to confirm how capacity is counted in practice in Egypt, especially around commissioning dates, partial energization, repowering, and hybrid plants where solar is only one part. We spoke with a mix of developers, EPC participants, IPPs, distributors, and independent experts, then cross checked inputs with lenders and advisors who track project delivery risk. Because this is a country market, interviews were centered on Egypt, with coverage across utility scale and commercial and residential demand pockets.
Distribution of primary research fieldwork respondents
| Company type | Respondent position |
|---|---|
| Top tier: 34% | CXOs: 19% |
| Mid tier: 47% | Functional/Unit leaders: 27% |
| Smaller Players: 19% | Managers: 54% |
Market-Sizing & Forecasting
Sizing was built using a top-down and bottom-up approach where national and sector solar capacity series were reconstructed from public renewable statistics, regulator and ministry disclosures, and tracked project commissioning updates. After the annual capacity base was set, selective bottom-up approximations were used to keep totals realistic, such as roll ups of announced project MW, channel checks on equipment availability, and sampled assumptions on typical build times for utility and distributed systems.
A few practical inputs shaped the model, including annual commissioned MW, grid connection readiness and curtailment signals, pipeline status by permitting and financial close, module and inverter import momentum, and changes in policy items like net metering rules and procurement targets. For forecasting, scenario analysis was used because delivery depends heavily on tender timing, financing conditions, and grid expansion, and these variables do not move in a straight line. Where project level information was incomplete, gaps were handled by applying conservative commissioning lags and dropout rates that were checked in interviews, then revised when evidence from recent project execution was stronger.
Data Validation & Update Cycle
Outputs were checked in several steps so the final capacity totals align with what independent signals suggest for the same period. We compared modeled additions against public commissioning announcements, policy target progress, and broad import and procurement activity, then investigated any year that looked too high or too low. A second analyst review was run on the assumptions that drive the biggest swings, such as commissioning lags, pipeline conversion, and the timing of grid readiness.
Reports are refreshed annually, and interim updates are made when a material tender round, a major commissioning wave, or a policy change shifts the outlook. Before delivery, we ran a final pass to ensure the latest public updates and primary feedback were reflected consistently across the history, the base year, and the forecast.
Mordor Intelligence's Egypt Solar Energy Market Sizing Compared With Other Published Estimates
Published market sizes for Egypt solar often look inconsistent because the underlying unit being measured is not the same, and the timing of what gets counted can also shift from one publication to another. Some sources talk in revenue, others in installed capacity, and some fold planned projects into the number even if they are not commissioned yet.
Equipment and EPC revenue sits outside Mordor Intelligence's scope here, so the market size is expressed as installed solar capacity in GW, which then makes it structurally different from value based estimates that use USD and broad spending assumptions. Gaps also come from how hybrid plants are treated, whether off-grid systems are captured, and how commissioning cutoffs are applied when a project is partially energized.
Benchmark comparison
| Source | Market Size | Gaps in Research Methodology |
|---|---|---|
| Mordor Intelligence | USD 3.59 B (2025) | |
| Regional Consultancy A | USD 3.60 B (2023) | Uses revenue sizing in USD and typically includes equipment, EPC, and installation value, which does not match a capacity only definition. The base year is different, so build cycles and pricing assumptions can shift the headline number. |
| Trade Journal B | USD 8.80 B (2031) | Reports a value forecast to 2031, which is driven by assumed capex and price trajectories and can include planned projects earlier than commissioning. Differences in inflation and exchange rate timing can widen the spread further. |
The table mainly shows a unit and scope mismatch rather than a simple disagreement on market direction. When capacity additions and commissioning timing are used as the core counting rule, the result stays traceable to project MW, grid connection signals, and pipeline conversion checks, which makes the estimate easier to reproduce and update.


Key Questions Answered in the Report
What is the current installed solar capacity in Egypt?
Operational capacity stood at 4.28 GW in 2026 and is forecast to reach 10.28 GW by 2031.
How fast is photovoltaic capacity expected to grow?
Aggregate capacity is projected to rise at a 19.18% CAGR from 2026 to 2031, underpinned by concessional finance and battery-hybrid tenders.
Which segment will grow fastest through 2031?
Commercial and industrial installations are set to expand at a 28.2% CAGR, driven by Egypt’s P2P power framework and battery-coupled PPAs.
What policies support distributed solar adoption?
The March 2024 abolition of net-metering consolidation charges and exemption of 1–500 kW systems from grid fees significantly lowered entry costs.
How does currency risk affect project economics?
A 38% pound devaluation in 2024 inflated imported equipment costs, prompting sponsors to localize module production and renegotiate tariffs.
Who are the leading developers in Egypt’s solar space?
ACWA Power, Masdar, Scatec, AMEA Power, and Infinity Power collectively control more than 60% of capacity under construction.
Page last updated on:




