Market Overview
| Study Period | 2021 - 2031 |
|---|---|
| Forecast Data Period | 2026 - 2031 |
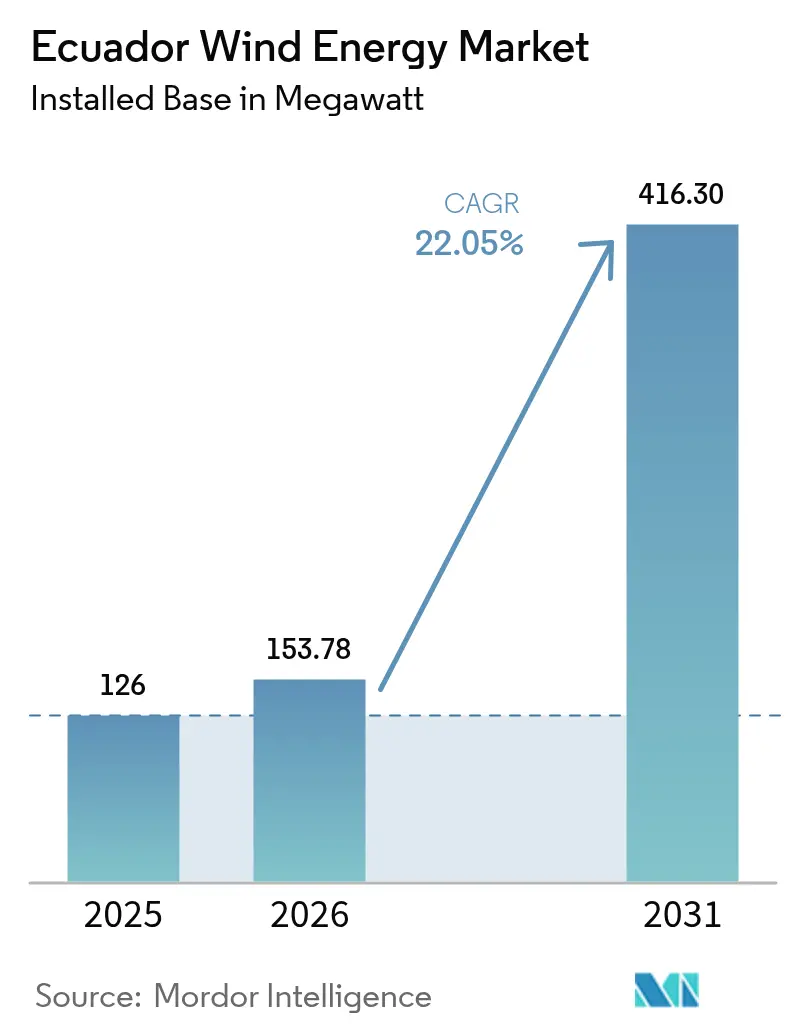
| Base Year Market Size (2025) | 126 megawatt |
| Market Volume (2026) | 153.78 megawatt |
| Market Volume (2031) | 416.3 megawatt |
| Growth Rate (2026 - 2031) | 22.05% CAGR |
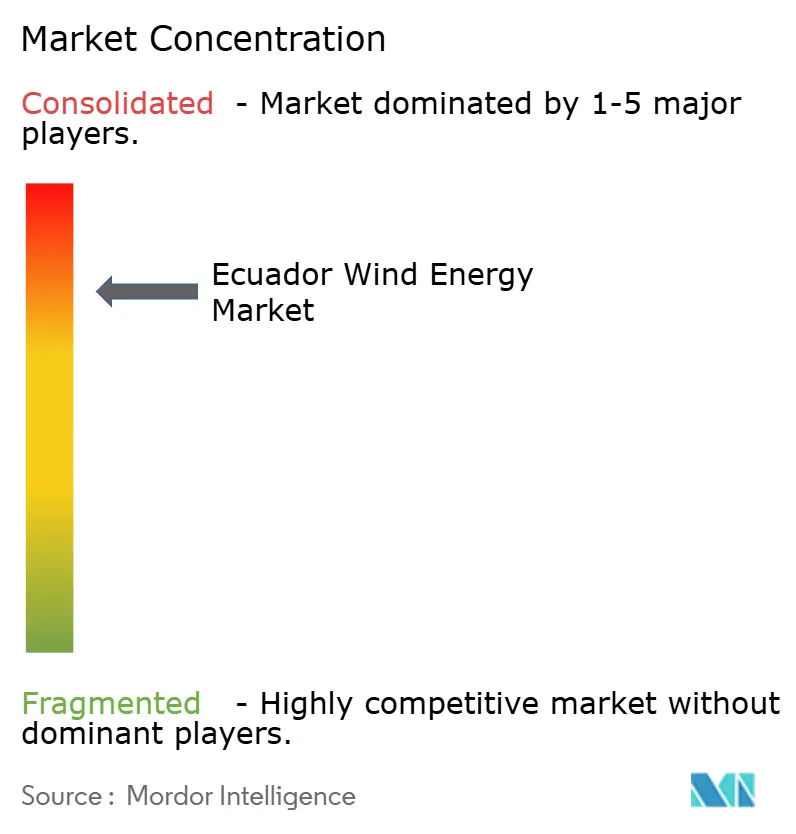
| Market Concentration | High |
Major Players *Disclaimer: Major Players sorted in no particular order Image © Mordor Intelligence. Reuse requires attribution under CC BY 4.0. | |
Ecuador Wind Energy Market Analysis by Mordor Intelligence
Ecuador Wind Energy Market size in 2026 is estimated at 153.78 megawatt, growing from 2025 value of 126 megawatt with 2031 projections showing 416.3 megawatt, growing at 22.05% CAGR over 2026-2031.
Growth is being propelled by the January 2024 Energy Competitiveness Law that lifted the private-project cap to 100 MW and extended generous feed-in tariffs through 2030, a policy combination that compresses development timelines and delivers bankable long-term offtake structures.[1]US Trade Administration, “Ecuador – Energy,” trade.gov Emergency procurement rounds launched during the 2023-2024 drought underscored the grid’s over-reliance on hydropower and opened a path for wind to diversify the generation mix. Grid-strengthening investments, multilateral credit guarantees, and accelerating turbine up-scaling toward 3-6 MW platforms are steadily lowering levelized costs, while state utility CELEC EP’s pivot to public-private partnerships is attracting foreign developers despite Ecuador’s shallow domestic capital markets. At the same time, community opposition around fishing-rights conflicts and transmission congestion in the Manabí–Santa Elena corridor remains a headwind that developers must navigate.
Key Report Takeaways
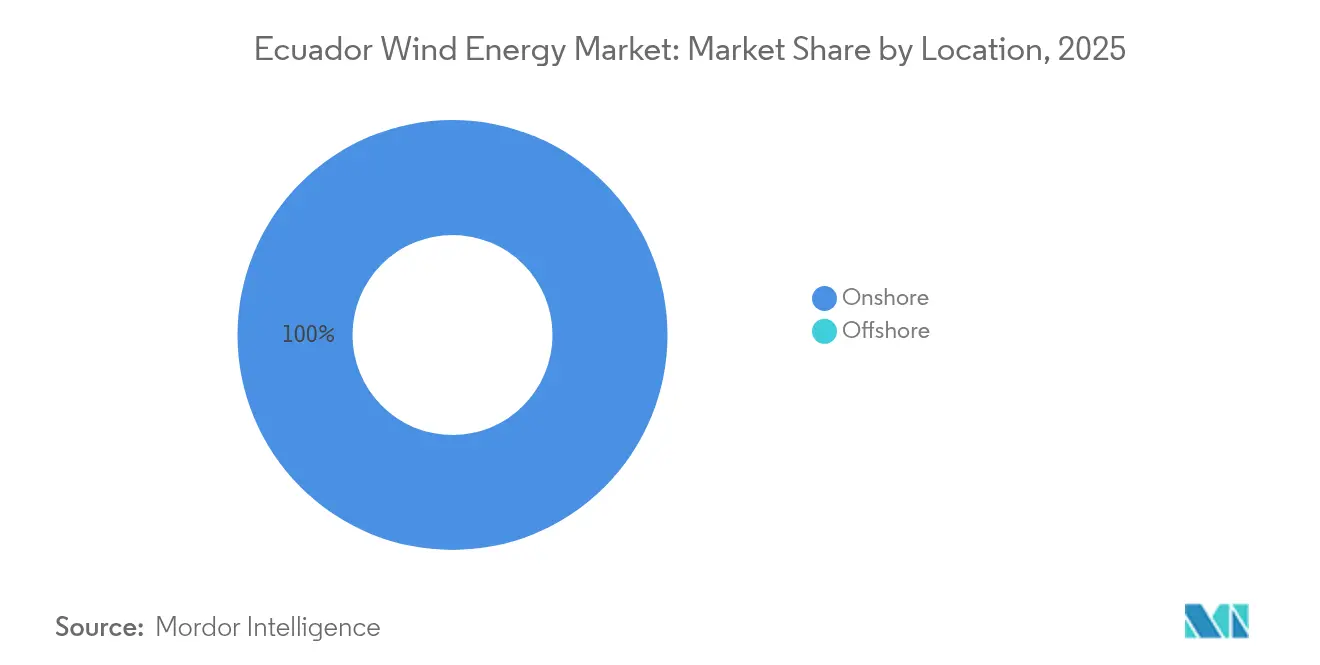
- By location, onshore installations represented 100.00% of capacity in 2025 and are advancing at a 22.03% CAGR through 2031.
- By turbine class, units rated up to 3 MW held 84.45% of Ecuador's wind energy market share in 2025, while the 3-6 MW segment is projected to expand at a 42.65% CAGR to 2031.
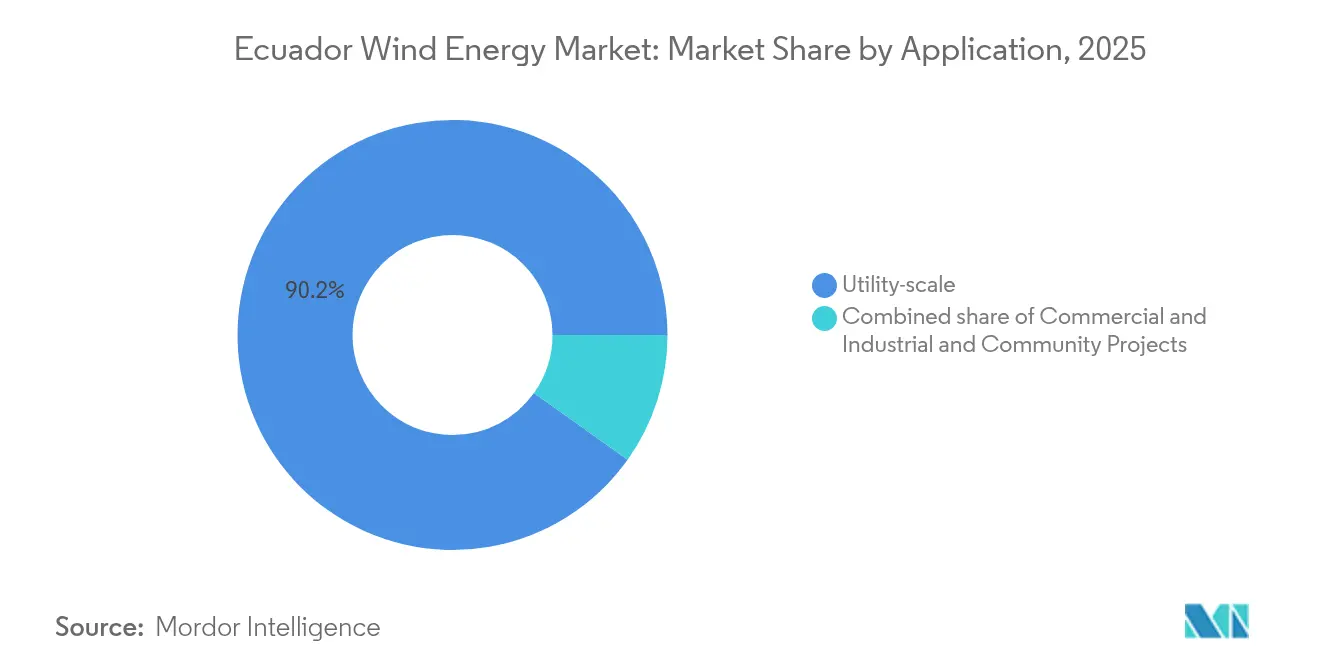
- By application, utility-scale projects commanded 90.15% of capacity in 2025 and are forecast to grow at 23.3% through 2031.
Note: Market size and forecast figures in this report are generated using Mordor Intelligence’s proprietary estimation framework, updated with the latest available data and insights as of 2026.
Ecuador Wind Energy Market Trends and Insights
Drivers Impact Analysis*
| Driver | (~) % Impact on CAGR Forecast | Geographic Relevance | Impact Timeline |
|---|---|---|---|
| Generous feed-in tariff extension through 2030 | +5.7% | National, with early gains in Loja, Manabí, Santa Elena | Medium term (2-4 years) |
| Accelerated grid-interconnection program for coastal provinces | +4.5% | Manabí, Santa Elena, Guayas coastal corridor | Short term (≤ 2 years) |
| Falling levelized cost of energy for ≥5 MW turbines | +4.1% | Global, direct pass-through to Ecuador project economics | Long term (≥ 4 years) |
| Strong multilateral climate-finance pipeline | +3.4% | National, IDB and World Bank priority provinces | Medium term (2-4 years) |
| Port of Posorja nacelle-assembly free-trade zone incentives | +2.5% | Guayas province, with national supply-chain spillover | Long term (≥ 4 years) |
| Offshore wind pre-feasibility data-sharing pact with Peru & Colombia | +1.2% | Pacific coastal waters, Manabí and Santa Elena offshore zones | Long term (≥ 4 years) |
| Source: Mordor Intelligence | |||
Generous Feed-in Tariff Extension Through 2030
The Energy Competitiveness Law locks in cost-reflective pricing for renewable generators to 2030 and raises the private-project size ceiling to 100 MW, allowing developers to avoid lengthy public tenders and secure bilateral power purchase agreements (PPAs) with mining and aquaculture offtakers.[2]US Trade Administration, “Ecuador – Energy,” trade.gov Fixed-price 25-year PPAs mitigate merchant-price risk in Ecuador’s shallow capital markets, unlocking the USD 500–700 million of private investment the World Bank expects will be needed to double non-hydro renewable capacity by 2028.[3]World Bank, “World Bank Approves $500 Million to Support Ecuador’s Energy Transition,” worldbank.org The Inter-American Development Bank (IDB) backs the tariff regime with a USD 77 million partial-credit guarantee that shields lenders from payment default, though credibility rests on the state’s ability to honor contracts after 500 MW of 2021 awards lapsed unsigned.[4]Inter-American Development Bank, “Partial Credit Guarantee for Non-Conventional Renewable Energy Projects,” iadb.org
Accelerated Grid-Interconnection Program for Coastal Provinces
CELEC EP earmarked USD 79 million in June 2025 to reinforce seven transmission projects that relieve the Manabí–Santa Elena bottleneck, currently curtailing wind dispatch during peak shrimp-farming demand. Complementing this, IDB Invest is financing a USD 56.5 million 500 kV Peru–Ecuador intertie slated for 2026 service, creating a southern export valve that reduces congestion risk. Because wind output peaks at dusk when hydropower reservoirs also flex, added transfer capacity is critical to integrate the forecast 279 MW of new wind by 2030.
Falling Levelized Cost of Energy for ≥5 MW Turbines
Global onshore wind LCOE averaged USD 0.033 kWh in 2023 after a 60% decline since 2010, driven by taller towers and longer blades that spread fixed costs across larger nameplates. In Latin America, costs remain modestly higher at USD 0.046 kWh, but Chinese original equipment manufacturers (OEMs) such as Goldwind and Mingyang price 5-6 MW platforms 15–20% below European competitors, improving project economics in Ecuador’s high-interest-rate environment. With diesel peakers topping USD 0.12 kWh during droughts, wind’s cost edge is material for a grid seeking to curb fuel-import exposure.
Strong Multilateral Climate-Finance Pipeline
IDB, World Bank, and the Development Bank of Latin America collectively commit more than USD 1 billion to Ecuador’s energy transition, supplying long-term debt that domestic banks cannot extend. The IDB partial-credit guarantee lets private lenders fund 10-15 year amortizations while offloading sovereign risk, replicating structures that underpinned USD 2–3 billion of renewable build-out in Colombia and Peru between 2020 and 2024.
Restraints Impact Analysis*
| Restraint | (~) % Impact on CAGR Forecast | Geographic Relevance | Impact Timeline |
|---|---|---|---|
| Shallow domestic capital markets and high financing costs | -2.7% | National, affecting all utility-scale projects | Medium term (2-4 years) |
| Limited transmission capacity in Manabí-Santa Elena corridor | -2.3% | Manabí, Santa Elena, Guayas coastal provinces | Short term (≤ 2 years) |
| Community opposition tied to coastal fishing-rights conflicts | -1.8% | Coastal provinces with artisanal fishing activity (Manabí, Santa Elena, Esmeraldas) | Medium term (2-4 years) |
| Slow permitting for avian-migration impact assessments | -1.5% | National, particularly biodiverse coastal and highland zones | Short term (≤ 2 years) |
| Source: Mordor Intelligence | |||
Shallow Domestic Capital Markets and High Financing Costs
Ecuadorian banks seldom lend beyond 10 years, forcing wind sponsors to raise 40–50% equity or seek offshore debt that carries currency-hedge costs despite dollarization. Sovereign risk perceptions widen spreads 200–300 basis points above regional averages, constraining financial close for utility-scale projects and capping the Ecuador wind energy market’s pace of build-out.
Limited Transmission Capacity in Manabí–Santa Elena Corridor
The coastal corridor operates near its thermal limit during shrimp-industry evening peaks, forcing curtailment or negative pricing for wind farms. CELEC EP’s seven-project reinforcement plan will unfold over 24–36 months, meaning congestion remains a short-term drag on the Ecuador wind energy market. Until the Peru–Ecuador 500 kV link relieves southbound flows in 2026, developers must assume higher curtailment risk in financial models.
*Our forecasts treat driver/restraint impacts as directional, not additive. The impact forecasts reflect baseline growth, mix effects, and variable interactions.
Segment Analysis
By Location: Onshore Monopoly Persists Through Forecast Horizon
Onshore projects accounted for 100.00% of 2025 capacity and will continue growing at 22.03% annually, keeping the Ecuador wind energy market squarely land-based through 2031. A tri-national offshore pre-feasibility pact with Peru and Colombia is collecting seabed data, yet floating foundations would carry 40–50% cost premiums and protract lead-times beyond 2032. Coastal onshore sites in Manabí and Santa Elena offer 7 m s-1 wind speeds at 80 m hub height and existing 230 kV substations, letting sponsors avoid submarine cables and expensive offshore logistics.
The Ecuador wind energy market size for onshore projects is projected to rise from 126 MW in 2025 to 416.3 MW in 2031 as permitting hurdles, not resource scarcity, set the cadence. Environmental baseline studies mandated under Ecuador’s Rights of Nature clause now extend impact-assessment timelines by 6–12 months, and recent referendums blocking extractive projects signal a politicized permitting environment that could lengthen schedules for wind farms near sensitive habitats.


By Turbine Capacity: Mid-Range Machines Capture Scale Shift
Turbines up to 3 MW represented 84.45% of the Ecuador wind energy market share in 2025, owing to legacy Villonaco units, yet the 3-6 MW class is growing 42.65% annually and will dominate utility-scale builds by 2031. Upscaling cuts balance-of-system costs 25–30% by slashing foundation counts, trenching, and O&M labor, advantages magnified in a capital-scarce market.
Ecuador wind energy market size for 3-6 MW turbines is forecast to eclipse the sub-3 MW fleet once 110 MW of Villonaco II & III capacity enters service after 2027. Above-6 MW machines remain improbable before 2030 because haul roads and cranes capable of lifting 100-ton nacelles are absent. The Port of Posorja free-trade zone could localize nacelle assembly, trimming logistics surcharges, but no OEM has yet committed capital.
By Application: Utility-Scale Projects Dominate Pipeline and Offtake
Utility-scale wind farms controlled 90.15% of installed capacity in 2025 and are set to increase at 23.3% annually, sustained by CELEC EP tenders and 25-year avoided-cost indexed PPAs that anchor bank financing. Net-metering gaps and the absence of community-ownership frameworks limit commercial-and-industrial (C&I) and cooperative penetration to under 10% of additions.
Ecuador's wind energy market size allocated to C&I users could improve if the 2024 draft net-billing regulation is enacted, letting surplus generation earn wholesale credits. Meanwhile, community projects under 10 MW are excluded from IDB guarantees, forcing higher equity shares that dilute returns. PPAs for utility-scale assets, therefore, remain the market's growth engine provided contract sanctity is upheld.
Geography Analysis
Wind capacity clusters in Loja’s Andean highlands and the Manabí–Santa Elena coastal belt, where trade winds average 7–8 m s-1 at 80 m. The coastal corridor should absorb 60–70% of new megawatts through 2031 due to substation proximity and co-location synergies with shrimp aquaculture off-takers. Yet congestion on the single-circuit line connecting both provinces caps dispatch until USD 79 million in scheduled upgrades are completed in 2027.
Loja, home to the pioneer 16.5 MW Villonaco wind farm, delivers high-elevation wind speeds but incurs 5–10% extra transport costs for 60-m blades over mountain passes. The province remains pivotal as Villonaco III proceeds, yet its 300 km distance from Guayaquil obliges long-haul transmission that elevates line-loss charges. The Peru–Ecuador 500 kV intertie landing near Loja will relieve those constraints by 2026, though hydro imports will compete for the same capacity.
Guayas province, anchored by the deep-water Port of Posorja, offers a manufacturing hub to cut Ecuador wind energy market logistics costs by 20–30% through in-country assembly. However, lacking domestic-content mandates in tenders diminishes OEM incentive to build locally. Draft 2024 regulations proposing 20–30% local-value thresholds face push-back from developers worried about cost inflation, leaving Guayas’ industrial promise unrealized.
Competitive Landscape
Ecuador’s wind segment is highly concentrated. State-owned CELEC EP controls the only operating project and the largest pipeline asset, wielding first-mover advantage and grid-connection leverage. To accelerate build-out, the utility approved regulations in July 2024 permitting associative processes, effectively opening the Ecuador wind energy market to public-private partnerships while retaining state oversight.
Foreign developers such as Neoen, Total Eren, and EDP Renováveis are pre-qualifying for the 200 MW Pimo tender, but weigh sovereign counterparty risk after 2021 awards lapsed unsigned. OEM rivalry centers on unit price and financing. Chinese suppliers Goldwind and Mingyang undercut Siemens Gamesa and Vestas by 15–20%, yet European firms maintain share through embedded service fleets familiar with IDB procurement requirements.
Supply-chain ethics emerged as a differentiator after an October 2024 investigation linked balsa-wood sourcing for turbine blades to illegal logging in Yasuní indigenous territories. OEMs with certified plantation supply showcase environmental compliance, positioning competitively for tenders that now score non-price sustainability criteria. Storage integrators are additional disruptors, bundling 2–4 h lithium-ion systems with wind to firm capacity at declining battery prices of USD 150–180 kWh, an attractive hedge against curtailment during coastal congestion.
Ecuador Wind Energy Industry Leaders
CELEC EP
Neoen SA
Siemens Gamesa Renewable Energy, S.A.
Xinjiang Goldwind Science & Technology Co. Ltd.
Vestas Wind Systems A/S
- *Disclaimer: Major Players sorted in no particular order

Recent Industry Developments
- June 2025: With a sovereign guarantee of US$77 million, the Inter-American Development Bank (IDB) is paving the way for increased private investment in Ecuador's renewable energy sector. This backing is set to bolster the development of more than 820 MW of fresh solar and wind capacity, spread across as many as 12 projects.
- October 2024: The National Assembly passed the Organic Law to Promote Private Initiative in Electricity Generation, granting 100% income-tax exemption for renewables and removing tender requirements for projects ≤100 MW.
- August 2024: Scala Data Centers invested in Serena Energia to secure wind power for hyperscale data-center operations.
- August 2024: Government’s 788 MW procurement round draws 142 proposals from 55 firms, reflecting developer appetite post-drought.


Ecuador Wind Energy Market Report Scope
The wind energy industry encompasses the development, manufacturing, installation, operation, and maintenance of systems that transform wind's kinetic energy into electricity. This sector covers all technologies, companies, infrastructures, and services facilitating electricity generation from both onshore and offshore wind turbines.
The wind energy market is segmented by location, turbine capacity, and application. By location, market is segmeneted into onshore and offshore, by turbine capacity is divided among Up to 3 MW, 3 to 6 MW, and Above 6 MW, and by application the market is segmented into Utility-scale, Commercial and Industrial, and Community Projects.
By Location
| Onshore |
| Offshore |
By Turbine Capacity
| Up to 3 MW |
| 3 to 6 MW |
| Above 6 MW |
By Application
| Utility-scale |
| Commercial and Industrial |
| Community Projects |
By Component (Qualitative Analysis)
| Nacelle/Turbine |
| Blade |
| Tower |
| Generator and Gearbox |
| Balance-of-System |
| By Location | Onshore |
| Offshore | |
| By Turbine Capacity | Up to 3 MW |
| 3 to 6 MW | |
| Above 6 MW | |
| By Application | Utility-scale |
| Commercial and Industrial | |
| Community Projects | |
| By Component (Qualitative Analysis) | Nacelle/Turbine |
| Blade | |
| Tower | |
| Generator and Gearbox | |
| Balance-of-System |


Key Questions Answered in the Report
How large is the Ecuador wind energy market today?
Installed capacity stood at 153.78 MW in 2026 and is set to reach 416.3 MW by 2031.
What CAGR is forecast for Ecuador’s wind build-out?
Capacity is projected to expand at 22.05% annually between 2026 and 2031.
Which province will add the most wind megawatts by 2031?
Manabí and Santa Elena together are expected to host 60–70% of new capacity once grid upgrades finish.
Who is the dominant player in Ecuador’s wind segment?
State-owned CELEC EP controls existing capacity and leads the largest pipeline projects.
What is the biggest barrier to wind investment in Ecuador?
High financing costs from shallow domestic capital markets remain the primary drag on project bankability.
How do larger 5–6 MW turbines affect project economics?
They cut balance-of-system costs by 25–30% versus older 2–3 MW units, sharply lowering levelized cost of energy.
Page last updated on:


