Market Overview
| Study Period | 2021 - 2031 |
|---|---|
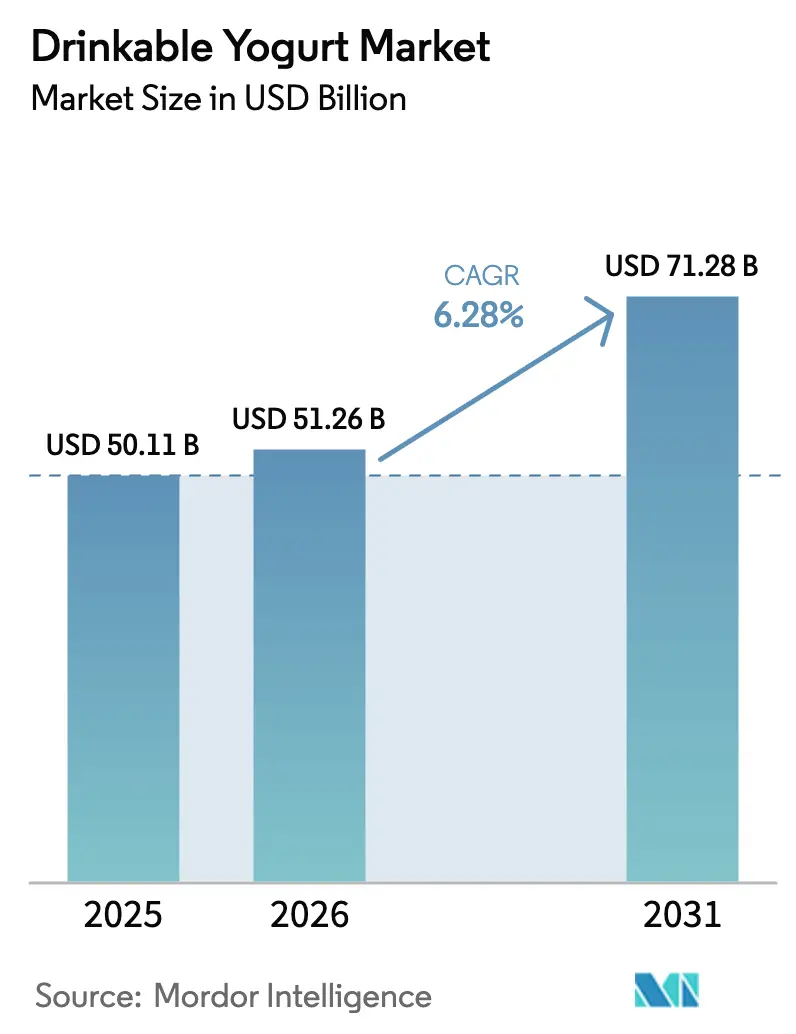
| Market Size (2026) | USD 51.26 Billion |
| Market Size (2031) | USD 71.28 Billion |
| Growth Rate (2026 - 2031) | 6.28% CAGR |
| Fastest Growing Market | Asia Pacific |
| Largest Market | Europe |
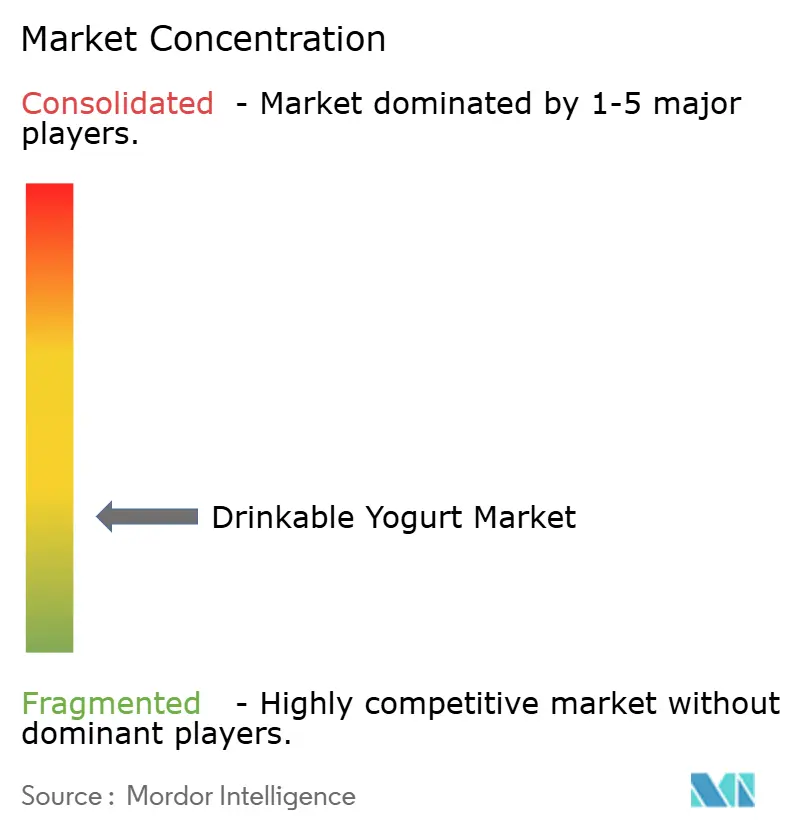
| Market Concentration | Low |
Major Players *Disclaimer: Major Players sorted in no particular order Image © Mordor Intelligence. Reuse requires attribution under CC BY 4.0. | |
Drinkable Yogurt Market Analysis by Mordor Intelligence
The drinkable yogurt market size is valued at USD 51.26 billion in 2026, growing from the 2025 value of USD 50.11 billion, and is forecast to climb to USD 71.28 billion by 2031, advancing at a 6.28% CAGR during the forecast period. This growth rests on rising health awareness, accelerating channel diversification, and steady product innovation. Premium, low-sugar formulations that comply with front-of-package rules are securing shelf visibility, while precision-fermented plant alternatives are redefining competitive boundaries. Large dairy conglomerates still dominate, yet regional specialists and start-ups are winning share by pairing strain-specific probiotics with sustainable packaging. Regulatory tightening in the United States, Canada, and the United Kingdom is forcing reformulation, but it is also reinforcing consumer trust, which lifts category velocity. Volatile raw-milk prices and tightening retailer margins have widened the gap between cost-efficient manufacturers and lagging incumbents, spurring plant-based entrants to leverage lower commodity exposure.
Key Report Takeaways
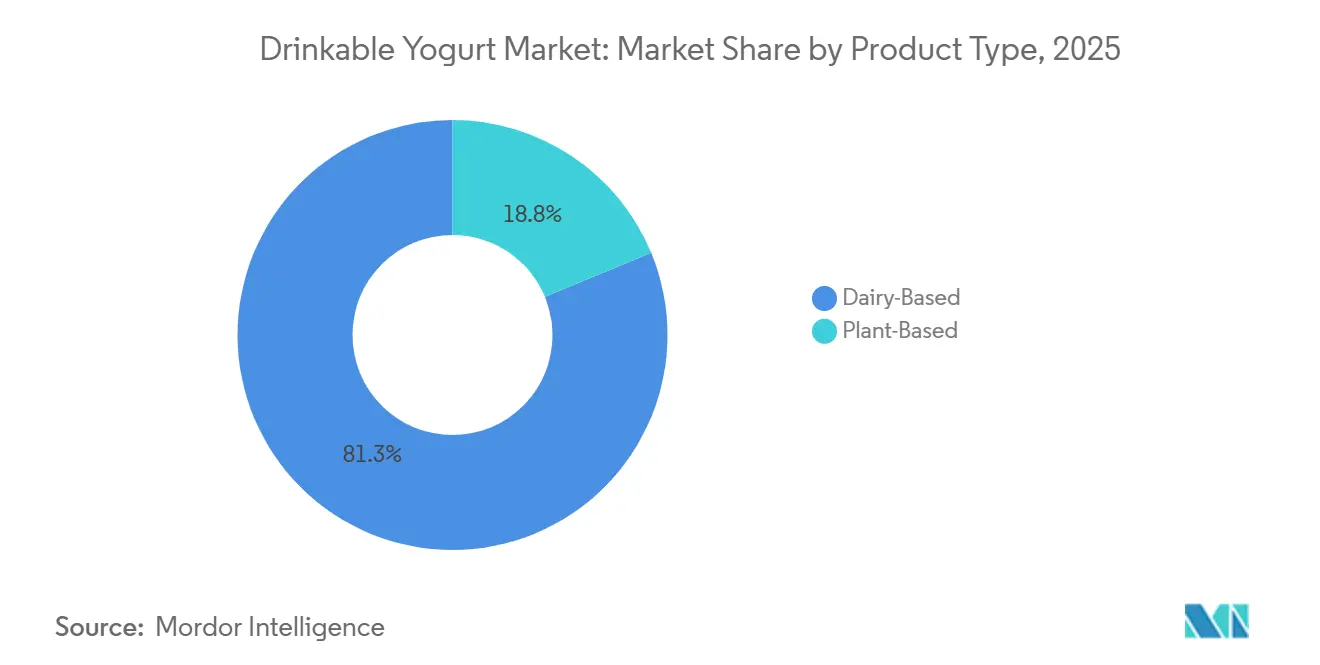
- By product type, Dairy-Based captured 81.25% of drinkable yogurt market share in 2025, while Plant-Based is forecast to expand at a 7.89% CAGR through 2031.
- By packaging type, PET Bottles led with 44.58% revenue share in 2025; Pouches & Sachets are projected to grow at an 8.28% CAGR to 2031.
- By distribution channel, Off-Trade accounted for 38.27% of the drinkable yogurt market size in 2025 and On-Trade is advancing at a 9.68% CAGR through 2031.
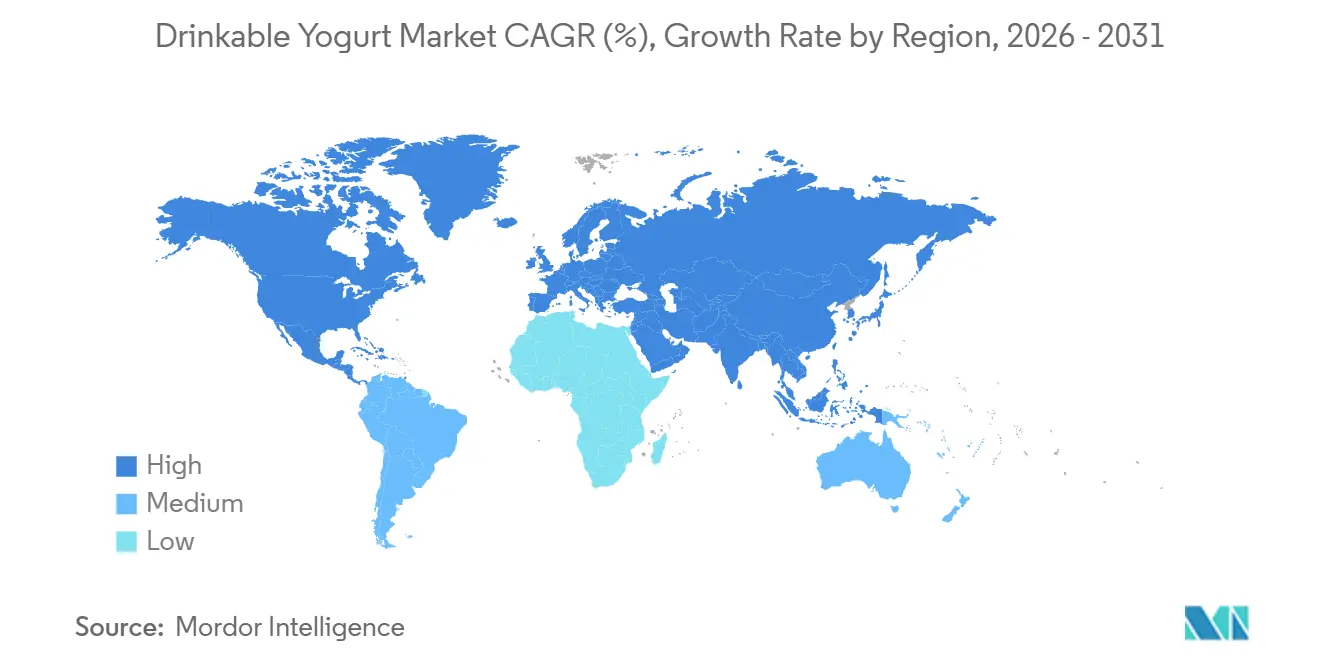
- By geography, Europe held 35.68% share of the drinkable yogurt market in 2025, whereas Asia-Pacific is rising at a 9.28% CAGR to 2031.
Note: Market size and forecast figures in this report are generated using Mordor Intelligence’s proprietary estimation framework, updated with the latest available data and insights as of January 2026.
Global Drinkable Yogurt Market Trends and Insights
Drivers Impact Analysis*
| Drivers | (~) % Impact on CAGR Forecasts | Geographic Relevance | Impact Timeline |
|---|---|---|---|
| Increasing demand for convenient, on-the-go probiotic snacks | +1.2% | Global, with highest intensity in North America and Asia-Pacific urban centers | Medium term (2-4 years) |
| Rising health consciousness drives preference for gut-friendly dairy | +1.5% | Global, particularly Europe and North America; emerging in Asia-Pacific | Long term (≥ 4 years) |
| Product innovations like plant-based, fortified, and flavored variants | +1.0% | North America, Europe, and Asia-Pacific; limited penetration in MEA and South America | Medium term (2-4 years) |
| Marketing emphasizing digestive and immune benefits | +0.8% | Global, with regulatory compliance influence in North America and Europe | Short term (≤ 2 years) |
| Aging population seeking nutrient-dense options for bone health and immunity support | +0.7% | Europe, North America, and Japan; moderate relevance in China | Long term (≥ 4 years) |
| Expansion of retail channels including supermarkets, convenience stores, and e-commerce | +0.9% | Global, with fastest adoption in Asia-Pacific and North America | Medium term (2-4 years) |
| Source: Mordor Intelligence | |||
Increasing Demand for Convenient, On-the-Go Probiotic Snacks
Urbanization and the demands of modern life are pushing consumers toward convenient, single-serve formats that provide functional nutrition without requiring preparation. This trend is particularly prominent in North America and the Asia-Pacific. In these regions, commute times in major metropolitan areas often exceed 60 minutes, and more than 30% of working adults are skipping breakfast. Drinkable yogurt, with its ambient or chilled shelf stability, resealable packaging, and portion control, aligns well with these changing consumer habits. Manufacturers are responding by introducing 200-milliliter to 250-milliliter bottles and pouches designed for easy cup-holder compatibility and one-handed use. The FDA's updated "healthy" claim criteria now allow yogurt products that meet strict added-sugar and saturated-fat limits to display this voluntary label[1]Source: U.S. Food and Drug Administration, “Use of the ‘Healthy’ Claim on Food Labeling,” fda.gov. This change motivates manufacturers to reformulate their offerings, focusing on nutrient-dense, low-sugar profiles that appeal to health-conscious consumers. E-commerce, which experienced significant growth in the food and beverage sector during the pandemic, continues to expand. Subscription models and same-day delivery services are simplifying impulse purchases. Enhancing the convenience narrative further, workplace wellness programs are stocking office refrigerators with probiotic snacks, creating a direct channel that bypasses traditional retail markups.
Rising Health Consciousness Drives Preference for Gut-Friendly Dairy
Growing consumer awareness of the gut microbiome's impact on immune function, mental health, and metabolic regulation has propelled probiotics from niche supplements to mainstream dietary essentials. Clinical evidence demonstrating the benefits of specific Lactobacillus and Bifidobacterium strains in reducing gastrointestinal distress and improving pathogen resistance is now widely shared through digital health platforms and influencer campaigns. According to the FAO's 2024 Agricultural Outlook, middle-income countries are driving the fastest growth in animal-source food consumption[2]Source: Food and Agriculture Organization, “FAO Dairy Price Index,” fao.org. Dairy products, particularly fermented variants, are capturing a significant share of increased spending as incomes rise. This trend is especially pronounced in China and India, where per-capita dairy consumption, though below global averages, is increasing rapidly. Regulatory frameworks are evolving: the FDA's guidance on qualified health claims for probiotics, while still restrictive, allows manufacturers to highlight digestive and immune benefits if supported by randomized controlled trials, avoiding enforcement actions. However, strain-specific efficacy remains a challenge. Generic "probiotic" labeling is losing credibility as informed consumers demand transparency on colony-forming units and strain identification, compelling brands to invest in clinical validation and third-party certification.
Product Innovations Like Plant-Based, Fortified, and Flavored Variants
Plant-based drinkable yogurts have become a mainstream category. Precision fermentation technologies now allow manufacturers to culture traditional yogurt bacteria on substrates such as oat, almond, and coconut. This advancement replicates the tangy mouthfeel and probiotic benefits of dairy while eliminating lactose and animal protein. Oat-based formulations are gaining popularity due to their neutral flavor, creamy texture, and lower environmental impact compared to almond or soy options. Brands are also focusing on fortification by incorporating vitamin D, calcium, and protein isolates to address micronutrient deficiencies identified in national dietary surveys, particularly among adolescents and older adults. The FDA's proposed front-of-package labeling, which requires interpretive descriptors for saturated fat, sodium, and added sugars, is driving innovation toward naturally sweetened alternatives using monk fruit, stevia, or date syrup. Flavor options are expanding beyond traditional vanilla and strawberry to include functional ingredients like turmeric, matcha, and adaptogens, catering to wellness-conscious millennials and Gen Z consumers. However, the regulatory environment remains inconsistent.
Marketing Emphasizing Digestive and Immune Benefits
Brands are moving away from broad wellness messaging toward specific, research-supported claims. Marketing now highlights the unique benefits of strains—such as Lactobacillus rhamnosus GG for preventing diarrhea and Bifidobacterium lactis for improving regularity. These campaigns emphasize clinical outcomes, including reduced gastrointestinal distress linked to antibiotics and improved vaccine responses. The FDA's updated guidelines on nutrient and health claims offer a compliance framework, but the requirements are stringent: manufacturers must provide evidence of significant effects through well-designed human trials and avoid overstating benefits. In the U.S., digital platforms are enhancing brand reach—Instagram and TikTok influencers collaborate with companies to create content showcasing daily consumption habits. Meanwhile, e-commerce platforms are integrating educational content on the gut-brain axis into product pages. Since the pandemic, the focus on immune support has intensified, with consumers increasingly turning to nutrition to prevent infections. However, regulatory scrutiny is increasing. For instance, the UK will enforce advertising restrictions on certain foods, including sweetened yogurts, starting October 2025. This regulation, regardless of probiotic content, requires brands to reformulate or risk exclusion from major advertising channels.
Restraint Impact Analysis*
| Restraints | (~) % Impact on CAGR Forecasts | Geographic Relevance | Impact Timeline |
|---|---|---|---|
| High sugar content in flavored variants faces regulatory scrutiny | -0.6% | North America, Europe, and select Asia-Pacific markets (Australia, Singapore) | Short term (≤ 2 years) |
| Intense competition from smoothies, kombucha, and plant milks | -0.8% | Global, with highest intensity in North America and Europe | Medium term (2-4 years) |
| Stringent labeling rules on health claims | -0.4% | North America and Europe; emerging in Asia-Pacific | Short term (≤ 2 years) |
| Premium pricing limits penetration in price-sensitive emerging markets | -0.5% | South America, Middle East, Africa, and rural Asia | Long term (≥ 4 years) |
| Source: Mordor Intelligence | |||
High Sugar Content in Flavored Variants Faces Regulatory Scrutiny
Public-health authorities are placing greater focus on flavored drinkable yogurts, which lead retail sales, due to concerns about added-sugar consumption. In August 2023, the FDA introduced a 50-gram Daily Value for added sugars and established labeling thresholds, classifying products with 2.5 grams or more per reference amount as contributing 5 percent or more of the Daily Value. Beginning January 2025, a front-of-package labeling proposal will require products exceeding 20 percent of the Daily Value for added sugars to display a "High" descriptor, which research shows can significantly reduce consumer purchase intent. Similarly, the UK's October 2025 advertising restrictions will prohibit "sweetened yoghurt and fromage frais" from broadcast and online advertising if they score one or more points under the Department of Health's nutrient profiling model. These regulatory measures are pressuring margins for traditional portfolios focused on fruit-on-the-bottom and dessert-style formulations. Reformulating these products is challenging: replacing sugar with non-nutritive sweeteners impacts mouthfeel and necessitates extensive consumer testing, while natural sweeteners like stevia and monk fruit incur higher ingredient costs. Brands that fail to adapt risk being de-listed by retailers, as grocers increasingly favor products that comply with evolving dietary guidelines. Manufacturers are responding in different ways: some are launching "no added sugar" product lines to mitigate regulatory risks, while others are shifting away from sweetened segments to concentrate on plain and lightly sweetened options that qualify for health claims.
Intense Competition from Smoothies, Kombucha, and Plant Milks
Drinkable yogurt competes with an expanding range of functional beverages for consumer attention and refrigerator space. Kombucha, promoted as a trendy probiotic option with lower sugar content and a fermentation-focused narrative, has established a premium position, particularly among health-conscious millennials. Similarly, plant-based milks—such as oat, almond, and soy—are gaining popularity not only among lactose-intolerant and vegan consumers but also among flexitarians, reducing dairy consumption for ethical or environmental reasons. Smoothies, available in ready-to-drink and made-to-order formats, offer higher fruit and vegetable content, attracting consumers who prioritize whole-food nutrition over isolated probiotics. The competition is further intensified by limited retail shelf space, as grocers allocate finite chilled linear footage, and category captains, typically large dairy conglomerates, aggressively protect their share. Drinkable yogurt differentiates itself through its probiotic functionality, protein content, and calcium fortification—benefits that kombucha and plant-based milks struggle to match without additional fortification.
*Our forecasts treat driver/restraint impacts as directional, not additive. The impact forecasts reflect baseline growth, mix effects, and variable interactions.
Segment Analysis
By Product Type: Plant Alternatives Accelerate Against Dairy incumbents
Dairy-Based lines captured 81.25% of the drinkable yogurt market share in 2025, reflecting entrenched consumer trust and optimized supply chains. Plant-Based offerings, however, are forecast to post a 7.89% CAGR as lactose intolerance, vegan lifestyles, and lower environmental footprints draw incremental shoppers. The drinkable yogurt market size for plant variants is set to widen sharply as precision-fermented fats replicate dairy mouthfeel, letting oat formulations bridge taste gaps. R&D alliances, such as Fonterra with Nourish Ingredients, lower the cost of replicating creamy texture, which supports margin parity with dairy. Plant SKUs now fortify with calcium and vitamin D to secure “healthy” claim compliance, improving shelf parity and clinical credibility.
Traditional dairy manufacturers counter by expanding Greek-style, high-protein drinkables that deliver 15–20 grams of protein per serving, appealing to sports-nutrition users. Repositioned full-fat lines satisfy keto followers, while low-fat options retain mainstream volume. Hybrid recipes blending milk with plant bases shorten ingredient lists and manage cost volatility. The drinkable yogurt industry thus sees a race between dairy incumbents leveraging culture expertise and plant innovators banking on sustainability narratives.


By Packaging Type: Pouches Gain Momentum as Sustainability Message Resonates
PET Bottles maintained 44.58% share in 2025, prized for resealability and clear walls that showcase texture. Yet Pouches & Sachets are growing at an 8.28% CAGR because they reduce plastic tonnage and suit grab-and-go use. The drinkable yogurt market size for pouches remains smaller than bottles, but is expanding in Asia’s commuter corridors. Recyclable board cartons, recently adopted by Yoplait, slash pack volume by 50% and use 78% plant-based materials, illustrating capex commitment toward retailer packaging mandates.
HDPE’s opacity guards light-sensitive probiotics, attracting premium SKUs that tout live-culture counts on front labels. Regulatory font-size rules under the U.S. proposal favor larger display panels, nudging brands toward mid-sized packs to retain visual clarity. Sustainability certifications are rapidly becoming table stakes, amplifying competitive advantage for vertically integrated firms with in-house packaging engineers.
By Distribution Channel: On-Trade Drives Premiumization and Brand Experience
Off-Trade still delivers 38.27% of category revenue, yet growth favors On-Trade, whose 9.68% CAGR through 2031 mirrors consumer willingness to pay for experiential consumption. Cafés integrate 250 milliliter yogurt shots into breakfast bundles, while quick-service restaurants upsell blend-to-order smoothie bases. The drinkable yogurt market size generated by On-Trade remains smaller than grocery volume, but its higher margins influence product design. Coca-Cola’s Fairlife performance confirmed that foodservice partners drive double-digit gains without promotional discounts.
Within Off-Trade, supermarkets face share leakage to convenience stores and e-commerce. Online subscription programs provide 15% discounts on recurring orders and feed shopper data back to manufacturers, enabling targeted promotions. Cold-chain costs, however, erode e-commerce margins, so only scale brands maintain profitable direct-to-consumer models. Manufacturers with limited budgets prioritize off-trade volume via distributors, then layer in selective On-Trade placements to build premium equity.

Geography Analysis
Europe retained 35.68% of the drinkable yogurt market revenue in 2025, buoyed by France, Germany, and the Netherlands, where yogurt consumption anchors breakfast routines. The EU’s positive list for health claims offers regulatory clarity yet imposes multi-year timelines that advantage incumbents with dedicated regulatory teams. UK advertising curbs on sweetened yogurts, effective October 2025, pressed brands to remove added sugars or risk media blackout. Eastern European countries, with rising disposable incomes and expanding cold chains, exhibit faster growth than Western peers, signaling a shift in regional volume mix.
Asia-Pacific is forecast to grow at 9.28% CAGR through 2031 on the back of rising incomes, urban migration, and nutrition-focused government programs. China’s 6.5% milk output rise in 2023 has fed domestic processing capacity, while India’s urban households now allocate nearly 40% of spending to food, elevating dairy uptake. Japan’s senior demographics support fortified drinkables targeting bone health, and Australia shows high per-capita volumes, albeit slower unit growth. Cold-chain infrastructure gaps persist in rural zones, yet are narrowing as public-private partnerships fund refrigerated logistics.
North America remains a consolidation arena. Chobani’s USD 1.2 billion Rome, New York plant underscores scale economics, whereas General Mills’ USD 2.1 billion yogurt divestiture signals strategic retreat from a low-margin category. Canada’s symbol mandate, kicking in January 2026, fuels a wave of lower-sugar reformulations[3]Source: Health Canada, “Front-of-Package Nutrition Symbol Labelling Guide,” canada.ca. South America and the Middle East-Africa trail on affordability and logistics, yet urban centers such as São Paulo and Riyadh show rising probiotic awareness, hinting at long-term upside once cold-chain coverage broadens.

Competitive Landscape
The drinkable yogurt market exhibits low concentration. Multinationals like Danone, Lactalis, Yili, and Mengniu leverage vertical integration to manage raw-milk volatility and streamline compliance. Danone’s expansion at Minster, Ohio, raises milk procurement by 60%, reflecting the capital intensity needed to sustain national distribution. Simultaneously, Danone purchased a majority stake in Kate Farms to bolster plant-based capabilities, indicating that scale players hedge dairy dependence.
Emerging disruptors center on sustainability and format innovation. Chobani secured USD 1 billion in equity to fund a 1.4 million-square-foot plant that will push beyond Greek yogurt into plant variants. Precision-fermentation alliances, such as Fonterra with Nourish Ingredients, allow incumbents to embed dairy-mimicking fats in plant bases, narrowing sensory gaps and safeguarding share. Digital direct-to-consumer models offer data-rich feedback loops, but high cold-chain costs mean only brands with premium price points and repeat-purchase logic, such as subscription bundles, sustain profitability.
Regulatory readiness increasingly separates winners. Early reformulators meet front-of-package limits and secure “healthy” icons, which win shelf facings and avoid advertising bans. Smaller labels without clinical data or capital for sugar reduction face de-listing or acquisition. Functional hybrids fortified with collagen or adaptogens remain a white space where nimble innovators can capture high-margin niches before conglomerates react.
Drinkable Yogurt Industry Leaders
Danone Groupe SA
Chobani, LLC.
Morinaga Nutritional Foods, Inc.
General Mills Inc.
Yakult Honsha Co., Ltd.
- *Disclaimer: Major Players sorted in no particular order

Recent Industry Developments
- August 2025: Danone North America introduced Oikos Fusion, a cultured dairy drink targeting GLP-1 medication users like those on Ozempic, to support muscle retention during weight loss. Each 7-oz lactose-free bottle delivers 23g complete protein via whey/leucine blend, 5g prebiotic fiber, vitamin D, B3, and B12, available in strawberry, mixed berry, and vanilla flavors
- November 2024: LALA U.S. has introduced LALA Gold, a premium high-protein yogurt line available in drinkable (10 oz) and spoonable (5.3 oz) formats, targeting health-conscious consumers with no added sugar and real fruit flavors. Drinkable servings deliver 25g protein and 6g fiber.
- October 2024: Chobani introduced its Chobani High Protein range, featuring Greek yogurt cups with 20g protein and drinks offering 15g, 20g, or 30g protein per serving—all lactose-free, no added sugar, and made with natural ingredients and real fruit.
- July 2024: Morinaga Nutritional Foods Vietnam JSC launched Morinaga Zero Fat Drink Yogurt. Available in Less Sugar and Less Sugar Strawberry flavors, the product uses Japanese fermentation technology for a refreshing taste with no fat, low calories, and 10 billion LAC-Shield® probiotics per serving.


Global Drinkable Yogurt Market Report Scope
The global drinkable yogurt market has been segmented by category into dairy-based and non-dairy based; by type into plain and flavored yogurt; and by distribution into hypermarket/supermarket, convenience stores, specialty stores, online channel and others. Also, the study provides an analysis of the drinkable yogurtmarket in the emerging and established markets across the globe, including North America, Europe, Asia-Pacific, South America, and Middle East & Africa.
By Product Type
| Dairy-Based Drinkable Yogurt |
| Plant-Based Drinkable Yogurt |
By Packaging Type
| PET Bottles |
| HDPE Bottles |
| Cartons |
| Pouches and Sachets |
By Distribution Channel
| On-Trade | |
| Off-Trade | Supermarkets and Hypermarkets |
| Convenience and Drug Stores | |
| Online Retail Channels | |
| Other Channels |
By Geography
| North America | United States |
| Canada | |
| Mexico | |
| Rest of North America | |
| Europe | Germany |
| United Kingdom | |
| France | |
| Italy | |
| Spain | |
| Russia | |
| Netherlands | |
| Belgium | |
| Poland | |
| Rest of Europe | |
| Asia-Pacific | India |
| China | |
| Japan | |
| Australia | |
| South Korea | |
| Rest of Asia-Pacific | |
| South America | Brazil |
| Argentina | |
| Rest of South America | |
| Middle East and Africa | South Africa |
| Saudi Arabia | |
| Rest of Middle East and Africa |
| By Product Type | Dairy-Based Drinkable Yogurt | |
| Plant-Based Drinkable Yogurt | ||
| By Packaging Type | PET Bottles | |
| HDPE Bottles | ||
| Cartons | ||
| Pouches and Sachets | ||
| By Distribution Channel | On-Trade | |
| Off-Trade | Supermarkets and Hypermarkets | |
| Convenience and Drug Stores | ||
| Online Retail Channels | ||
| Other Channels | ||
| By Geography | North America | United States |
| Canada | ||
| Mexico | ||
| Rest of North America | ||
| Europe | Germany | |
| United Kingdom | ||
| France | ||
| Italy | ||
| Spain | ||
| Russia | ||
| Netherlands | ||
| Belgium | ||
| Poland | ||
| Rest of Europe | ||
| Asia-Pacific | India | |
| China | ||
| Japan | ||
| Australia | ||
| South Korea | ||
| Rest of Asia-Pacific | ||
| South America | Brazil | |
| Argentina | ||
| Rest of South America | ||
| Middle East and Africa | South Africa | |
| Saudi Arabia | ||
| Rest of Middle East and Africa | ||


Key Questions Answered in the Report
What is the projected value of the drinkable yogurt market by 2031?
The category is expected to reach USD 71.28 billion by 2031 at a 6.28% CAGR.
Which segment of drinkable yogurt holds the largest 2025 market share?
Dairy-Based formulations led with 81.25% of drinkable yogurt market share in 2025.
Which packaging format will grow fastest through 2031?
Pouches & Sachets are forecast to register the highest CAGR at 8.28%.
Why is Asia-Pacific considered the growth engine for drinkable yogurt?
Rising disposable incomes, urbanization, and nutrition programs push Asia-Pacific to a 9.28% CAGR.
Page last updated on:


