
Dedicated Contract Carriage Market Size and Share
Market Overview
| Study Period | 2020 - 2031 |
|---|---|
| Market Size (2026) | USD 102.42 Billion |
| Market Size (2031) | USD 138.62 Billion |
| Growth Rate (2026 - 2031) | 6.24 % |
| Fastest Growing Market | Asia-Pacific |
| Largest Market | North America |
| Market Concentration | Medium |
Major Players *Disclaimer: Major Players sorted in no particular order Image © Mordor Intelligence. Reuse requires attribution under CC BY 4.0. | |
Dedicated Contract Carriage Market Analysis by Mordor Intelligence
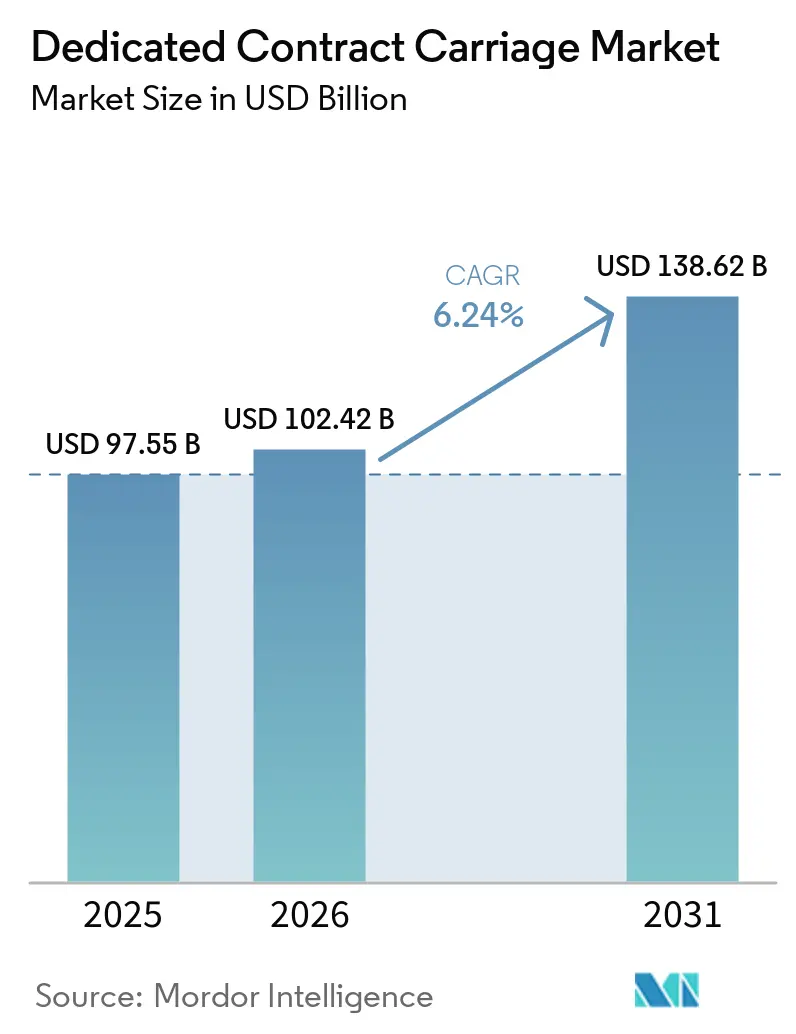
The dedicated contract carriage market size was valued at USD 97.55 billion in 2025, and is estimated to grow from USD 102.42 billion in 2026 to reach USD 138.62 billion by 2031 at a CAGR of 6.24% from 2026 to 2031.
The dedicated contract carriage market is growing as shippers move driver management, equipment financing, and compliance responsibilities to specialized providers. This shift reduces exposure to spot-rate movements and changes private-fleet costs into contracted service costs. Multi-year agreements have remained relevant during softer freight conditions, which indicates that many outsourcing decisions reflect operating requirements rather than short-term freight cycles. Providers are responding with dedicated capacity, managed equipment, compliance support, and technology that gives shippers more control over scheduled freight movements. The dedicated contract carriage market also gives providers opportunities in recurring freight lanes where reliable service and predictable capacity matter more than transactional pricing.
Key Report Takeaways
- By vehicle type, dry van held 37.63% of the dedicated contract carriage market share in 2025, while specialized and heavy-haul equipment recorded the highest projected CAGR at 8.19% through 2031.
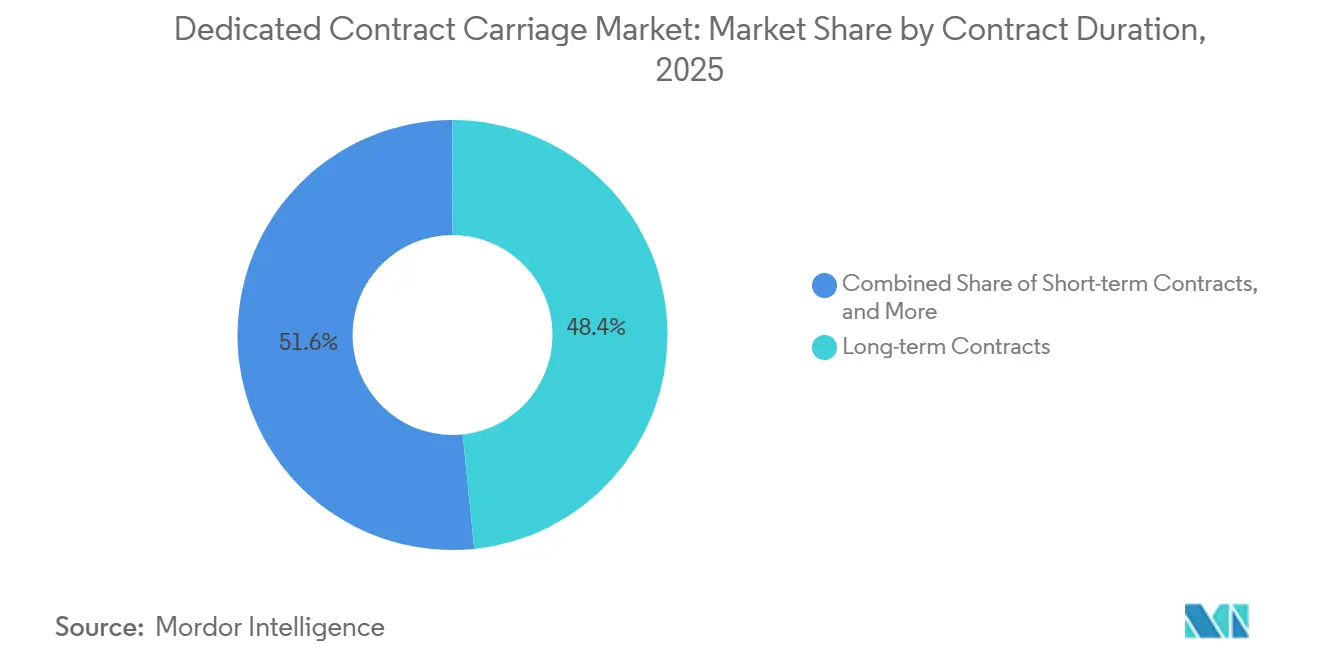
- By contract duration, long-term contracts exceeding 3 years held 48.38% of the dedicated contract carriage market share in 2025, while medium-term contracts recorded the highest projected CAGR at 7.89% through 2031.
- By customer size, large enterprises accounted for 51.90% of the dedicated contract carriage market size in 2025, while SMEs recorded the highest projected CAGR at 7.79% through 2031.
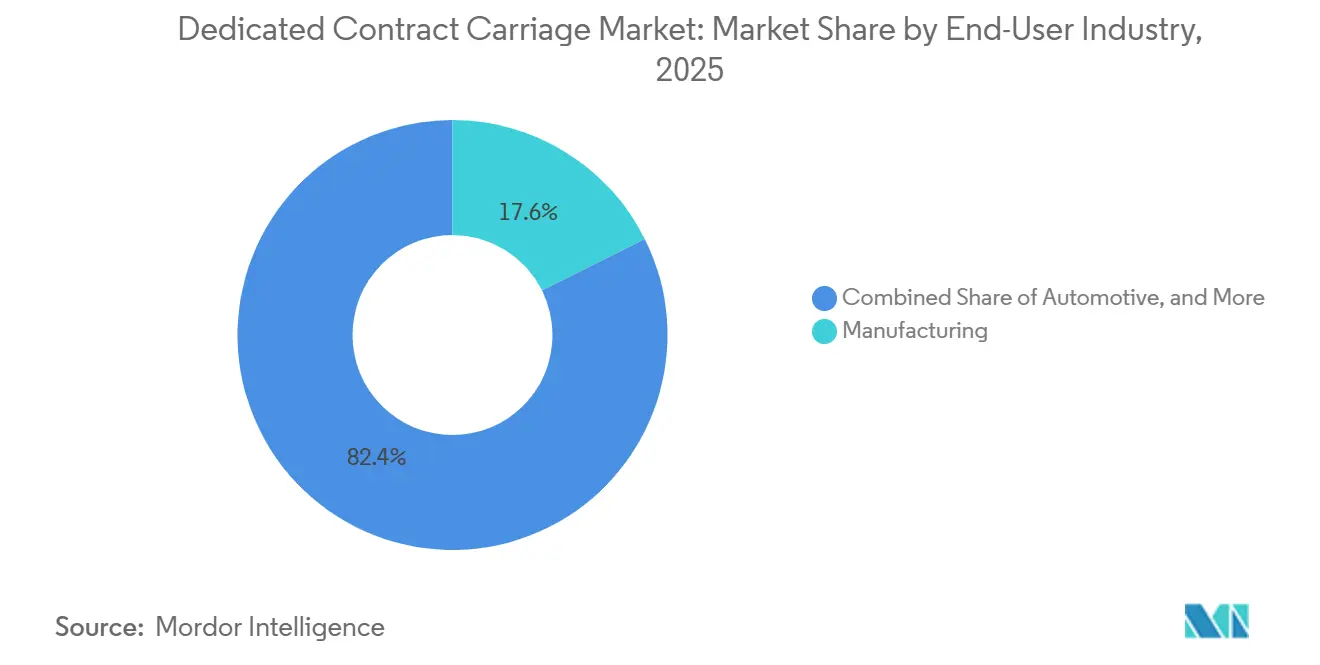
- By end-use industry, manufacturing accounted for 17.63% of the dedicated contract carriage market size in 2025, while retail and e-commerce recorded the highest projected CAGR at 8.24% through 2031.
- By geography, North America accounted for 31.29% of the dedicated contract carriage market share in 2025, while Asia-Pacific recorded the highest projected CAGR at 8.10% through 2031.
Note: Market size and forecast figures in this report are generated using Mordor Intelligence’s proprietary estimation framework, updated with the latest available data and insights as of January 2026.
Global Dedicated Contract Carriage Market Trends and Insights
Drivers Impact Analysis*
| Driver | (~) % Impact on CAGR Forecast | Geographic Relevance | Impact Timeline |
|---|---|---|---|
| E-commerce and Omnichannel Delivery Complexity | +1.5% | Global, strongest in North America and Asia-Pacific | Short-term (≤ 2 years) |
| Outsourcing of Private Fleets to Release Capital and Transfer Risk | +1.2% | North America and Europe | Medium-term (2–4 years) |
| Capacity Assurance Amid Driver Shortages and Carrier Exits | +1.0% | North America, spill-over to Western Europe | Short-term (≤ 2 years) |
| Compliance-Cost Transfer Through Professionally Managed Fleets | +0.8% | North America (California core); EU and Canada with secondary gains | Medium-term (2–4 years) |
| Fleet Electrification and Low-Emission Equipment as a Managed-Service Decision | +0.7% | APAC core, North America, EU | Long-term (≥ 4 years) |
| Account-Level Data Visibility and Route Optimization | +0.6% | Global | Medium-term (2–4 years) |
| Source: Mordor Intelligence | |||
E-commerce and Omnichannel Delivery Complexity
E-commerce has increased the frequency, speed, and dispersion of freight movements in the dedicated contract carriage market. Retailers use guaranteed-volume arrangements on city-to-city and ZIP-code lanes to manage delivery commitments across the year. These arrangements support networks that connect distribution centers, cross-docks, and urban micro-hubs in structured circuits. Dedicated providers can design those circuits around repeat freight flows, while ad hoc carrier capacity is less suited to recurring delivery schedules.[1]This operating environment supports the dedicated contract carriage market, where omnichannel fulfillment needs reliable equipment and controlled delivery windows for customers.
Outsourcing Private Fleets to Release Capital and Transfer Risk
The dedicated contract carriage market offers a route for shippers to move fleet ownership responsibilities to a transportation provider. ATRI reported an operating-cost benchmark of USD 2.336 per mile in 2025, with labor, insurance, and maintenance contributing to fleet costs[2]. Dedicated arrangements can transfer residual-value risk, liability exposure, equipment management, and driver administration to the provider. Such agreements can also include volume commitments, cost pass-through terms, and multi-year durations that give both parties a clearer operating framework. Food and beverage shippers face additional documentation and temperature-control responsibilities under the FDA sanitary transportation rule. These compliance demands make the dedicated contract carriage market relevant for companies that lack in-house cold-chain expertise.
Capacity Assurance Amid Driver Shortages and Carrier Exits
Driver availability is a central operating issue for the dedicated contract carriage market. The American Trucking Associations identified a driver shortfall of 80,000 positions in May 2026. Tighter CDL enforcement and English-language proficiency requirements for non-domiciled holders could further narrow the available driver pool. A tight driver supply can lead to rejected tenders and missed service windows when freight demand rises. Dedicated providers recruit, train, and retain drivers for defined customer lanes, which can improve consistency for recurring operations. The dedicated contract carriage market, therefore, addresses capacity risk through planned staffing rather than reliance on spot-market availability.
Fleet Electrification and Low-Emission Equipment as a Managed-Service Decision
Fleet electrification is adding a new service requirement to the dedicated contract carriage market. California operators with 50 or more medium- and heavy-duty trucks are required to file annual fleet inventories and zero-emission vehicle procurement plans under the Advanced Clean Trucks framework[3]. The reporting requirement became available in March 2026 and created work that fleet managers could perform across several accounts. FMCSA electronic driver vehicle inspection reporting requirements for electric trucks also took effect in March 2026, under 49 CFR 396. Providers can spread the operational work of charging, inspections, and battery-related asset management across their customer base. This makes the dedicated contract carriage market a practical option for shippers seeking lower-emission equipment without taking direct residual-value risk on developing vehicle technology.
Restraints Impact Analysis*
| Restraint | (~) % Impact on CAGR Forecast | Geographic Relevance | Impact Timeline |
|---|---|---|---|
| Multi-year Contract Inflexibility Under Volume Volatility | -0.7% | Global, concentrated in North America and Europe | Medium-term (2–4 years) |
| Driver Recruitment, Retention, and Wage Pressure | -0.6% | North America and Western Europe | Short-term (≤ 2 years) |
| Equipment Availability, Financing Costs, and Charging Infrastructure Constraints | -0.5% | Global, most acute in emerging APAC markets | Long-term (≥ 4 years) |
| Customer Concentration and Account-Transition Risk | -0.4% | North America, with secondary effects in Europe | Medium-term (2–4 years) |
| Source: Mordor Intelligence | |||
Multi-year Contract Inflexibility Under Volume Volatility
The dedicated contract carriage market can create challenges when actual freight volumes fall below the fleet size in a multi-year agreement. A 3-to-5-year arrangement priced on projected truckload counts leaves both parties exposed when production, replenishment, or import patterns change. Manufacturing output declines and disruptions in trade patterns can make fixed capacity harder to use fully. Providers are responding with flex-fleet provisions and volume-band pricing in new agreements. These options improve operating flexibility but can reduce the cost certainty that attracted the shipper to outsourcing. Customer concentration adds another concern because a single contract change can alter a provider’s fixed-cost base and affect its ability to grow.
Driver Recruitment, Retention, and Wage Pressure
Driver pay and retention costs create continuing pressure in the dedicated contract carriage market. ATRI’s 2025 cost data placed labor as the largest component of the USD 2.336 per-mile operating benchmark[4]. Liability costs also increased as trucking-related verdicts exceeded USD 80 million in mid-2026. Providers incorporate higher labor and insurance costs into contract pricing, which can raise renewal costs for shippers. Predictable schedules, regular home time, and structured performance programs can reduce turnover compared with long-haul truckload operations. These practices give dedicated providers a retention advantage, although higher recruitment costs still affect contract pricing.
*Our forecasts treat driver/restraint impacts as directional, not additive. The impact forecasts reflect baseline growth, mix effects, and variable interactions.
Segment Analysis
By Vehicle Type: Dry Van Retains Broad Freight Coverage While Specialized Equipment Gains Demand
Dry van held 37.63% of the share of the dedicated contract carriage market in 2025. Its position reflects wide compatibility with general merchandise freight for retail, manufacturing, and consumer goods customers. Fixed-lane dedicated networks can use dry van equipment efficiently where freight volumes are regular. Refrigerated and frozen equipment supports temperature-controlled food and grocery movements that are subject to the FDA sanitary transportation rule. This equipment is relevant for operators who need continuous temperature documentation and do not have in-house cold-chain capabilities.
Specialized and heavy-haul equipment registered at an 8.19% CAGR through 2031 within the dedicated contract carriage market. Renewable-energy infrastructure, semiconductor fabrication construction, and defense-related freight require engineered haul plans and permit coordination. These requirements favor contract capacity because specialized equipment is not consistently available in the spot market. Flatbed and step-deck equipment serve construction materials and oversized industrial loads when project delivery schedules are fixed. Tanker and bulk operations support energy, chemical, and agricultural freight, and their safety certifications make provider changes costly. State routing rules, escort requirements, and oversize permits add another reason for shippers to use experienced dedicated providers.
By Contract Duration: Long-term Agreements Lead, While Medium-term Commitments Increase
Long-term contracts exceeding 3 years commanded 48.38% of the dedicated contract carriage market size in 2025. Their role expanded during the freight downturn because customers value forward rate and capacity arrangements when spot rates rise. This recorded a 21% increase in dry van spot rates from March 2025 through mid-2026. Long-term arrangements also require providers to assess shipper credit quality, lane stability, and projected freight density. This due diligence helps providers allocate drivers and equipment to accounts with recurring demand.
Medium-term contracts are forecast to expand at an 7.89% CAGR through 2031. They offer an intermediate choice for organizations that are reducing their dependence on spot capacity before committing to longer agreements. Medium-term arrangements also allow a provider and customer to test operating fit before allocating more capital to the account. Short-term contracts of up to 1 year remain useful for seasonal operations and the 90-to-120-day implementation period for a new dedicated solution. However, these contracts offer less security for a carrier deciding whether to assign equipment to a customer. This contract mix keeps the dedicated contract carriage market responsive to both stable and changing shipper requirements.
By Customer Size: Large Enterprises Lead While SMEs Gain Access to Flexible Models
Large enterprises accounted for 51.90% of the dedicated contract carriage market share in 2025. These companies often have the freight density and lane regularity needed to keep a dedicated fleet fully utilized. Consistent volumes help providers recover driver wages, equipment depreciation, and insurance across repeat routes. Mid-sized companies often use dedicated arrangements on predictable lanes while keeping common-carrier capacity for variable movements. This hybrid model preserves flexibility but limits some of the scale benefits of a fully dedicated network.
SMEs registered at a 7.79% CAGR through 2031 in the dedicated contract carriage market. Providers are lowering the minimum scale needed for service through flex-fleet and multi-client dedicated models. E-commerce fulfillment is also increasing pressure on smaller companies that cannot operate fleets economically. A service failure on a critical lane can encourage a mid-market customer to move more freight under a dedicated arrangement. NFI generated 45% of its USD 4 billion revenue base from dedicated contract carriage, reflecting the role of deep customer integration across service lines. Scalable onboarding practices can extend this approach to more mid-market accounts.
By End-use Industry: Manufacturing Leads While Retail and E-commerce Move Faster
Manufacturing held 17.63% of the dedicated contract carriage market size in 2025. Just-in-time production schedules make consistent inbound delivery important because a missed component shipment can halt a production line. Automotive and aerospace operators have delivery-time requirements that transactional capacity may not consistently meet. Life sciences and health care freight also require managed documentation and temperature controls. The Drug Supply Chain Security Act adds compliance requirements that professionally managed fleets can support.
Retail and e-commerce registered at an 8.24% CAGR through 2031 in the dedicated contract carriage market. Continuous sales events have reduced the time between a demand signal and a delivery requirement. This favors pre-positioned equipment and exclusive access to planned capacity. Grocery operators increased their dedicated partnerships for refrigerated lanes in 2025. Food and beverage customers are increasing cold-chain outsourcing as refrigerated lane density and regulatory requirements rise. Automotive, energy and utilities, technology and electronics, consumer goods, FMCG, and food and beverages each retain distinct freight needs that providers address through tailored equipment and operating procedures.

Geography Analysis
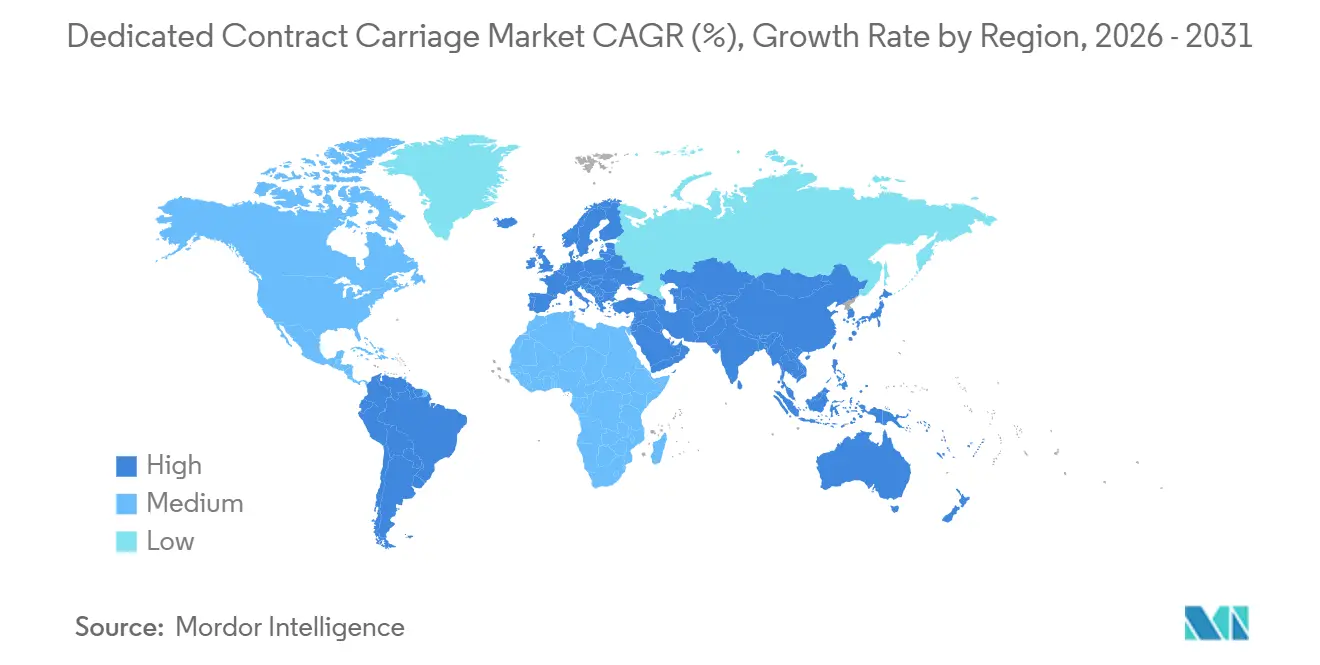
North America accounted for 31.29% of the share of the dedicated contract carriage market in 2025. The United States has a mature contractual trucking culture and substantial demand from e-commerce and manufacturing freight. Federal compliance requirements, state emissions rules, and liability exposure encourage large shippers to use professionally managed fleets. Canada adds national dedicated capacity through carriers, including Day & Ross and Canada Cartage. Mexico is gaining cross-border dedicated freight as nearshoring supports automotive and electronics production in Nuevo Leon, Coahuila, and Jalisco.
Asia-Pacific registered at an 8.10% CAGR through 2031 in the dedicated contract carriage market. China’s policy objective to lower total social logistics costs to 13.5% of GDP by 2027 supports outsourcing to operators that can improve network efficiency. China Economic Net reported that total social logistics volume rose 4.9% year-over-year in the first 8 months of 2026. India’s third-party logistics sector is supported by freight-corridor investment and production-led expansion in Maharashtra, Gujarat, and Tamil Nadu. Japan, South Korea, and Southeast Asian countries add demand from automotive, electronics, and cross-border e-commerce activity.
Europe is a mature road-freight region with a dedicated and contract logistics sector shaped by post-consolidation changes. The IRTU recorded rising contract rates in the first quarter of 2026. South America is emerging through manufacturing expansion in Brazil and Argentina. The Middle East and Africa show demand concentrated in the UAE, Saudi Arabia, and South Africa, where diversification programs support logistics infrastructure. These regional conditions broaden the addressable base for the dedicated contract carriage market.
Competitive Landscape
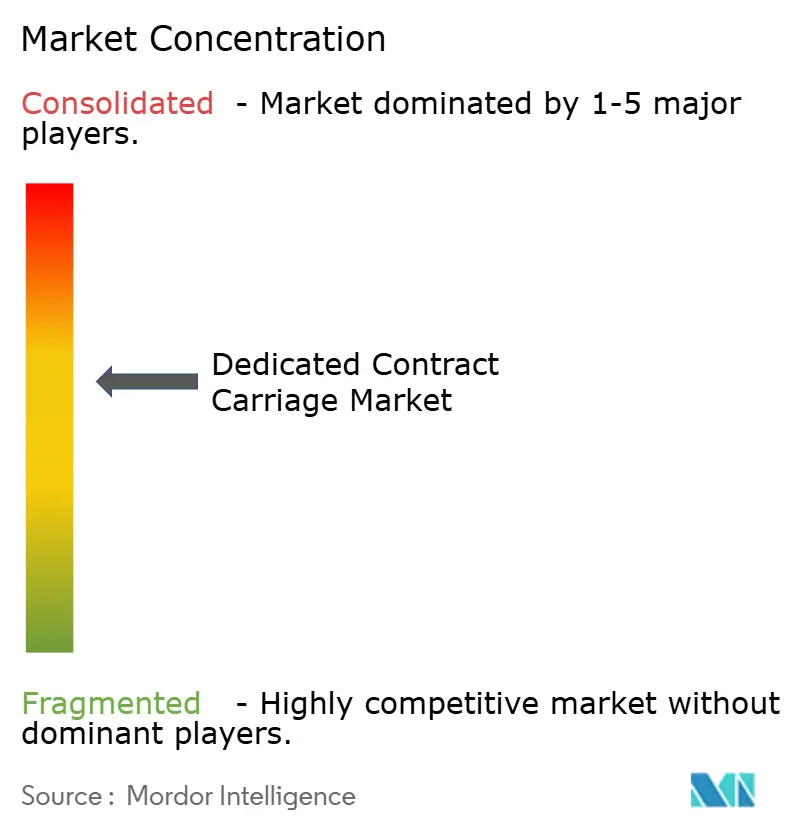
The dedicated contract carriage market has moderate concentration among the largest providers and substantial fragmentation among regional and niche carriers. J.B. Hunt Dedicated Contract Services operated 12,639 power units, Ryder operated 10,700, Schneider operated 8,504, Penske Logistics operated 7,798, and Knight-Swift operated 6,000 in the 2026 rankings. These 5 providers operated more than 45,000 dedicated trucks collectively. More than 40 additional carriers compete across regional lanes, specialized freight, and customer-specific networks. Competitive strategies focus on high-compliance grocery, pharmaceutical, and automotive freight, acquisitions, and route-management tools.
Werner Enterprises acquired FirstFleet in January 2026 for USD 282.8 million, including USD 37.8 million in real estate. The acquisition added 2,400 tractors, 11,000 trailers, and 37 facilities near 130 customer sites, and it increased Werner’s dedicated revenue base by 50%. Schneider had expanded its eastern United States dedicated network to nearly 8,600 tractors across more than 40 locations by December 2025. DSV completed its acquisition of DB Schenker in April 2025 for DKK 14.2 billion (USD 16.3 billion), adding scale in European road freight and contract logistics. These moves show that network reach and established customer relationships remain important competitive assets.
Technology is becoming more important in the dedicated contract carriage market alongside fleet scale. Predictive maintenance, real-time lane visibility, account-level data, and dynamic route optimization can help providers manage empty miles and delivery performance. Penske Logistics implemented Augment’s freight visibility platform across its dedicated transportation operations in January 2026 after a 6-month pilot. DSV and Volvo Autonomous Solutions commenced commercial autonomous freight operations on a Dallas-to-Houston lane in Texas in May 2026. SMEs, specialized and heavy-haul services, and cold-chain transportation remain areas where providers can expand. FMCSA electronic inspection rules and California reporting requirements also make compliance capability an important selection factor for shippers.
Dedicated Contract Carriage Industry Leaders
-
J.B. Hunt Transport Services, Inc.
-
Ryder System, Inc.
-
Schneider National, Inc.
-
Penske Corporation
-
Knight-Swift Transportation Holdings Inc.
- *Disclaimer: Major Players sorted in no particular order
Recent Industry Developments
- October 2026: CMA CGM Group acquired FedEx Supply Chain for an enterprise value of USD 1.4 billion through its CEVA Logistics subsidiary. The agreement would nearly triple CEVA’s North American contract logistics footprint to 150 warehouses and 20,000 employees. The transaction included multi-year commercial agreements and collaboration on selected air cargo capacity solutions.
- June 2026: Knight-Swift Transportation’s subsidiary, AAA Cooper Transportation, opened 4 terminal locations in new markets. The expansion increased the combined LTL and Dedicated Services network footprint and supported proximity-based contract carriage opportunities.
- March 2026: GEODIS completed the acquisition of Transports Malherbe, a full truckload road transport specialist serving agri-food and retail customers. The transaction placed GEODIS among the top 3 providers in the French full and partial truckload segment with combined revenue approaching USD 2.2 billion.
- January 2026: DHL Supply Chain renewed and expanded its multi-year logistics contract with Airbus. The arrangement covered 350,000 shipments annually for 20 Airbus sites and added a dedicated 24/7 service for Aircraft on Ground operations.
Global Dedicated Contract Carriage Market Report Scope
| Dry Van |
| Refrigerated and Frozen |
| Flatbed and Step-deck |
| Tanker and Bulk |
| Specialized and Heavy-haul Equipment |
| Short-term Contracts, Up to 1 Year |
| Medium-term Contracts, 1 to 3 Years |
| Long-term Contracts, More Than 3 Years |
| Large Enterprises |
| Mid-sized Enterprises |
| Small and Medium-sized Enterprises |
| Automotive |
| Energy and Utilities |
| Manufacturing |
| Life Sciences and Healthcare |
| Technology and Electronics |
| Retail and E-commerce |
| Consumer Goods and FMCG |
| Food and Beverages |
| Others |
| North America | United States |
| Canada | |
| Mexico | |
| South America | Brazil |
| Argentina | |
| Peru | |
| Chile | |
| Rest of South America | |
| Europe | Germany |
| United Kingdom | |
| France | |
| Italy | |
| Spain | |
| Russia | |
| Nordics (Denmark, Finland, Iceland, Norway, and Sweden) | |
| Rest of Europe | |
| Asia-Pacific | China |
| India | |
| Japan | |
| South Korea | |
| Australia | |
| Southeast Asia (ASEAN) | |
| Rest of Asia-Pacific | |
| Middle East and Africa | Saudi Arabia |
| United Arab Emirates | |
| Qatar | |
| South Africa | |
| Nigeria | |
| Egypt | |
| Rest of Middle East and Africa |
| By Vehicle Type | Dry Van | |
| Refrigerated and Frozen | ||
| Flatbed and Step-deck | ||
| Tanker and Bulk | ||
| Specialized and Heavy-haul Equipment | ||
| By Contract Duration | Short-term Contracts, Up to 1 Year | |
| Medium-term Contracts, 1 to 3 Years | ||
| Long-term Contracts, More Than 3 Years | ||
| By Customer Size | Large Enterprises | |
| Mid-sized Enterprises | ||
| Small and Medium-sized Enterprises | ||
| By End-use Industry | Automotive | |
| Energy and Utilities | ||
| Manufacturing | ||
| Life Sciences and Healthcare | ||
| Technology and Electronics | ||
| Retail and E-commerce | ||
| Consumer Goods and FMCG | ||
| Food and Beverages | ||
| Others | ||
| By Geography | North America | United States |
| Canada | ||
| Mexico | ||
| South America | Brazil | |
| Argentina | ||
| Peru | ||
| Chile | ||
| Rest of South America | ||
| Europe | Germany | |
| United Kingdom | ||
| France | ||
| Italy | ||
| Spain | ||
| Russia | ||
| Nordics (Denmark, Finland, Iceland, Norway, and Sweden) | ||
| Rest of Europe | ||
| Asia-Pacific | China | |
| India | ||
| Japan | ||
| South Korea | ||
| Australia | ||
| Southeast Asia (ASEAN) | ||
| Rest of Asia-Pacific | ||
| Middle East and Africa | Saudi Arabia | |
| United Arab Emirates | ||
| Qatar | ||
| South Africa | ||
| Nigeria | ||
| Egypt | ||
| Rest of Middle East and Africa | ||
Key Questions Answered in the Report
What is dedicated contract carriage?
It is a transportation arrangement in which a provider supplies drivers, equipment, and operating management for a customer’s defined freight lanes.
How large is the dedicated contract carriage market?
The dedicated contract carriage market was USD 102.42 billion in 2026 and is projected to reach USD 138.62 billion by 2031 at a 6.24% CAGR.
Which vehicle type has the largest share?
Dry van led with 37.63% in 2025 because it serves broad general-merchandise requirements across retail, manufacturing, and consumer goods freight.
Which customer group is expanding fastest?
SMEs are forecast to record a 7.79% CAGR through 2031 as flex-fleet and multi-client models reduce the service scale required for dedicated operations.
Why do shippers use dedicated transportation services?
Shippers use dedicated services to secure capacity, transfer fleet management responsibilities, improve recurring-lane reliability, and manage compliance requirements.
Which region is growing fastest?
Asia-Pacific is forecast to expand at an 8.10% CAGR through 2031, supported by logistics outsourcing and manufacturing-linked demand.