
Data Center Demand Response and Energy Management Market Size and Share
Market Overview
| Study Period | 2021 - 2032 |
|---|---|
| Market Size (2027) | USD 10.04 Billion |
| Market Size (2032) | USD 18.78 Billion |
| Growth Rate (2027 - 2032) | 13.34 % |
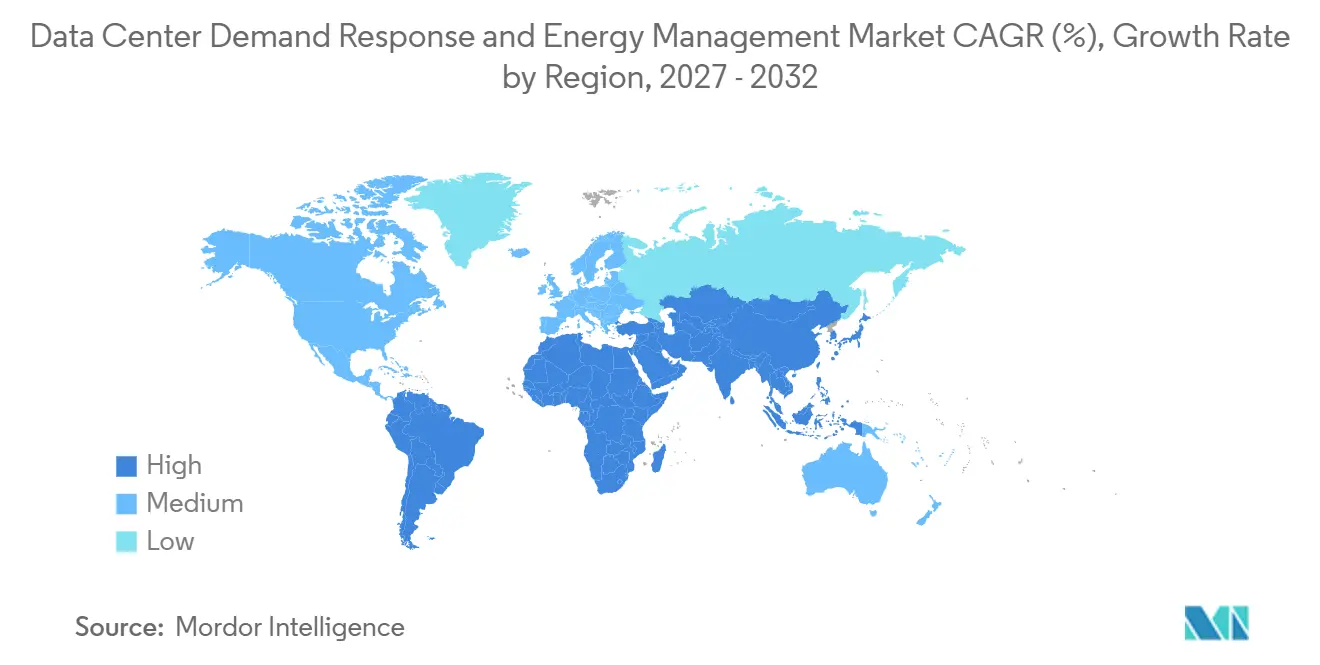
| Fastest Growing Market | Asia-Pacific |
| Largest Market | North America |
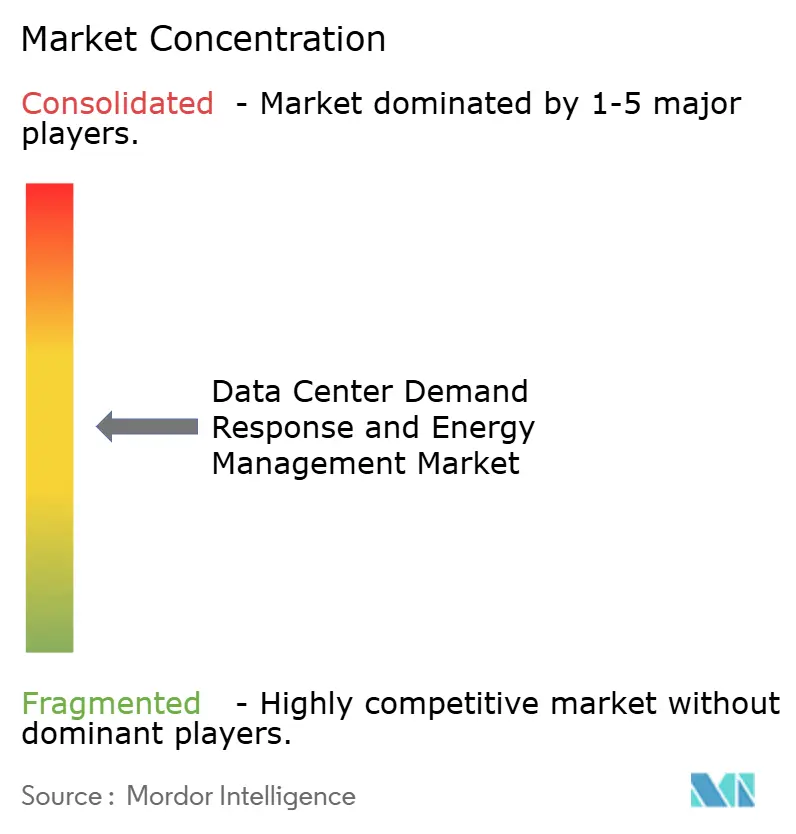
| Market Concentration | Medium |
Major Players *Disclaimer: Major Players sorted in no particular order Image © Mordor Intelligence. Reuse requires attribution under CC BY 4.0. | |
Data Center Demand Response and Energy Management Market Analysis by Mordor Intelligence
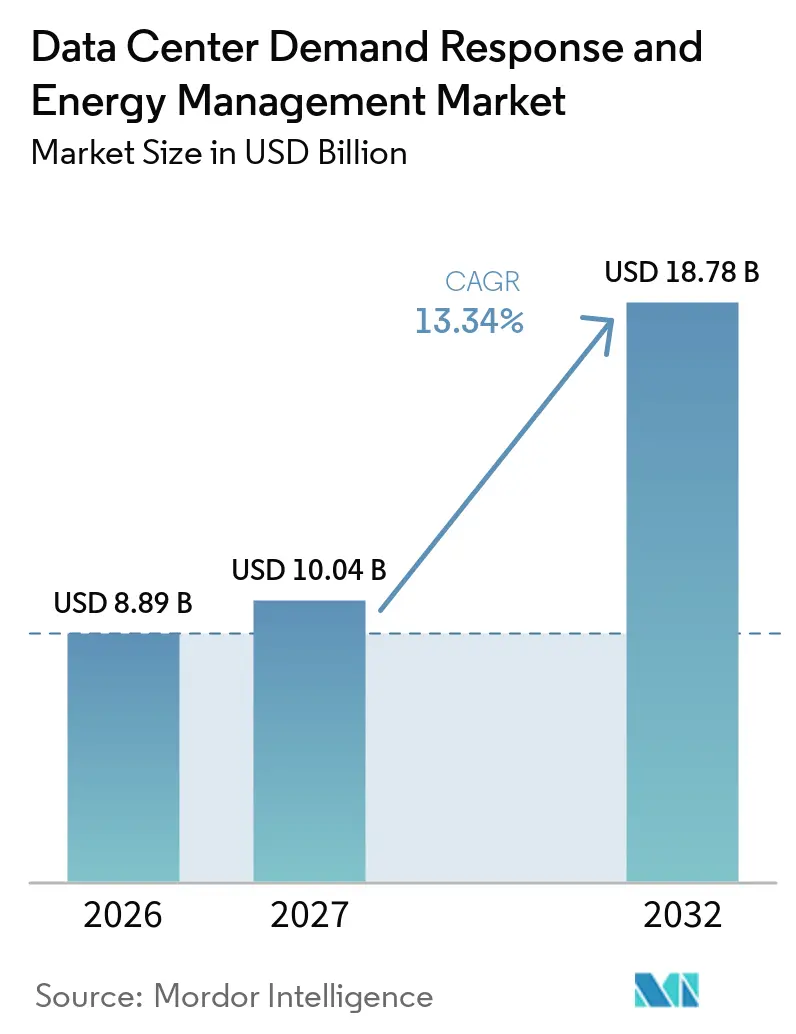
The Data Center Demand Response and Energy Management Market size is projected to expand from USD 8.89 billion in 2026 to USD 10.04 billion in 2027, and to USD 18.78 billion by 2032, registering a CAGR of 13.34% between 2027 and 2032. Electricity demand from data centers rose sharply as AI capacity expanded, which increased the value of controllable power use for operators and utilities. Long interconnection queues are making demand flexibility relevant during site selection and power contracting. The Data Center Demand Response and Energy Management Market is therefore moving beyond bill management toward a role in project development and grid access. Software, automated controls, and flexible workload scheduling are becoming central to this change. Operators that include these capabilities during design can address both power cost exposure and interconnection requirements.
Key Report Takeaways
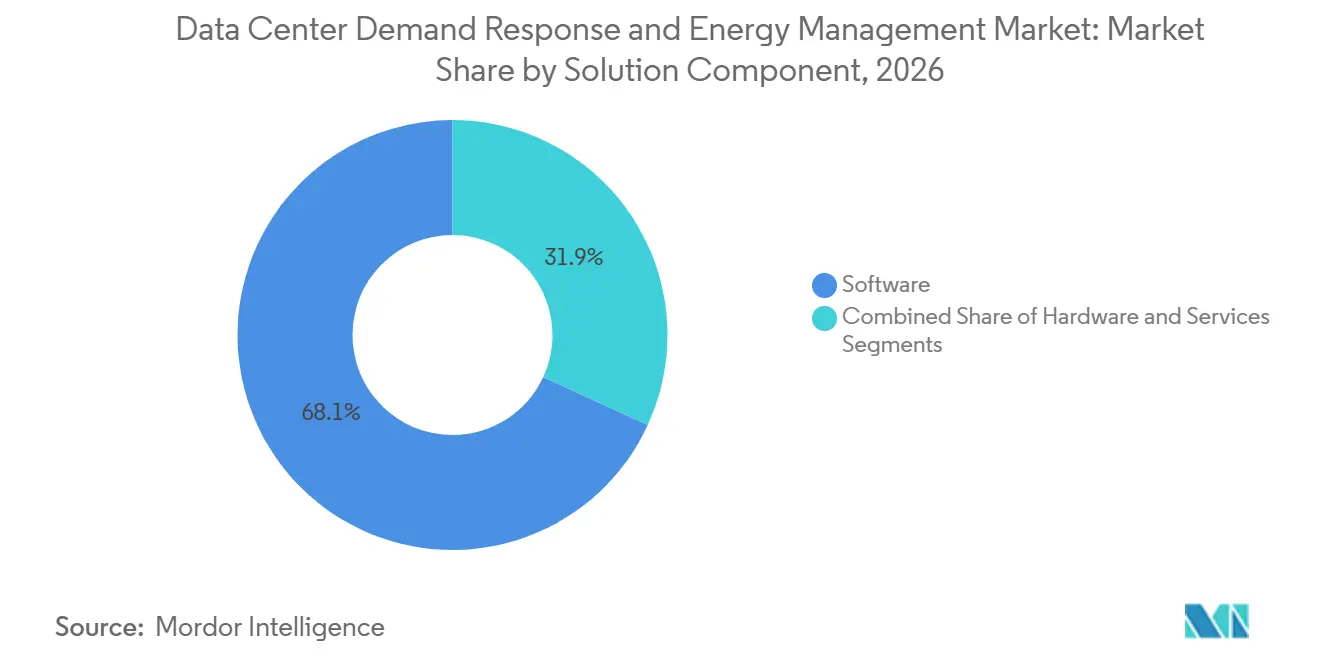
- By solution component, software held 68.12% of the Data Center Demand Response and Energy Management Market share in 2026, while services are projected to expand at a 15.76% CAGR through 2032.
- By software solution type, energy management software held 56.31% of the Data Center Demand Response and Energy Management Market share in 2026, while energy forecasting and optimization software is projected to expand at a 15.12% CAGR through 2032.
- By demand response program type, incentive-based programs held 71.18% of the Data Center Demand Response and Energy Management Market share in 2026.
- By automation level, manual and non-automated solutions held 70.14% of the Data Center Demand Response and Energy Management Market share in 2026, while automated and advanced demand response solutions are projected to expand at a 16.36% CAGR through 2032.
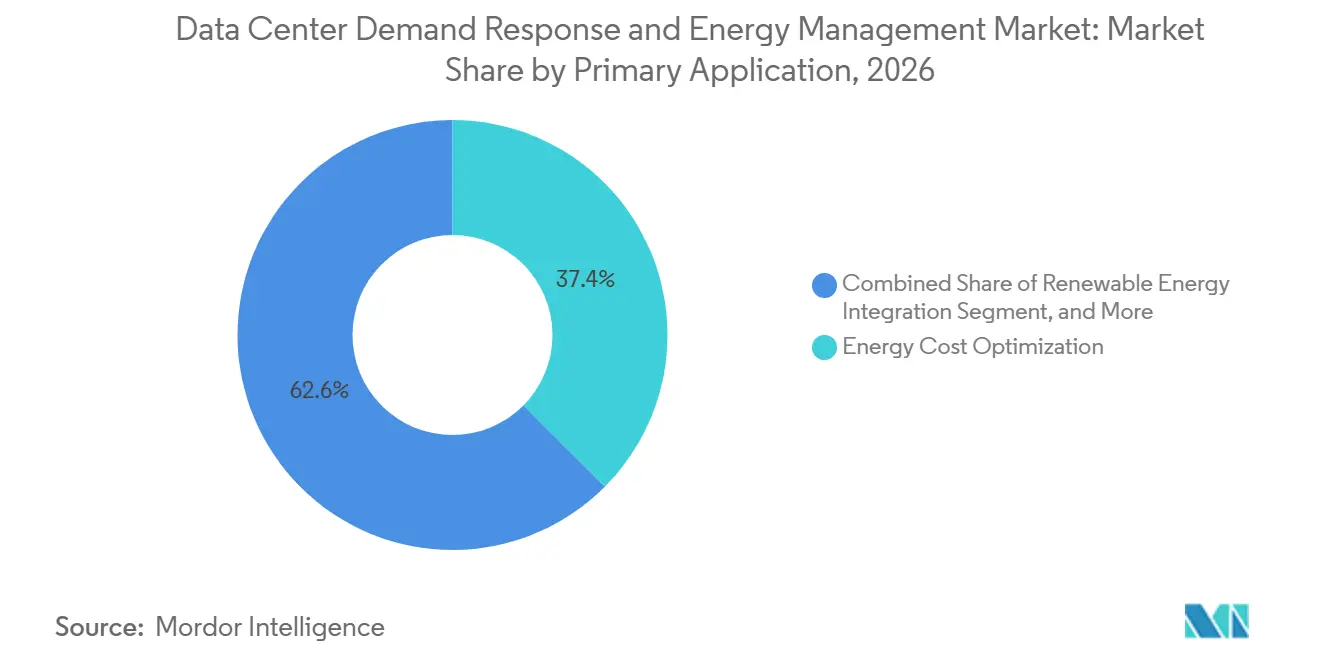
- By primary application, energy cost optimization held 37.44% of the Data Center Demand Response and Energy Management Market share in 2026, while renewable energy integration is projected to expand at a 14.26% CAGR through 2032.
- By data center size, hyperscale data centers held 58.19% of the Data Center Demand Response and Energy Management Market share in 2026.
- By data center type, colocation data centers held 62.45% share in 2026, while cloud service providers are projected to expand at a 15.43% CAGR through 2032.
- By geography, North America held 42.21% share in 2026, while Asia-Pacific is projected to expand at a 14.55% CAGR through 2032.
Note: Market numbers in this report are based on Mordor Intelligence's proprietary estimation framework, which combines nine months of actuals with Q4 projections for base year 2026.
Market Trends and Insights
Drivers Impact Analysis of Data Center Demand Response and Energy Management Market*
| Driver | (~) % Impact on CAGR Forecast | Geographic Relevance | Impact Timeline |
|---|---|---|---|
| Rising Electricity Prices and Operating Cost Pressure | +3.0% | Global, highest intensity in North America and Europe | Short term (≤ 2 years) |
| Grid Congestion and Flexible Load Demand | +2.5% | North America and EU, with spillover to Asia-Pacific core markets | Medium term (2-4 years) |
| AI Workload Growth and Scheduling Opportunities | +2.2% | Global, led by North America and Asia-Pacific | Short term (≤ 2 years) |
| Energy Monitoring and Optimization Platform Adoption | +1.8% | Global | Medium term (2-4 years) |
| Utility Demand Response and Grid Flexibility Programs | +1.5% | North America, EU, and Asia-Pacific emerging markets | Medium term (2-4 years) |
| AI-Based Forecasting and Automated Control Advances | +1.2% | Global | Long term (≥ 4 years) |
| Source: Mordor Intelligence | |||
Rising Electricity Prices and Pressure to Optimize Operating Costs
Electricity represents a concentrated operating cost for data centers, with Dena reporting that energy can account for 50% of operating expenditure in Germany. Higher rack densities for AI systems increase the cost exposure tied to power delivery and cooling. The Data Center Demand Response and Energy Management Market benefits from the ability of operators to convert some flexible consumption into utility program revenue. CPower has paid customers and partners more than USD 1.4 billion since 2015 through demand response and energy-flexibility programs, showing the commercial value that program participation can create. Demand-reduction commitments can also support interconnection planning, as utilities can include controllable load in their capacity assessments. This makes energy flexibility relevant to both capital planning and monthly electricity bills.
Grid Congestion and Increasing Demand for Flexible Electricity Loads
Grid congestion is making demand response a practical means of securing large-load connections in key locations. FERC expanded PJM wholesale demand response participation to 24 hours per day in 2025 for the 2027/2028 delivery year. The same assessment recorded more than 4,000 MW of peak reduction during the June 2025 PJM heat wave. Texas SB 6 and Virginia HB 284/SB 371 indicate that major data-center states are establishing clearer obligations for large-load flexibility. SEPA tracked 69 approved and 35 proposed large-load tariffs across 37 US states in Q2 2026. These tariffs give the Data Center Demand Response and Energy Management Market a broader set of utility entry points.
Growth of AI Workloads and Workload Scheduling Opportunities
AI training and background inference have more flexibility in timing than latency-sensitive business workloads. A Nature Energy study demonstrated that software reduced power consumption in a 256-GPU AI cluster by 25% over 3 consecutive hours while maintaining quality-of-service commitments. Applied Energy Research found that a hierarchical demand response model reduced data center electricity costs by 13.40% to 30.21% compared with conventional dispatch approaches. ACEEE reported that curtailing loads for 0.25% of annual uptime could accommodate 76 GW of new grid load without additional generation. Google signed contracts for 1 GW of data center demand response with 5 US utilities in March 2026, leveraging machine-learning workload flexibility. This is moving workload scheduling from a technical option to an operating model that utilities can contract for.
Adoption of Energy Monitoring and Optimization Platforms
Energy monitoring platforms increasingly combine telemetry, digital models, and automated controls. An IEEE Transactions on Sustainable Computing study reported a digital twin model with a relative absolute error below 5% and a 27% lower carbon footprint than conventional over-provisioning. EnergyHub managed more than 3.4 GW of dispatchable flexibility across over 150 utility clients in 2025. Germany's EnEfG and the EU Energy Efficiency Directive require energy reporting that depends on reliable metering and analytics. This compliance requirement can provide the operating data needed for demand response enrollment. The Data Center Demand Response and Energy Management Market benefits from this overlap, as reporting systems and flexibility platforms increasingly share the same data foundation. Operators can then use compliance investments for power planning, energy optimization, and grid participation.
Restraints Impact Analysis of Data Center Demand Response and Energy Management Market*
| Restraint | (~) % Impact on CAGR Forecast | Geographic Relevance | Impact Timeline |
|---|---|---|---|
| Limited Flexibility to Curtail Mission-Critical IT Loads | -2.8% | Global | Short term (≤ 2 years) |
| Service Availability Risks From Inappropriate Load Adjustments | -1.8% | Global | Short term (≤ 2 years) |
| Facility and IT System Integration Challenges | -1.2% | Asia-Pacific core and emerging markets | Medium term (2-4 years) |
| Demand Response Incentive and Revenue Uncertainty | -0.9% | North America and EU | Medium term (2-4 years) |
| Source: Mordor Intelligence | |||
Limited Flexibility to Curtail Mission-Critical IT Loads
Service level agreements can prevent operators from reducing tenant-controlled IT demand during grid events. FERC has recognized technical requirements as a barrier to the use of data centers as flexible loads.[1] Colocation operators face added coordination work because each tenant may need to approve load participation. This is especially important because colocation facilities hold 62.45% of the Data Center Demand Response and Energy Management Market share in 2026. AI training and background inference offer a growing pool of deferrable workloads, but they do not solve every tenant restriction. The limitation remains most significant for enterprise and colocation sites and less significant for hyperscale operators that manage their own workload stack.
Risks to Service Availability From Inappropriate Load Adjustments
Poorly coordinated adjustments to cooling, power distribution, or UPS equipment can affect application availability. The risk rises when dispatch instructions need a response within short intervals, and IT and facilities teams use separate processes. Research in IEEE Transactions on Sustainable Computing found that weak forecast models increase service disruption exposure in carbon-aware capacity planning. CPower, Bentaus, and Supermicro demonstrated that coordinated controls allowed NVIDIA B200 GPU servers to use up to 75% less electricity under grid conditions while maintaining AI workloads. The result depended on close coordination between operational technology and IT controls. Vendors without that integration face a higher hurdle in demonstrating reliable participation.
*Our forecasts treat driver/restraint impacts as directional, not additive. The impact forecasts reflect baseline growth, mix effects, and variable interactions.
Data Center Demand Response and Energy Management Market Segment Analysis
By Solution Component:
Software Holds the Largest Position While Services Advance QuicklySoftware held 68.12% of the Data Center Demand Response and Energy Management Market share in 2026. Its position reflects the need to model, forecast, and dispatch power flexibility at short intervals. Operators use software to integrate facility data, grid signals, and workload decisions into a single process. Hardware such as meters, sensors, and power distribution equipment provides the underlying data layer. However, hardware is supplied by many established vendors and faces stronger standardization pressure. The software layer turns raw information into a decision that can be used for a utility event or an internal cost target.
Services are projected to expand at a 15.76% CAGR through 2032. The growth reflects the difficulty of aligning utility rules, tenant agreements, controls integration, renewable procurement, and energy reporting. Lehigh University's research on AI data center scheduling found that coordinated workload and energy management can reduce costs under demand-response conditions. Many operating teams lack in-house experience with grid markets or demand response settlement. Specialist providers can therefore support program design, system commissioning, and operational verification. The Data Center Demand Response and Energy Management Market also benefits when these services help operators use the same platform across more facilities.

By Software Solution Type:
Forecasting Tools Support More Accurate Dispatch DecisionsEnergy management software held 56.31% share in 2026. It remains the basic platform for collecting information from power systems, cooling equipment, and IT loads. The Data Center Demand Response and Energy Management Market size for energy forecasting and optimization software is projected to expand at a 15.12% CAGR through 2032. Forecasting tools add a forward view of load, price, and expected grid events. Demand response management platforms support event enrollment and settlement records. Monitoring and analytics systems also support energy reporting in line with European requirements.
AI workloads can rapidly change power demand, making historical dashboards less useful for real-time decisions. The IEA reported a sharp rise in data center electricity use during 2025 as capacity constraints became more visible. Operators need models that can estimate short-term demand before a utility event or tariff interval begins. Forecasting systems can integrate weather, cooling load, server activity, and electricity conditions into a single model. This supports a shift from passive reporting to automated action. It also favors products designed around predictive control rather than products that add forecasting to established monitoring tools.
By Demand Response Program Type:
Incentive-Based Programs Provide Clearer Revenue SignalsIncentive-based programs held 71.18% share in 2026. These programs pay facilities for capacity commitments, emergency load reductions, or ancillary services support. The structure gives finance teams a clearer view of the expected return from enrollment. Price-based arrangements can be less attractive when facilities have flat-rate contracts or limited exposure to real-time pricing. The Data Center Demand Response and Energy Management Market is supported when utilities offer payment structures that match a facility's operational constraints. FERC's PJM rule expanded the hours when eligible demand response resources can participate.
Constellation Energy and GridBeyond launched an AI-powered demand response program in PJM during July 2025. The program used predictive analytics and a digital twin platform to add new demand response resources. Incentive structures can address the hesitation that remains when price variation alone is insufficient to change operating practice. Market access also depends on program rules, technical accreditation, and the availability of verifiable load controls. As PJM, ERCOT, and ISO-NE clarify pathways for large-load participation, the number of revenue-generating events could increase. This makes program design as important as the underlying power savings.
By Automation Level:
Automated Response Addresses Narrower Dispatch WindowsManual and non-automated solutions accounted for 70.14% of the market in 2026. Many enterprise and medium-sized facilities still rely on human decisions for load shedding during utility events. Automated and advanced demand response solutions are projected to expand at a 16.36% CAGR through 2032. Automated systems can receive a signal, test the available flexibility, and adjust selected loads without waiting for manual approval. This capability is important when events are short and response requirements are strict. It is also relevant to payments that depend on measured performance.
OpenADR-compatible interfaces can help facilities exchange event information with utilities and aggregators. The Data Center Demand Response and Energy Management Market share held by manual systems shows that replacement opportunities remain substantial. An automated response is more suitable for products where qualification requires action within seconds or minutes. This includes ancillary services, where the value per event can be higher but technical requirements are more demanding. Operators also need safeguards that protect cooling and core IT services during any automated action. The growth of this segment depends on reliable controls, transparent audit records, and clear site-level operating limits.
By Primary Application:
Cost Optimization Leads While Renewable Integration Gains GroundEnergy cost optimization accounted for 37.44% in 2026. It focuses on peak charges, demand charges, and exposure to changing energy rates. Emergency load reduction and peak load management are mature use cases in regions with established demand response programs. Participation in the capacity market and ancillary services can provide greater value, but they require verified and automated systems. The Data Center Demand Response and Energy Management Market continues to rely on cost optimization, as it provides operators with a direct incentive to invest in power intelligence. It can also be used before a facility takes part in external grid programs.
Renewable energy integration is projected to expand at a 14.26% CAGR through 2032. The IEA stated that the technology sector accounted for 40% of global corporate renewable power purchase agreements signed in 2025.[2] Variable renewable generation creates a need to align flexible compute demand with available power. Platforms can schedule eligible work when renewable supply is stronger or when grid carbon intensity is lower. This allows energy teams to connect procurement commitments with actual operating decisions. It may also support sustainability reporting while reducing exposure to curtailment or imbalance.
By Data Center Size:
Hyperscale Facilities Concentrate Flexible Load PotentialHyperscale data centers held 58.19% share in 2026. Their large campus loads can meet utility participation thresholds and support dedicated investments in controls software. ACEEE found that limited curtailment across data center loads could create significant grid capacity without new generation. The Data Center Demand Response and Energy Management Market serves hyperscale operators by enabling them to coordinate facility systems and compute schedules at scale. Large sites also have more value at risk from interconnection delays and high demand charges. These factors make flexibility a site-development consideration rather than only an operating feature.
Large data centers face many of the same power-density and electricity-cost pressures, although their participation volumes may be lower. Medium and small sites can be difficult to enroll individually because their available load may fall below program thresholds. Aggregators can address this by consolidating facilities into a single demand response portfolio. This creates a route for smaller operators to earn program revenue without developing all market capabilities internally. New builds in Asia-Pacific increasingly exceed 100 MW, indicating a larger addressable pool of high-load sites. The same shift can increase the importance of standardized controls and utility-ready reporting.
By Data Center Type:
Colocation Leads While Cloud Providers Use Geographic FlexibilityColocation data centers held 62.45% share in 2026. Multi-tenant facilities have strong incentives to manage energy costs, demand charges, and tenant-level reporting. They can use energy dashboards as a service feature for customers that track cost and carbon information. However, each tenant's service commitment can limit the extent to which the facility operator can control the IT load. This creates a need for clear consent processes and accurate measurement. The Data Center Demand Response and Energy Management Market must therefore support facility-level action while respecting tenant operating boundaries.
Cloud service providers are projected to expand at a 15.43% CAGR through 2032. Their main advantage is the ability to move workloads among geographically separate data centers. IEEE Transactions on Industry Applications validated a collaborative framework for cloud facilities in Northern Virginia that used location-based prices and carbon conditions in its energy management decisions. This form of spatial demand response can supplement traditional on-site curtailment. A provider can move suitable computing tasks to a location with lower power cost or lower carbon intensity. As workload portability increases, cross-site scheduling can become as commercially relevant as a local load reduction event.
Geography Analysis
North America
North America held 42.21% of the Data Center Demand Response and Energy Management Market share in 2026. The region combines large data center demand, organized wholesale markets, and a wide set of utility demand response programs. FERC recorded 33,272 MW of wholesale demand response participation across regional transmission organizations and independent system operators during 2024. SEPA identified 69 approved and 35 proposed large-load tariffs across 37 US states in Q2 2026. Texas and Virginia have both added legislation that increases attention on large-load flexibility and grid connections. Google’s 1 GW utility contracts show that compute-layer flexibility is reaching a material commercial scale in the region. FERC oversight and utility tariff design remain important regulatory influences because they shape available revenues and technical requirements. Operators with early demand-response agreements can leverage grid flexibility in their interconnection and site-selection strategies.
Asia-Pacific
Asia-Pacific is projected to expand at a 14.55% CAGR through 2032. ACS Energy and Fuels projected that regional data center power capacity in China, India, Japan, Australia, and South Korea would increase from 16 GW in 2025 to 70 GW by 2030. Larger new facilities strengthen the business case for energy forecasting and automated controls. Japan demonstrated a distinct approach when Hitachi and Tokyo Electric Power Grid shifted workloads across 3 data centers in Tokyo and Kanagawa during July 2025.[3] The project showed that distributed workloads can provide frequency-quality adjustment with near-zero computational downtime. Many Asia-Pacific countries have less developed capacity market and wholesale demand-response frameworks than those in North America. This leaves scope for bilateral agreements between utilities and operators before standard program rules emerge. Power-first design, renewable sourcing, battery storage, and intelligent load shifting are becoming important considerations for new regional sites.
Europe, Middle East and Africa, and South America
Europe is following a compliance-led path that differs from the utility-market emphasis in North America. Germany's EnEfG requires data centers with capacity above 300 kW to disclose annual energy use, PUE, and the share of renewable electricity. In 2026, the Umweltbundesamt published Germany's first official data center efficiency register, covering 319 facilities. Dena reported that electricity use in German data centers reached 21.3 TWh in 2025, while the average PUE declined to 1.43. Fraunhofer ISST and T-Systems are developing the DEM4DCF system to support cross-border AI workload shifting under the IPCEI-CIS framework. In the Middle East and Africa, investment by the UAE and Saudi Arabia can support demand for cooling management and power optimization in high-temperature environments. South America remains at an earlier stage, with Brazil and Chile providing an initial base as solar and wind penetration increases. The absence of mature wholesale demand-response structures limits current enrollment but may create opportunities later for platforms that can support flexible-load programs.
Competitive Landscape
The Data Center Demand Response and Energy Management Market includes large electrical infrastructure suppliers and specialized demand response operators. Schneider Electric SE, Siemens AG, Honeywell International Inc., ABB Ltd., and Eaton Corporation benefit from installed power and building-management systems that support integrated controls, power distribution, cooling, and monitoring. Voltus, GridBeyond, CPower, and EnergyHub focus more directly on aggregation, grid signals, and market participation. EPRI’s DCFlex initiative had expanded to 9 demonstration sites in the United States and Europe by 2025, helping develop a framework for valuing data center flexibility as a capacity resource.
Schneider Electric announced AI-ready reference designs with NVIDIA in September 2025, linking power management and liquid-cooling controls to NVIDIA Mission Control. The designs supported rack densities up to 142 kW and clusters of up to 1,152 GPUs per data hall. Honeywell and LS ELECTRIC formed a global partnership in October 2025 to develop switchgear, AI-enabled power monitoring, and modular battery storage systems for data centers.[4] Eaton and Siemens Energy also agreed to combine power infrastructure and modular generating systems for new data center capacity. These initiatives link energy controls to high-density AI infrastructure rather than isolated equipment.
Specialists are well placed where sites need aggregation across several facilities or coordination between computing and grid operations. Voltus launched its Bring Your Own Capacity product with Cloverleaf Infrastructure in September 2025 to support data center growth through virtual power plant capacity. Silicon Valley Power and Emerald AI launched a Santa Clara pilot in April 2026 that used GPU cluster controls to respond to utility dispatch signals. ISO 50001 certification can support procurement decisions in European and selected Asia-Pacific projects where energy management practices are reviewed. Providers that can demonstrate reliable controls, settlement visibility, and tenant safeguards can address a key barrier to wider adoption.
Data Center Demand Response and Energy Management Industry Leaders
-
Schneider Electric SE
-
Siemens AG
-
Honeywell International Inc.
-
ABB Ltd.
-
Eaton Corporation plc
- *Disclaimer: Major Players sorted in no particular order
Data Center Demand Response and Energy Management Market Companies Covered in this Report
- Schneider Electric SE
- Siemens AG
- Honeywell International Inc.
- ABB Ltd.
- Eaton Corporation plc
- Johnson Controls International plc
- AutoGrid Systems, Inc.
- Enel X S.r.l.
- CPower Energy Management LLC
- Voltus, Inc.
- GridBeyond Limited
- EnergyHub, Inc.
- Flexitricity Limited
- Kraken Technologies Limited
- Uplight, Inc.
- Generac Power Systems, Inc.
- Virtual Peaker, Inc.
- Centrica plc
- Landis+Gyr Group AG
- Itron, Inc.
Recent Industry Developments in Data Center Demand Response and Energy Management Market
- October 2026: Google and Voltus expanded their PJM virtual power plant agreement to more than 1,070 MW, building on a 100 MW agreement; Voltus will aggregate batteries, smart thermostats, and flexible commercial assets under a contract running to 2040, establishing the largest publicly announced VPP commitment for data center grid capacity to date and creating a long-duration blueprint for hyperscaler-funded distributed capacity.
- June 2026: Schneider Electric SE and Hon Hai Technology Group (Foxconn) announced a strategic collaboration on AI data center infrastructure, combining Foxconn's manufacturing and AI rack integration capabilities with Schneider Electric's power, cooling, and energy management systems; the companies plan to co-develop AI data center reference architectures and closed-loop energy optimization frameworks.
- April 2026: Silicon Valley Power and Emerald AI launched a pilot program in Santa Clara that demonstrates grid-responsive AI data center flexibility using Emerald AI's Conductor platform, integrated with NVIDIA DSX Flex, enabling GPU clusters to precisely adjust power consumption in response to utility dispatch signals while protecting AI workload performance.
- March 2026: Google announced 1 GW of demand response integrated into long-term contracts with Indiana Michigan Power, Tennessee Valley Authority, Entergy Arkansas, Minnesota Power, and DTE Energy, using machine learning workload flexibility as the curtailment lever, the largest publicly confirmed compute-layer demand response commitment, and a commercial template for utility-hyperscaler flexibility agreements.
Global Data Center Demand Response and Energy Management Market Report Scope
The Data Center Demand Response and Energy Management Market refers to the ecosystem of hardware, software, and services that data center operators use to monitor, optimize, automate, and manage electricity consumption while participating in demand response programs and energy markets. These solutions enable data centers to reduce peak demand, improve energy efficiency, integrate renewable energy resources, participate in capacity and ancillary-service programs, manage grid interactions, and optimize operational energy costs. The market includes demand response management platforms, energy management systems, energy analytics and forecasting solutions, and associated implementation, monitoring, and consulting services deployed across colocation, cloud, enterprise, edge, and hyperscale data center environments.
The Data Center Demand Response and Energy Management Market Report is Segmented by Solution Component (Hardware, Software, and Services), Software Solution Type (Demand Response Management Platforms, Energy Management Software, Energy Monitoring and Analytics Software, and Energy Forecasting and Optimization Software), Demand Response Program Type (Price-Based Programs, and Incentive-Based Programs), Automation Level (Manual and Non-Automated Solutions, and Automated, and Advanced Demand Response Solutions), Primary Application (Peak Load Management, Emergency Load Reduction, Capacity Market Participation, Ancillary Services, Energy Cost Optimization, and Renewable Energy Integration), Data Center Size (Small, Medium, Large, and Hyperscale), Data Center Type (Colocation, Cloud Service Providers [CSPs], and Enterprise and Edge), and Geography (North America, South America, Europe, Asia-Pacific, and Middle East and Africa). The Market Forecasts are Provided in Terms of Value (USD).
Segmentation Overview
| Hardware |
| Software |
| Services |
| Demand Response Management Platforms |
| Energy Management Software |
| Energy Monitoring and Analytics Software |
| Energy Forecasting and Optimization Software |
| Price-Based Programs |
| Incentive-Based Programs |
| Manual and Non-Automated Solutions |
| Automated and Advanced Demand Response Solutions |
| Peak Load Management |
| Emergency Load Reduction |
| Capacity Market Participation |
| Ancillary Services |
| Energy Cost Optimization |
| Renewable Energy Integration |
| Small |
| Medium |
| Large |
| Hyperscale |
| Colocation |
| Cloud Service Providers (CSPs) |
| Enterprise and Edge |
| North America | United States |
| Canada | |
| Mexico | |
| South America | Brazil |
| Chile | |
| Colombia | |
| Argentina | |
| Peru | |
| Rest of South America | |
| Europe | Germany |
| United Kingdom | |
| France | |
| Netherlands | |
| Ireland | |
| Spain | |
| Italy | |
| Nordics | |
| Rest of Europe | |
| Asia-Pacific | China |
| Japan | |
| India | |
| Australia | |
| Singapore | |
| South Korea | |
| Rest of Asia-Pacific | |
| Middle East and Africa | Saudi Arabia |
| United Arab Emirates | |
| South Africa | |
| Israel | |
| Egypt | |
| Qatar | |
| Rest of Middle East and Africa |
| By Solution Component | Hardware | |
| Software | ||
| Services | ||
| By Software Solution Type | Demand Response Management Platforms | |
| Energy Management Software | ||
| Energy Monitoring and Analytics Software | ||
| Energy Forecasting and Optimization Software | ||
| By Demand Response Program Type | Price-Based Programs | |
| Incentive-Based Programs | ||
| By Automation Level | Manual and Non-Automated Solutions | |
| Automated and Advanced Demand Response Solutions | ||
| By Primary Application | Peak Load Management | |
| Emergency Load Reduction | ||
| Capacity Market Participation | ||
| Ancillary Services | ||
| Energy Cost Optimization | ||
| Renewable Energy Integration | ||
| By Data Center Size | Small | |
| Medium | ||
| Large | ||
| Hyperscale | ||
| By Data Center Type | Colocation | |
| Cloud Service Providers (CSPs) | ||
| Enterprise and Edge | ||
| By Geography | North America | United States |
| Canada | ||
| Mexico | ||
| South America | Brazil | |
| Chile | ||
| Colombia | ||
| Argentina | ||
| Peru | ||
| Rest of South America | ||
| Europe | Germany | |
| United Kingdom | ||
| France | ||
| Netherlands | ||
| Ireland | ||
| Spain | ||
| Italy | ||
| Nordics | ||
| Rest of Europe | ||
| Asia-Pacific | China | |
| Japan | ||
| India | ||
| Australia | ||
| Singapore | ||
| South Korea | ||
| Rest of Asia-Pacific | ||
| Middle East and Africa | Saudi Arabia | |
| United Arab Emirates | ||
| South Africa | ||
| Israel | ||
| Egypt | ||
| Qatar | ||
| Rest of Middle East and Africa | ||
Key Questions Answered in the Report
What is the size of the Data Center Demand Response and Energy Management Market?
The Data Center Demand Response and Energy Management Market is projected at USD 8.89 billion in 2026 and USD 18.78 billion by 2032, with a 13.34% CAGR from 2027 to 2032.
Why are data centers joining demand response programs?
These programs can lower peak-power costs, create capacity payments, and support grid connection discussions where power is constrained in the Data Center Demand Response and Energy Management Market.
Which solution component has the largest share?
Software holds the largest share at 68.12% in 2026 because it supports forecasting, dispatch, and measurement across facility and IT systems.
Which data center type is expanding fastest?
Cloud service providers are projected to expand at a 15.43% CAGR through 2032 because they can shift eligible workloads between locations.
What is driving automated demand response adoption?
Automated solutions can respond to short utility dispatch windows and help facilities meet performance requirements for higher-value grid services.
Which region is projected to advance fastest?
Asia-Pacific is projected to expand at a 14.55% CAGR through 2032 as large new data center builds increase demand for power optimization and flexible workloads.