
Data Center Carbon Management Market Size and Share
Market Overview
| Study Period | 2021 - 2032 |
|---|---|
| Market Size (2027) | USD 1.21 Billion |
| Market Size (2032) | USD 2.96 Billion |
| Growth Rate (2027 - 2032) | 19.59 % |
| Fastest Growing Market | North America |
| Largest Market | Asia-Pacific |
| Market Concentration | Medium |
Major Players *Disclaimer: Major Players sorted in no particular order Image © Mordor Intelligence. Reuse requires attribution under CC BY 4.0. | |
Data Center Carbon Management Market Analysis by Mordor Intelligence
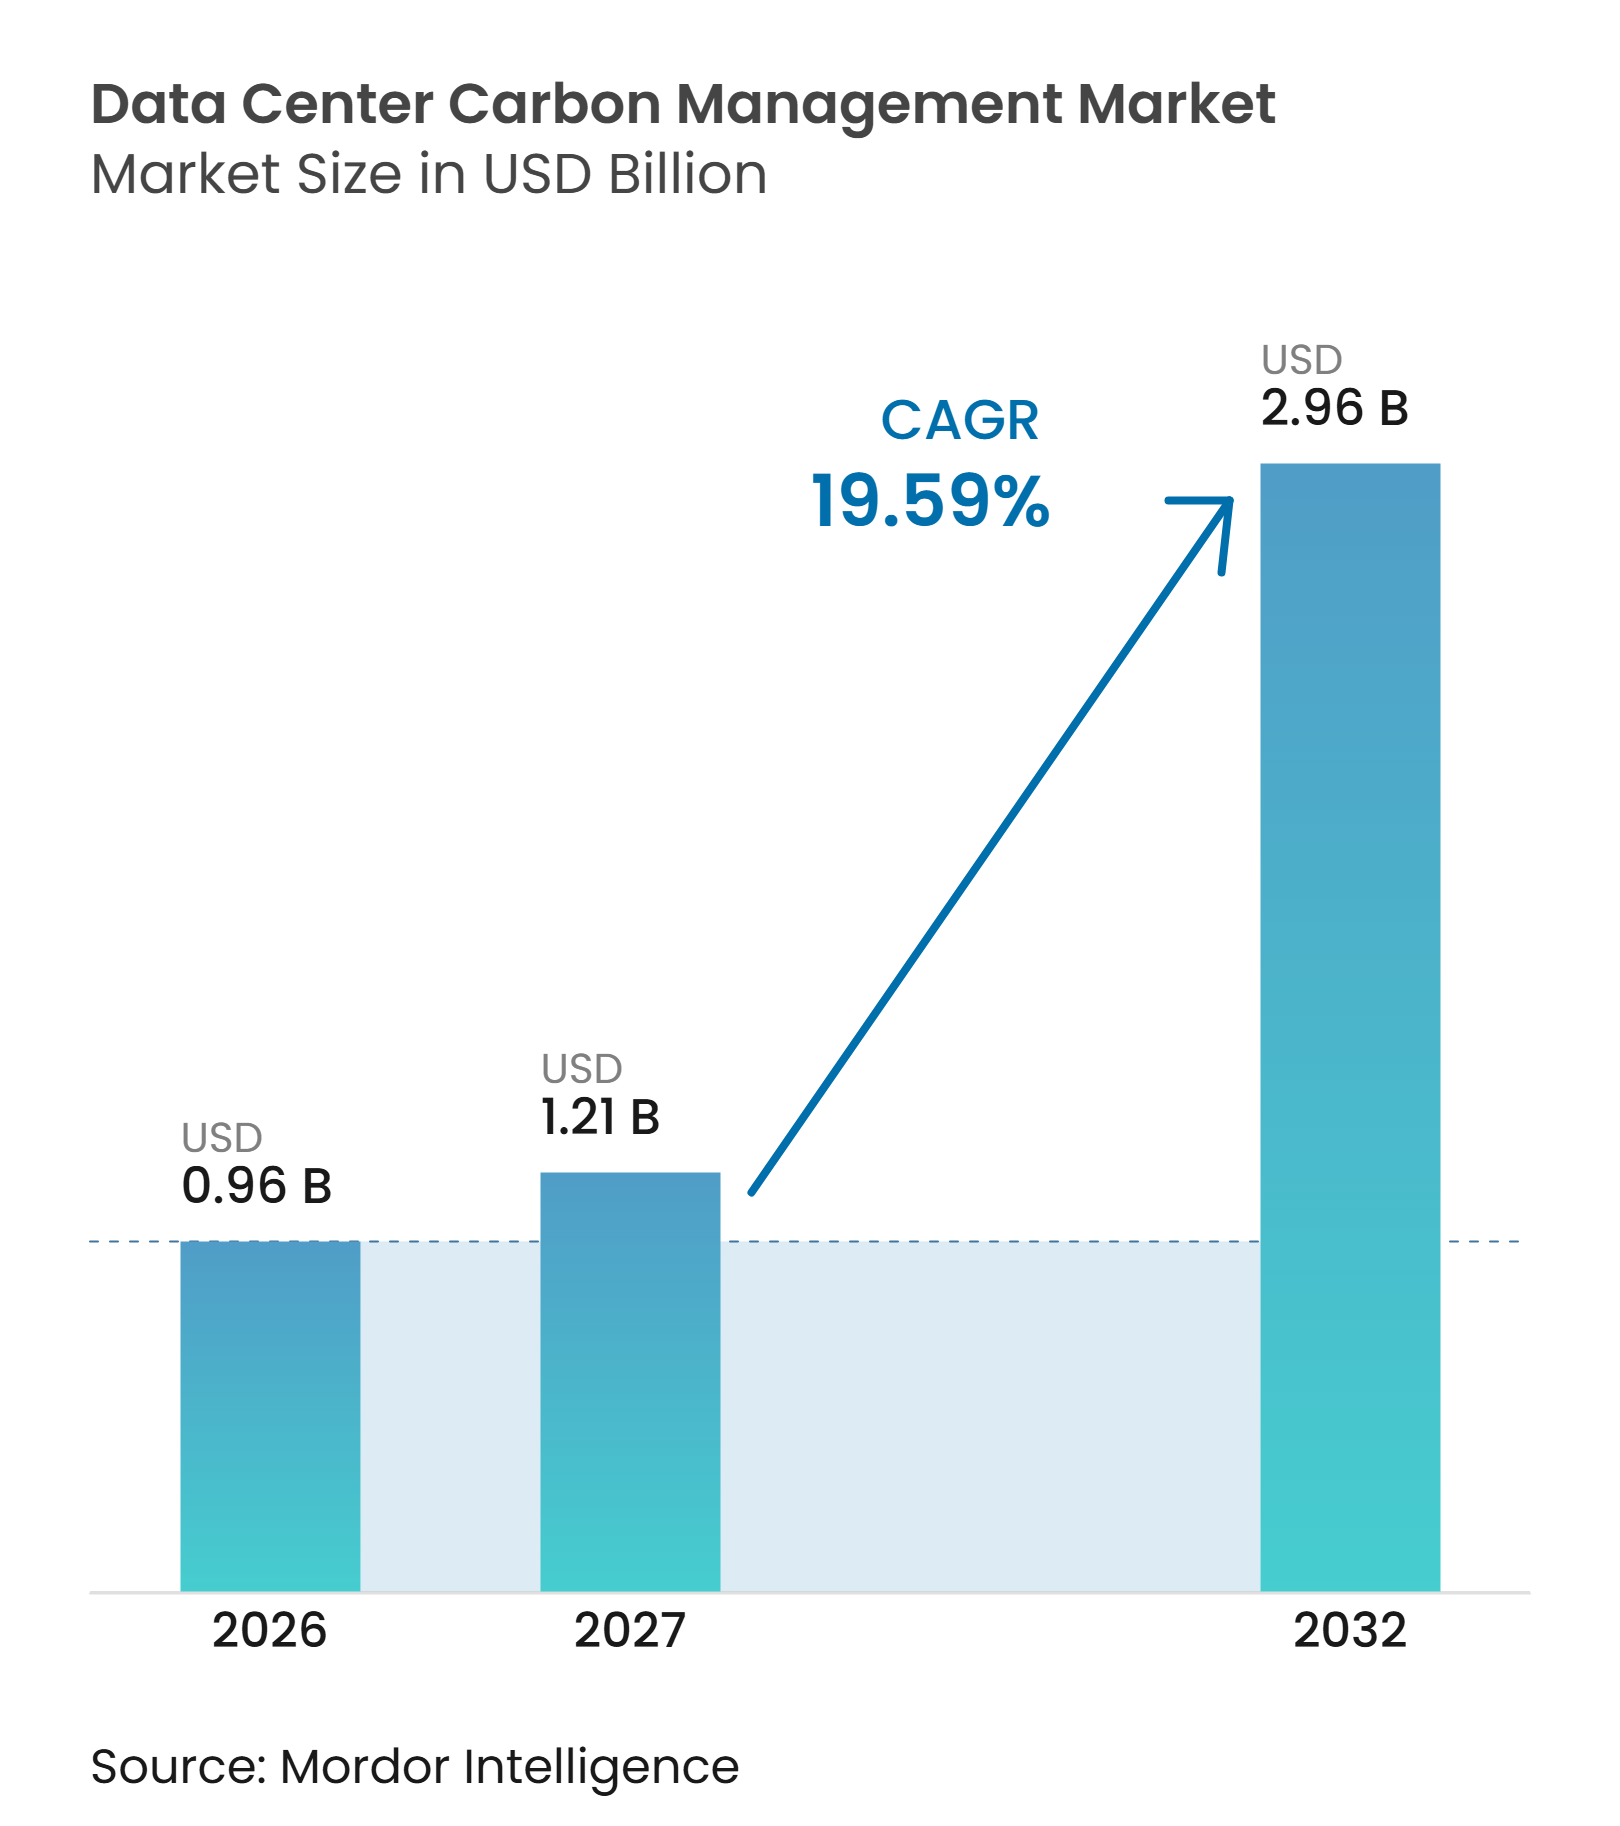
The data center carbon management market size was valued at USD 0.96 billion in 2026 and is estimated to expand from USD 1.21 billion in 2027 to reach USD 2.96 billion by 2032, at a CAGR of 19.59% during the forecast period (2027-2032). Emissions under management stand at 285 million tons of CO₂e in 2026 and are projected to rise to 340 million tons of CO₂e in 2027 and 620 million tons of CO₂e by 2032. The faster increase in value than managed emissions points to greater demand for audit-ready verification, Scope 3 data, and permanent carbon removal management. Disclosure obligations, rising electricity use, and customer requests for emissions information are moving carbon management from a sustainability exercise into an operating requirement. Providers are responding by connecting carbon data with cloud accounts, energy telemetry, procurement records, and customer reporting tools. These conditions support spending across software, managed services, verification, and reduction programs in the data center carbon management market.
Key Report Takeaways
- By solution type, carbon accounting and emissions measurement software held 34.38% of the data center carbon management market share in 2026, while carbon removal and permanent storage solutions are projected to expand at a 20.79% CAGR through 2032.
- By emissions scope, Scope 2 held a 49.21% share in 2026, while Scope 3 is projected to expand at a 20.19% CAGR through 2032.
- By deployment model, cloud-based platforms held a 73.44% share in 2026 and are projected to expand at a 20.17% CAGR through 2032.
- By service type, carbon accounting and reporting services held a 30.21% share in 2026, while carbon reduction program implementation is projected to expand at a 20.56% CAGR through 2032.
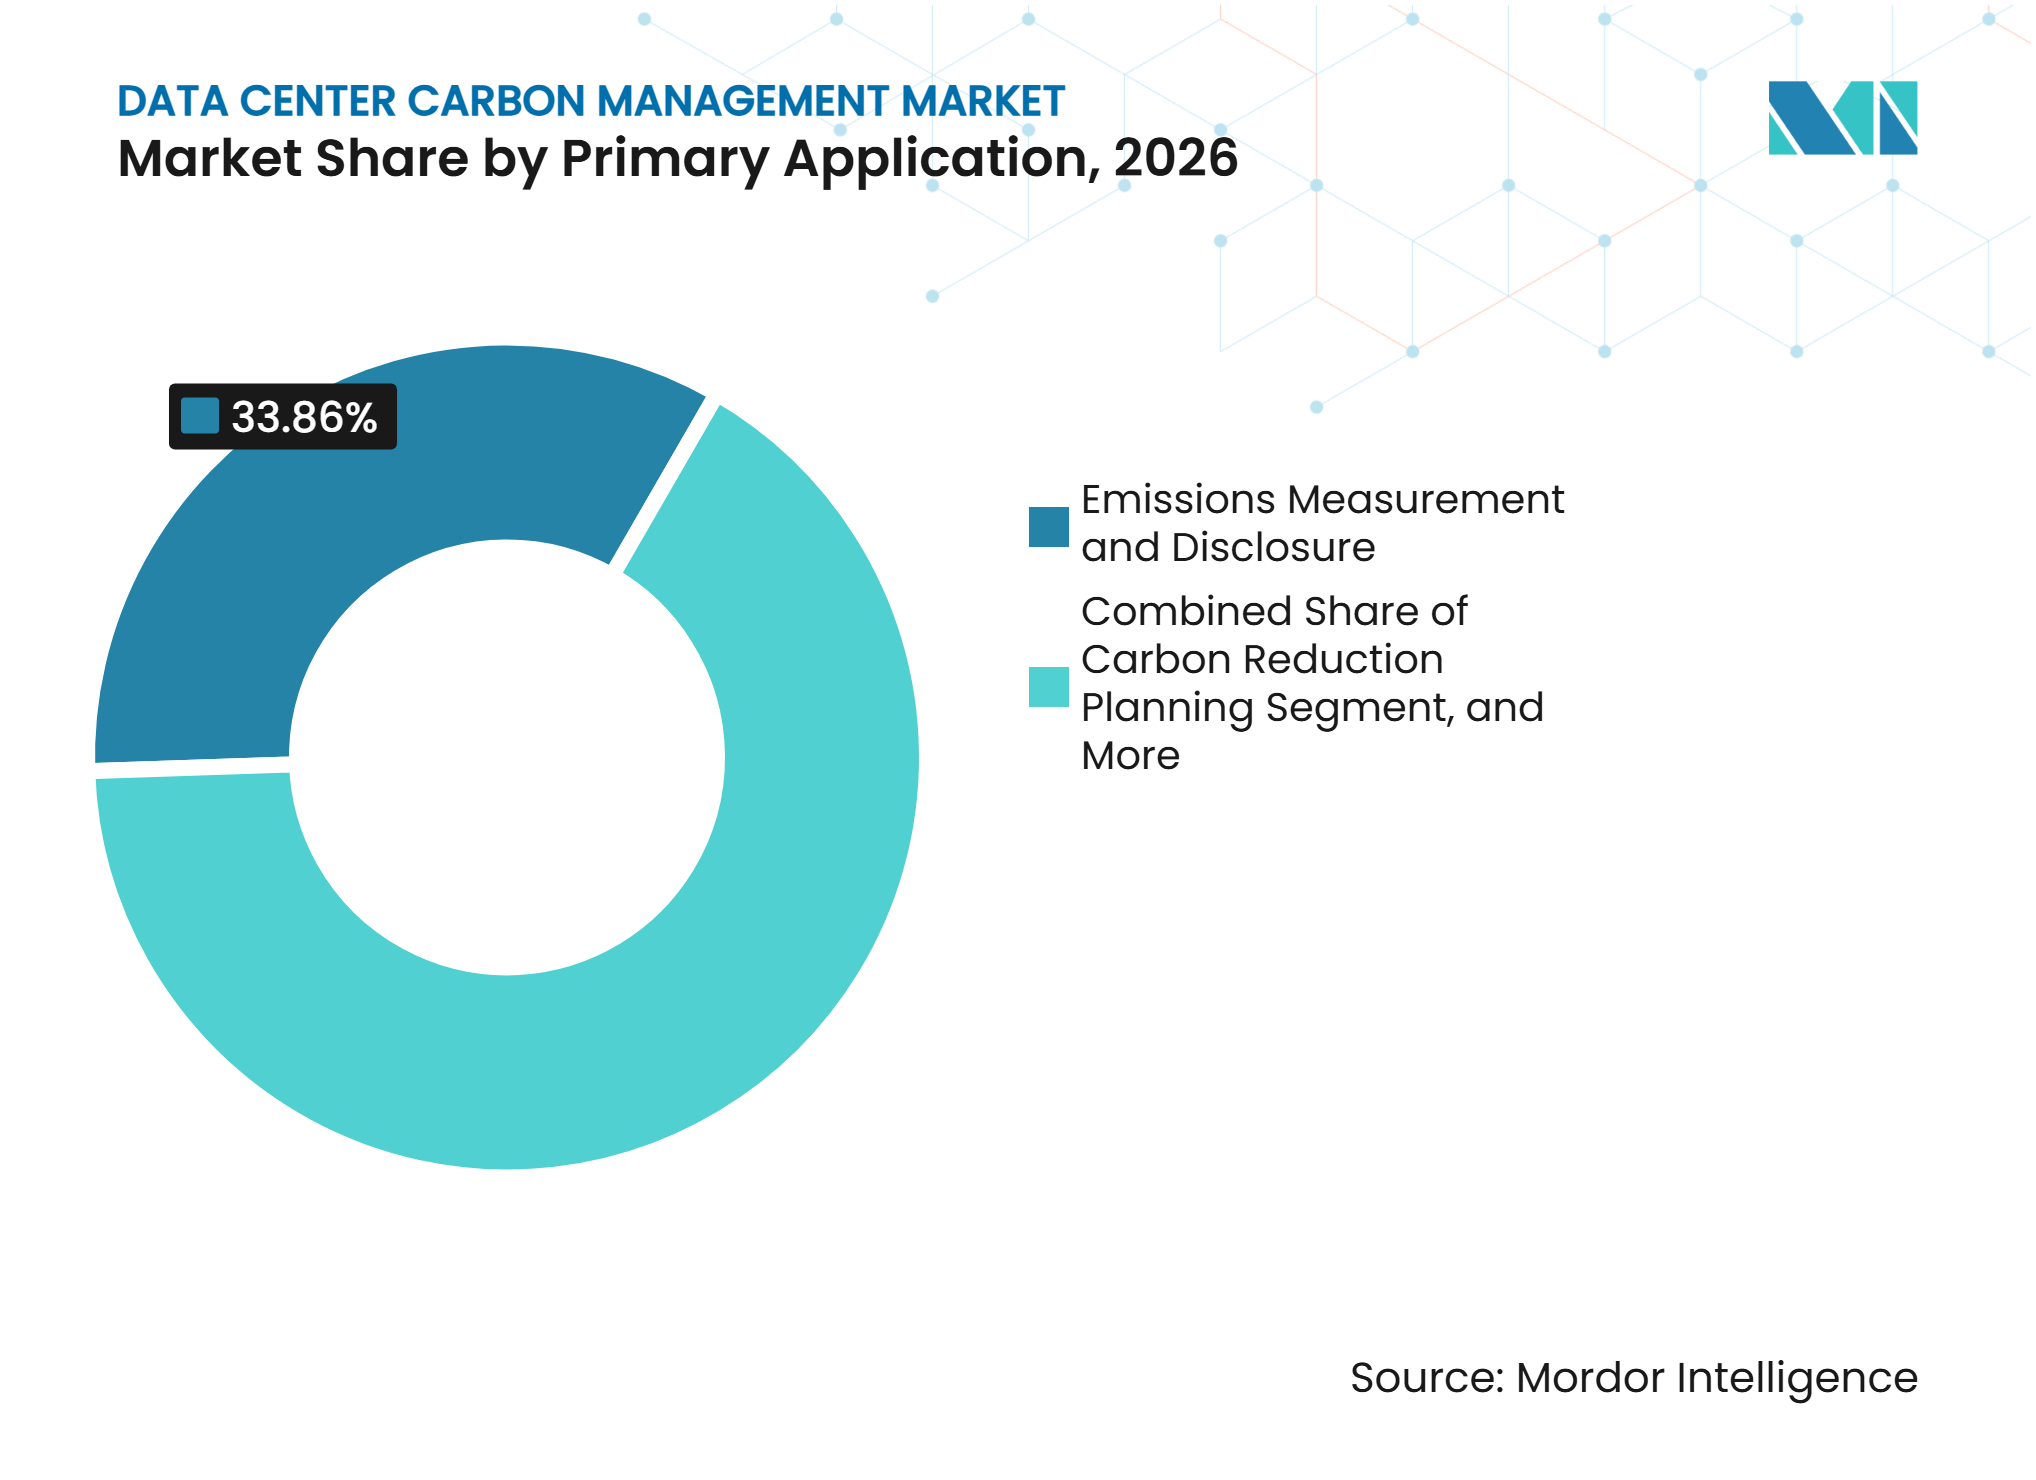
- By primary application, emissions measurement and disclosure held a 33.86% share in 2026 in the data center carbon management market, while renewable energy and electricity emissions tracking is projected to expand at a 20.74% CAGR through 2032.
- By data center size, hyperscale facilities held a 44.79% share in 2026 and are projected to expand at a 20.34% CAGR through 2032.
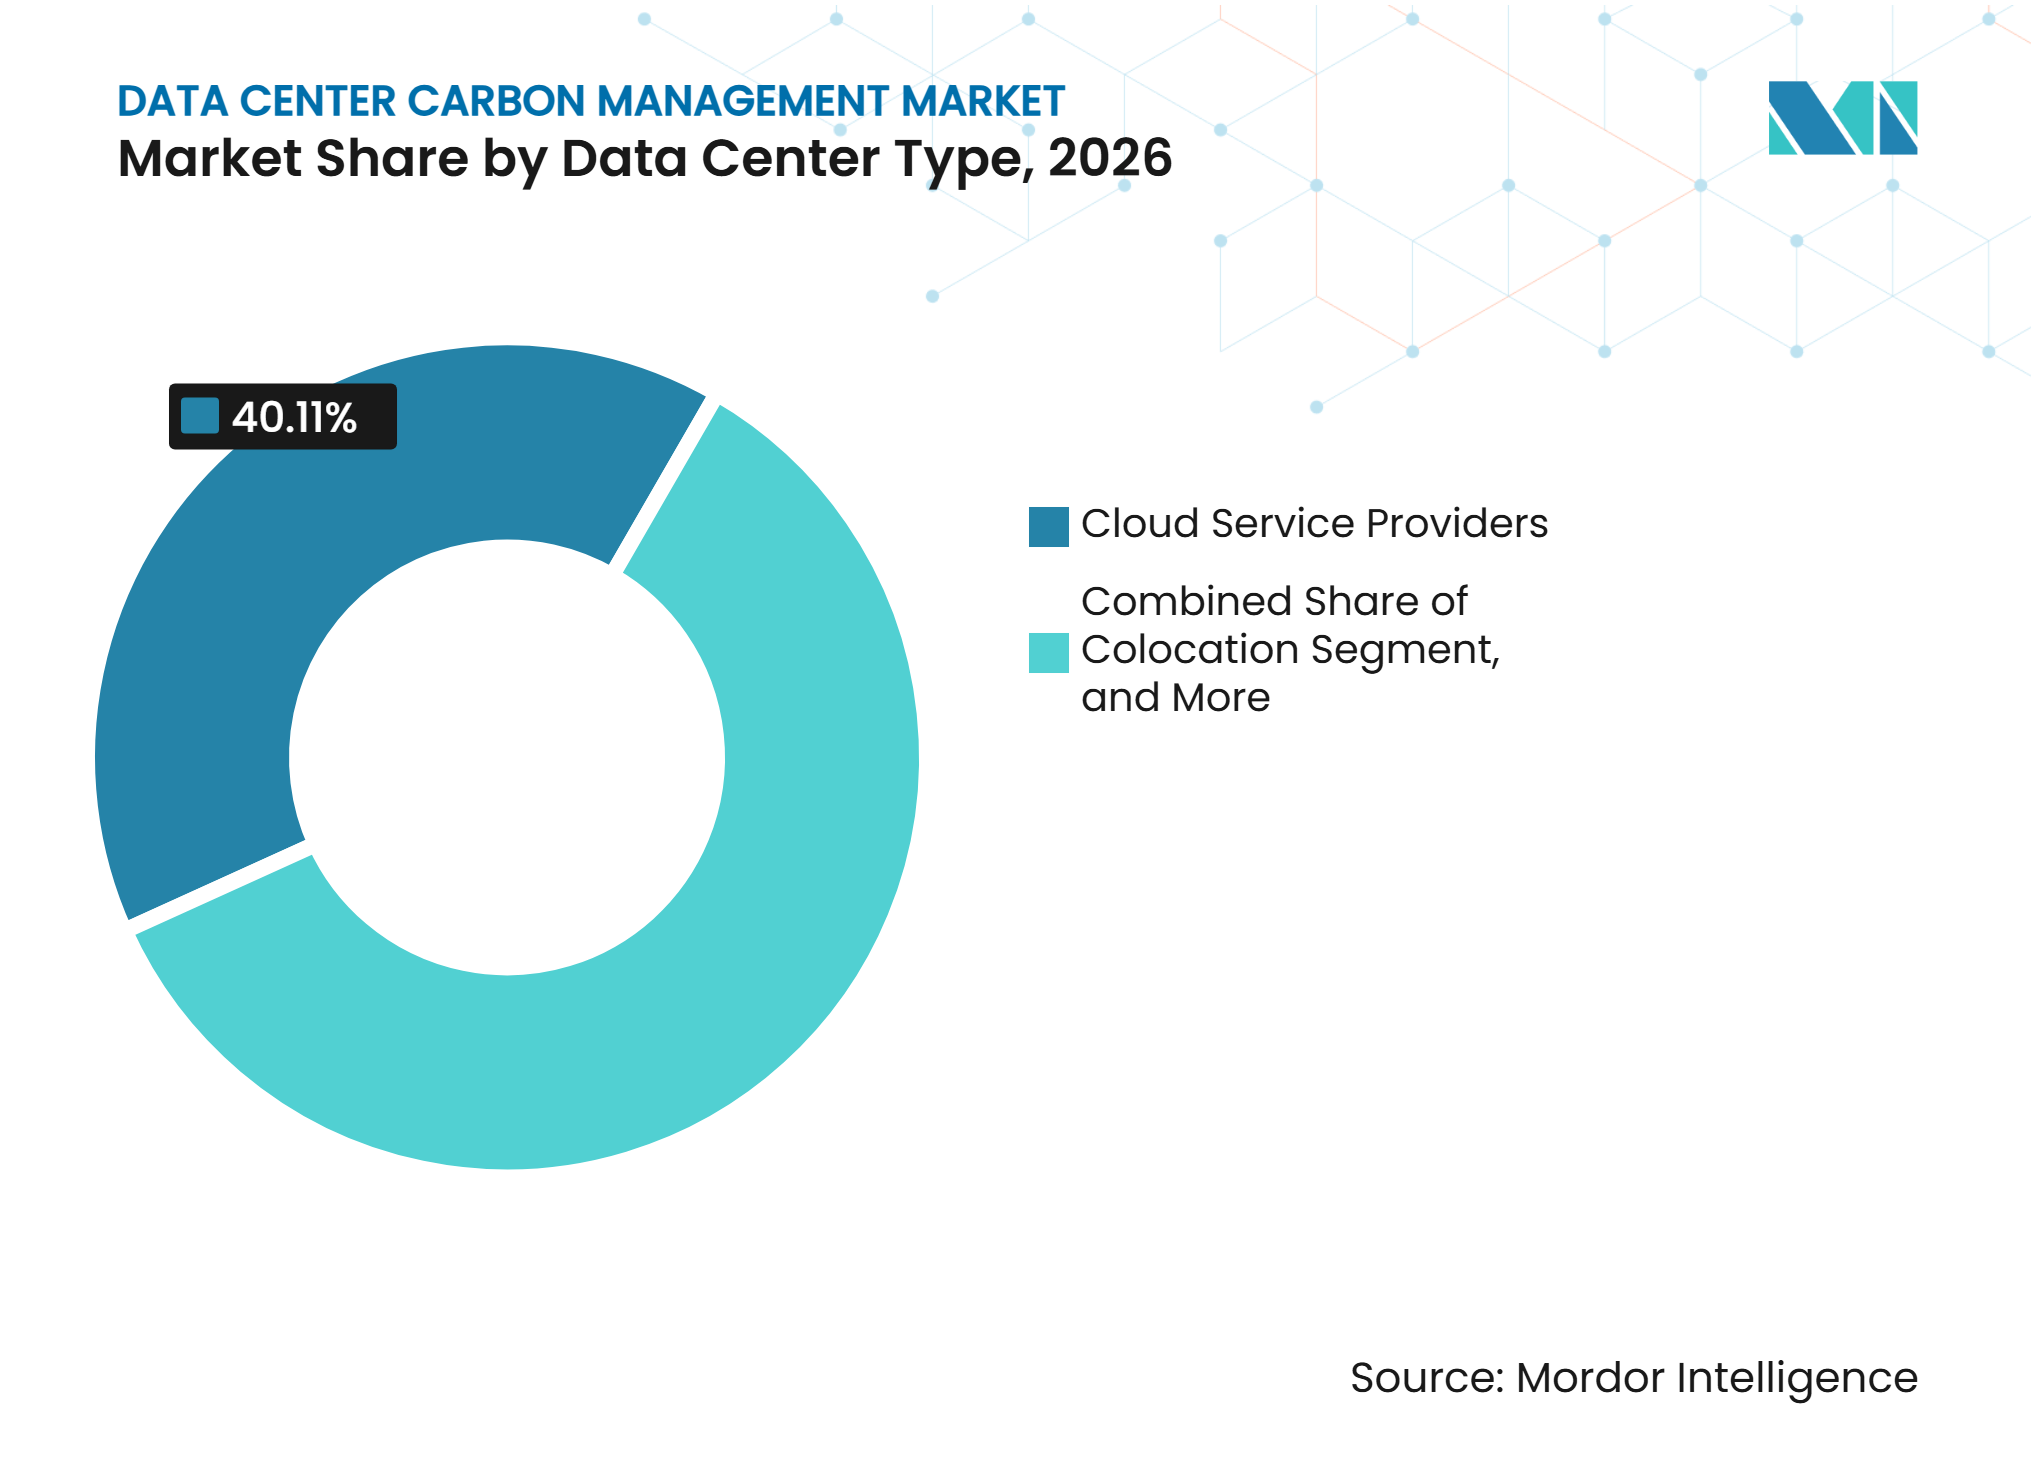
- By data center type, cloud service providers held a 40.11% share in 2026 and are projected to expand at a 20.28% CAGR through 2032.
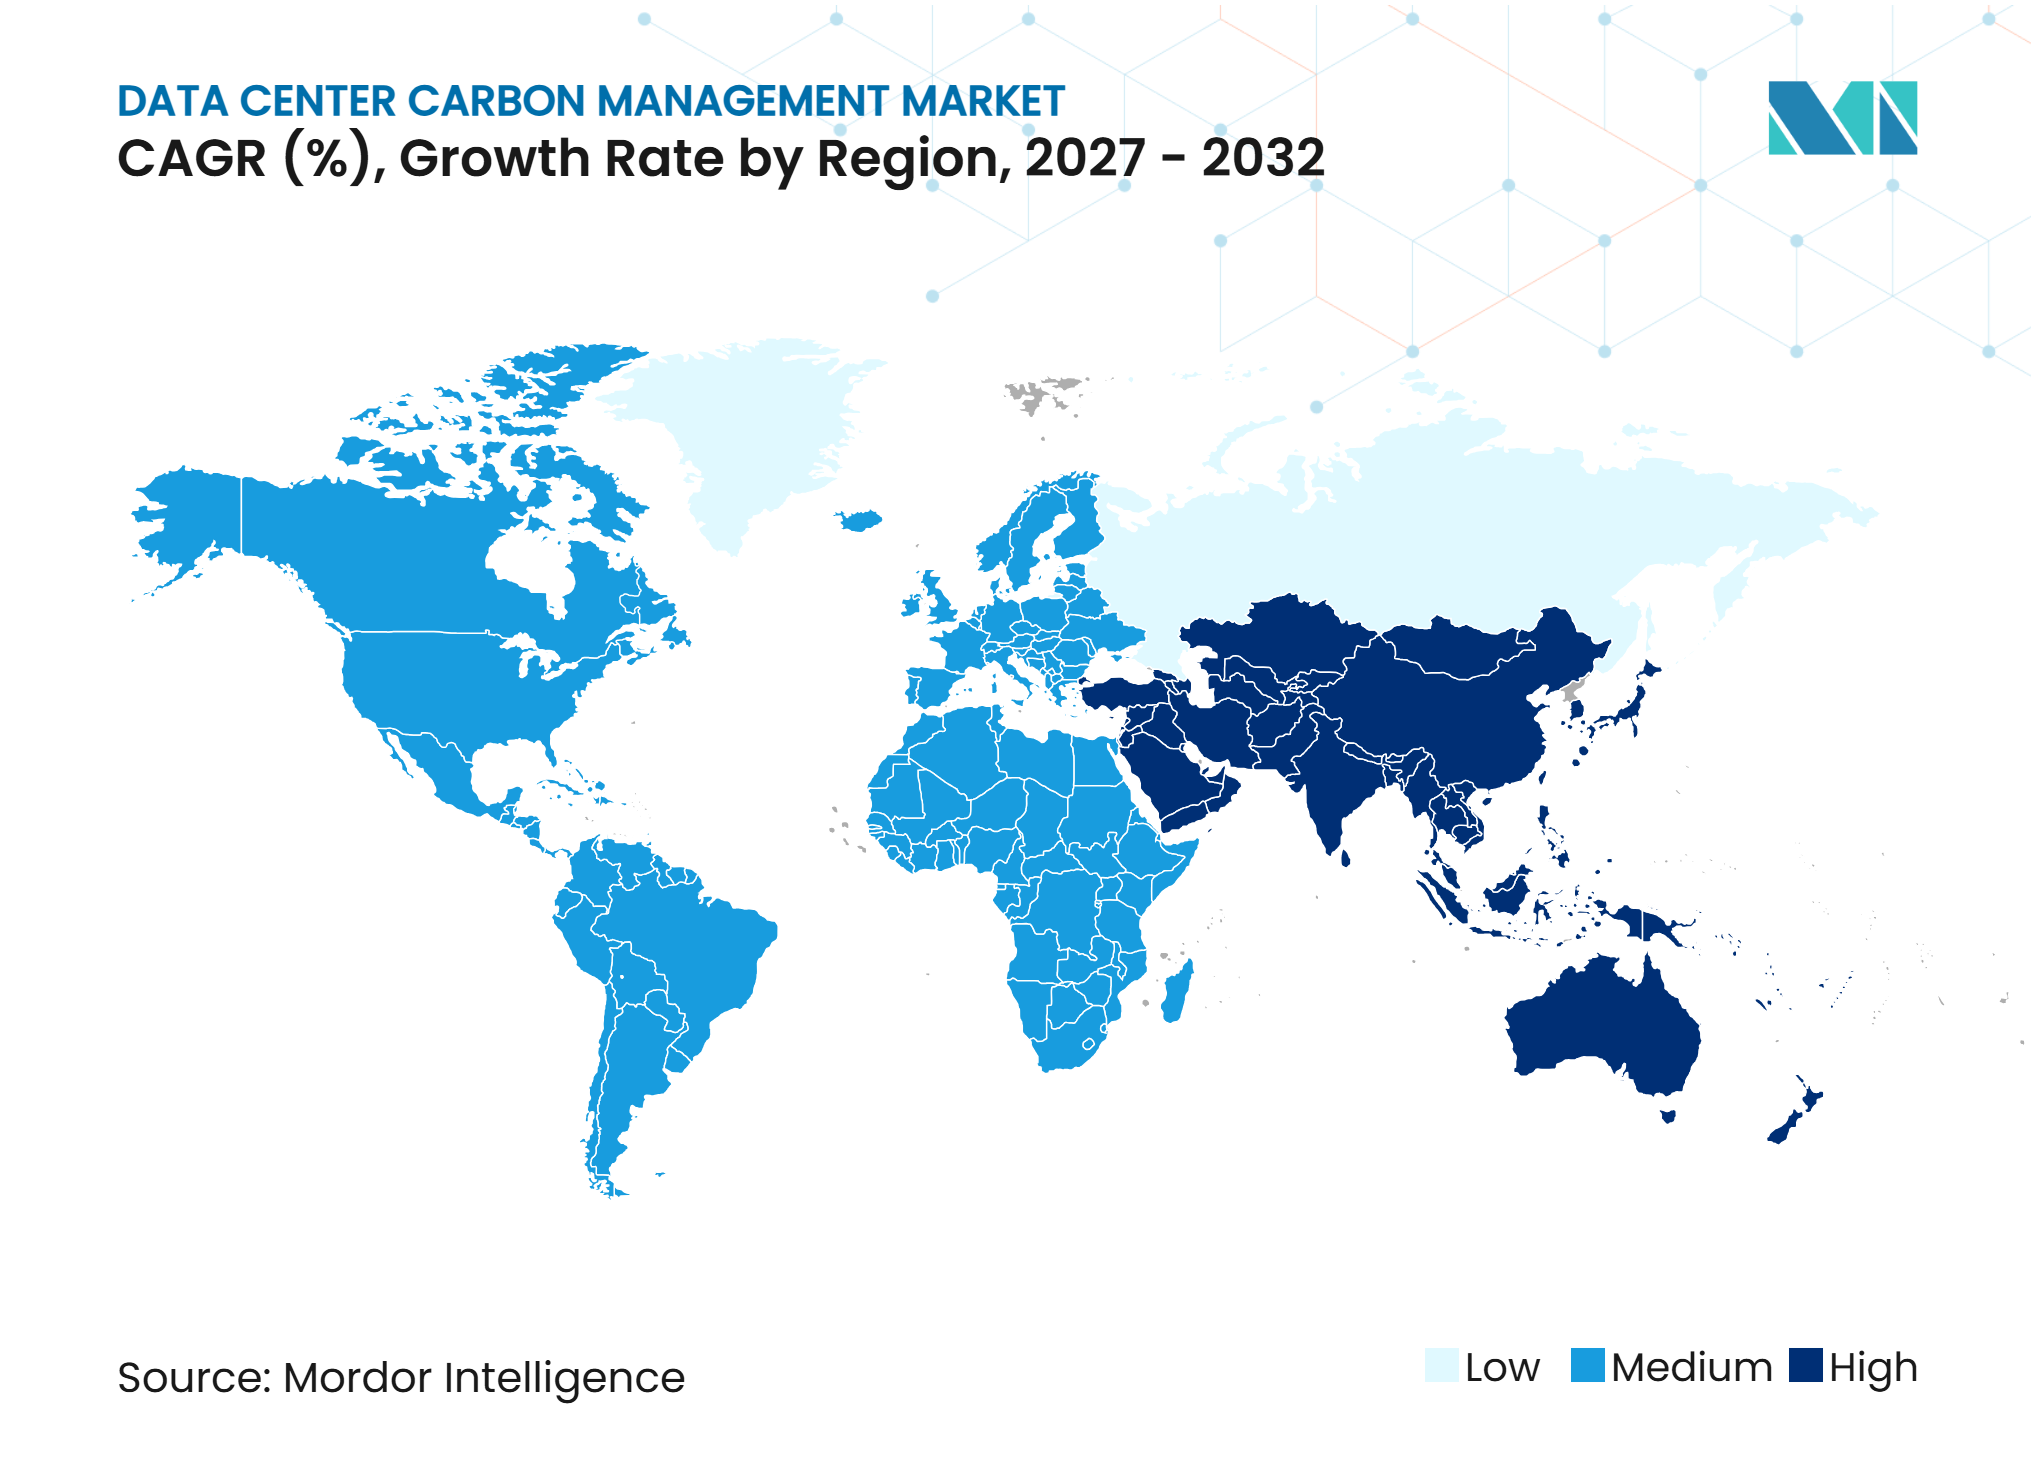
- By geography, North America held a 40.63% share in 2026, while Asia-Pacific is projected to expand at a 20.58% CAGR through 2032.
Note: Market numbers in this report are based on Mordor Intelligence's proprietary estimation framework, which combines nine months of actuals with Q4 projections for base year 2026.
Market Trends and Insights
Drivers Impact Analysis of Data Center Carbon Management Market*
| Driver | (~) % Impact on CAGR Forecast | Geographic Relevance | Impact Timeline |
|---|---|---|---|
| Corporate Net-Zero and Decarbonization Commitments | +4.5% | Global, with early concentration in North America and Europe | Long term (≥ 4 years) |
| Rising Electricity Consumption and Associated Emissions | +3.9% | Global, particularly North America and Asia-Pacific core | Medium term (2-4 years) |
| Expansion of Emissions Disclosure and Sustainability Reporting Requirements | +3.5% | Europe and North America, with spillover to Asia-Pacific | Medium term (2-4 years) |
| Demand for Carbon Accounting and Emissions Monitoring Platforms | +3.0% | Global | Short term (≤ 2 years) |
| Growing Focus on Scope 3 Emissions Across Supply Chains | +2.0% | Global, with early gains in Europe and North America | Medium term (2-4 years) |
| AI Workload Growth and Need for Time- and Location-Based Carbon Optimization | +1.8% | North America and Asia-Pacific core markets | Long term (≥ 4 years) |
| Source: Mordor Intelligence | |||
Corporate Net-Zero and Decarbonization Commitments
Hyperscale and colocation operators are turning net-zero pledges into obligations that require verified emissions records at annual and interim milestones. AWS has committed to net-zero carbon emissions across its global operations by 2040 through The Climate Pledge, with work covering data center efficiency, supply chain engagement, and carbon removal procurement. NTT Global Data Centers targets net-zero Scope 1 and Scope 2 emissions by 2030 and value-chain net-zero by 2040, supported by measured progress reporting.[1] These commitments extend beyond operators because cloud customers increasingly request emissions data for their own reporting. Meta also plans to reduce Scope 1 and Scope 2 emissions by 42% from its 2021 baseline by 2031 and enable two-thirds of suppliers to set science-aligned targets by 2026. The data center carbon management market, therefore, favors platforms that consolidate information from multiple clouds and sites into a single report.
Rising Electricity Consumption and Associated Emissions
Electricity demand from data centers increased strongly in 2025, while AI workloads raised the importance of when and where electricity is consumed. The International Energy Agency expects global data center electricity consumption to reach 945 TWh by 2030, more than double its 2024 level in its base case. The carbon profile of a facility increasingly depends on grid conditions at the time a workload runs, rather than energy efficiency alone. Research indicates that scheduling AI workloads when renewable electricity is abundant can reduce emissions by 10% in grids with high renewable penetration. Operators on carbon-intensive grids must measure a wider emissions difference and explain it to customers and regulators. This makes location-based emissions factors, grid-aware scheduling, and continuous electricity monitoring more relevant across the data center carbon management market.
Expansion of Emissions Disclosure and Sustainability Reporting Requirements
Reporting requirements are creating more immediate demand for records that can be reviewed across multiple jurisdictions. California SB-253 requires Scope 1 and Scope 2 reporting beginning in 2026, and Scope 3 disclosure beginning in 2027, for covered companies operating in the state. The proposed Clean Cloud Act of 2025 would establish Environmental Protection Agency-administered emissions standards and fees for data centers exceeding 100 kW of capacity. In Europe, the recast Energy Efficiency Directive requires large data centers to report energy and sustainability information, and the European Commission published measures for annual energy performance labels in 2026. Organizations subject to multiple rules need a consistent, auditable record rather than separate regional reports. Vendors with templates aligned with the ESRS E1, the GHG Protocol, and California reporting schedules are better positioned to support these buyers.
Demand for Carbon Accounting and Emissions Monitoring Platforms
Carbon accounting platforms are becoming necessary where operators need live data ingestion, emissions-factor mapping, and a documented audit trail. In October 2025, the Open Compute Project Foundation and iMasons Climate Accord released the Embodied Carbon Disclosure, OCP Base Specification for data center equipment and materials. The framework gives operators a common way to request data on servers, cooling equipment, construction materials, and other Scope 3 inputs. It also underscores the importance of supplier-level primary data over generic estimates. Watershed added AI-supported utility bill ingestion and Scope 3 mapping features during 2025 and 2026, reducing manual work in emissions collection. As reporting moves from periodic disclosure toward operating data, the data center carbon management market is likely to reward platforms that link measurement to decisions on power, procurement, and equipment.
Restraints Impact Analysis of Data Center Carbon Management Market*
| Restraint | (~) % Impact on CAGR Forecast | Geographic Relevance | Impact Timeline |
|---|---|---|---|
| Complexity of Measuring Emissions Across Distributed Data Center Operations | -2.0% | Global | Medium term (2-4 years) |
| Inconsistent Emissions Accounting Methodologies and Data Availability | -1.7% | Global | Long term (≥ 4 years) |
| Difficulty of Collecting Supplier and Scope 3 Emissions Data | -1.4% | Global, most acute in Asia-Pacific and South America | Medium term (2-4 years) |
| Costs of Carbon Measurement, Reporting, and Verification | -1.1% | Most acute for smaller and mid-size data center operators | Short term (≤ 2 years) |
| Source: Mordor Intelligence | |||
Complexity of Measuring Emissions Across Distributed Data Center Operations
Operators with colocation, cloud, and edge facilities face difficulty assembling comparable data across different infrastructure estates. A single portfolio can use multiple electricity suppliers, power-use effectiveness methods, and renewable energy certificate retirement practices. A 2025 peer-reviewed study found that major hyperscalers did not report AI-specific electricity consumption or location-based Scope 2 emissions at the individual data center level. This lack of detail limits the quality of a consolidated carbon account. The issue can be more difficult after acquisitions, when inherited assets have incomplete metering or missing emissions-factor records. Longer assessment and onboarding periods can delay platform deployment even where the buyer accepts the need for the service.
Inconsistent Emissions Accounting Methodologies and Data Availability
Data center operators still use different approaches for market-based and location-based Scope 2 accounting, emissions factors, and operational boundaries. As a result, similar facilities can report materially different results. The iMasons Climate Accord Maturity Model provides a voluntary structure for harmonized disclosure, but its adoption remains uneven across regions. Changes in European sustainability reporting requirements have also added uncertainty for companies deciding what level of detail will remain necessary. Buyers may delay decisions while they assess the reporting standard their auditors will accept. These factors place more value on flexible platforms that document calculation methods, retain source data, and adapt to changing rules.
*Our forecasts treat driver/restraint impacts as directional, not additive. The impact forecasts reflect baseline growth, mix effects, and variable interactions.
Data Center Carbon Management Market Segment Analysis
By Solution Type:
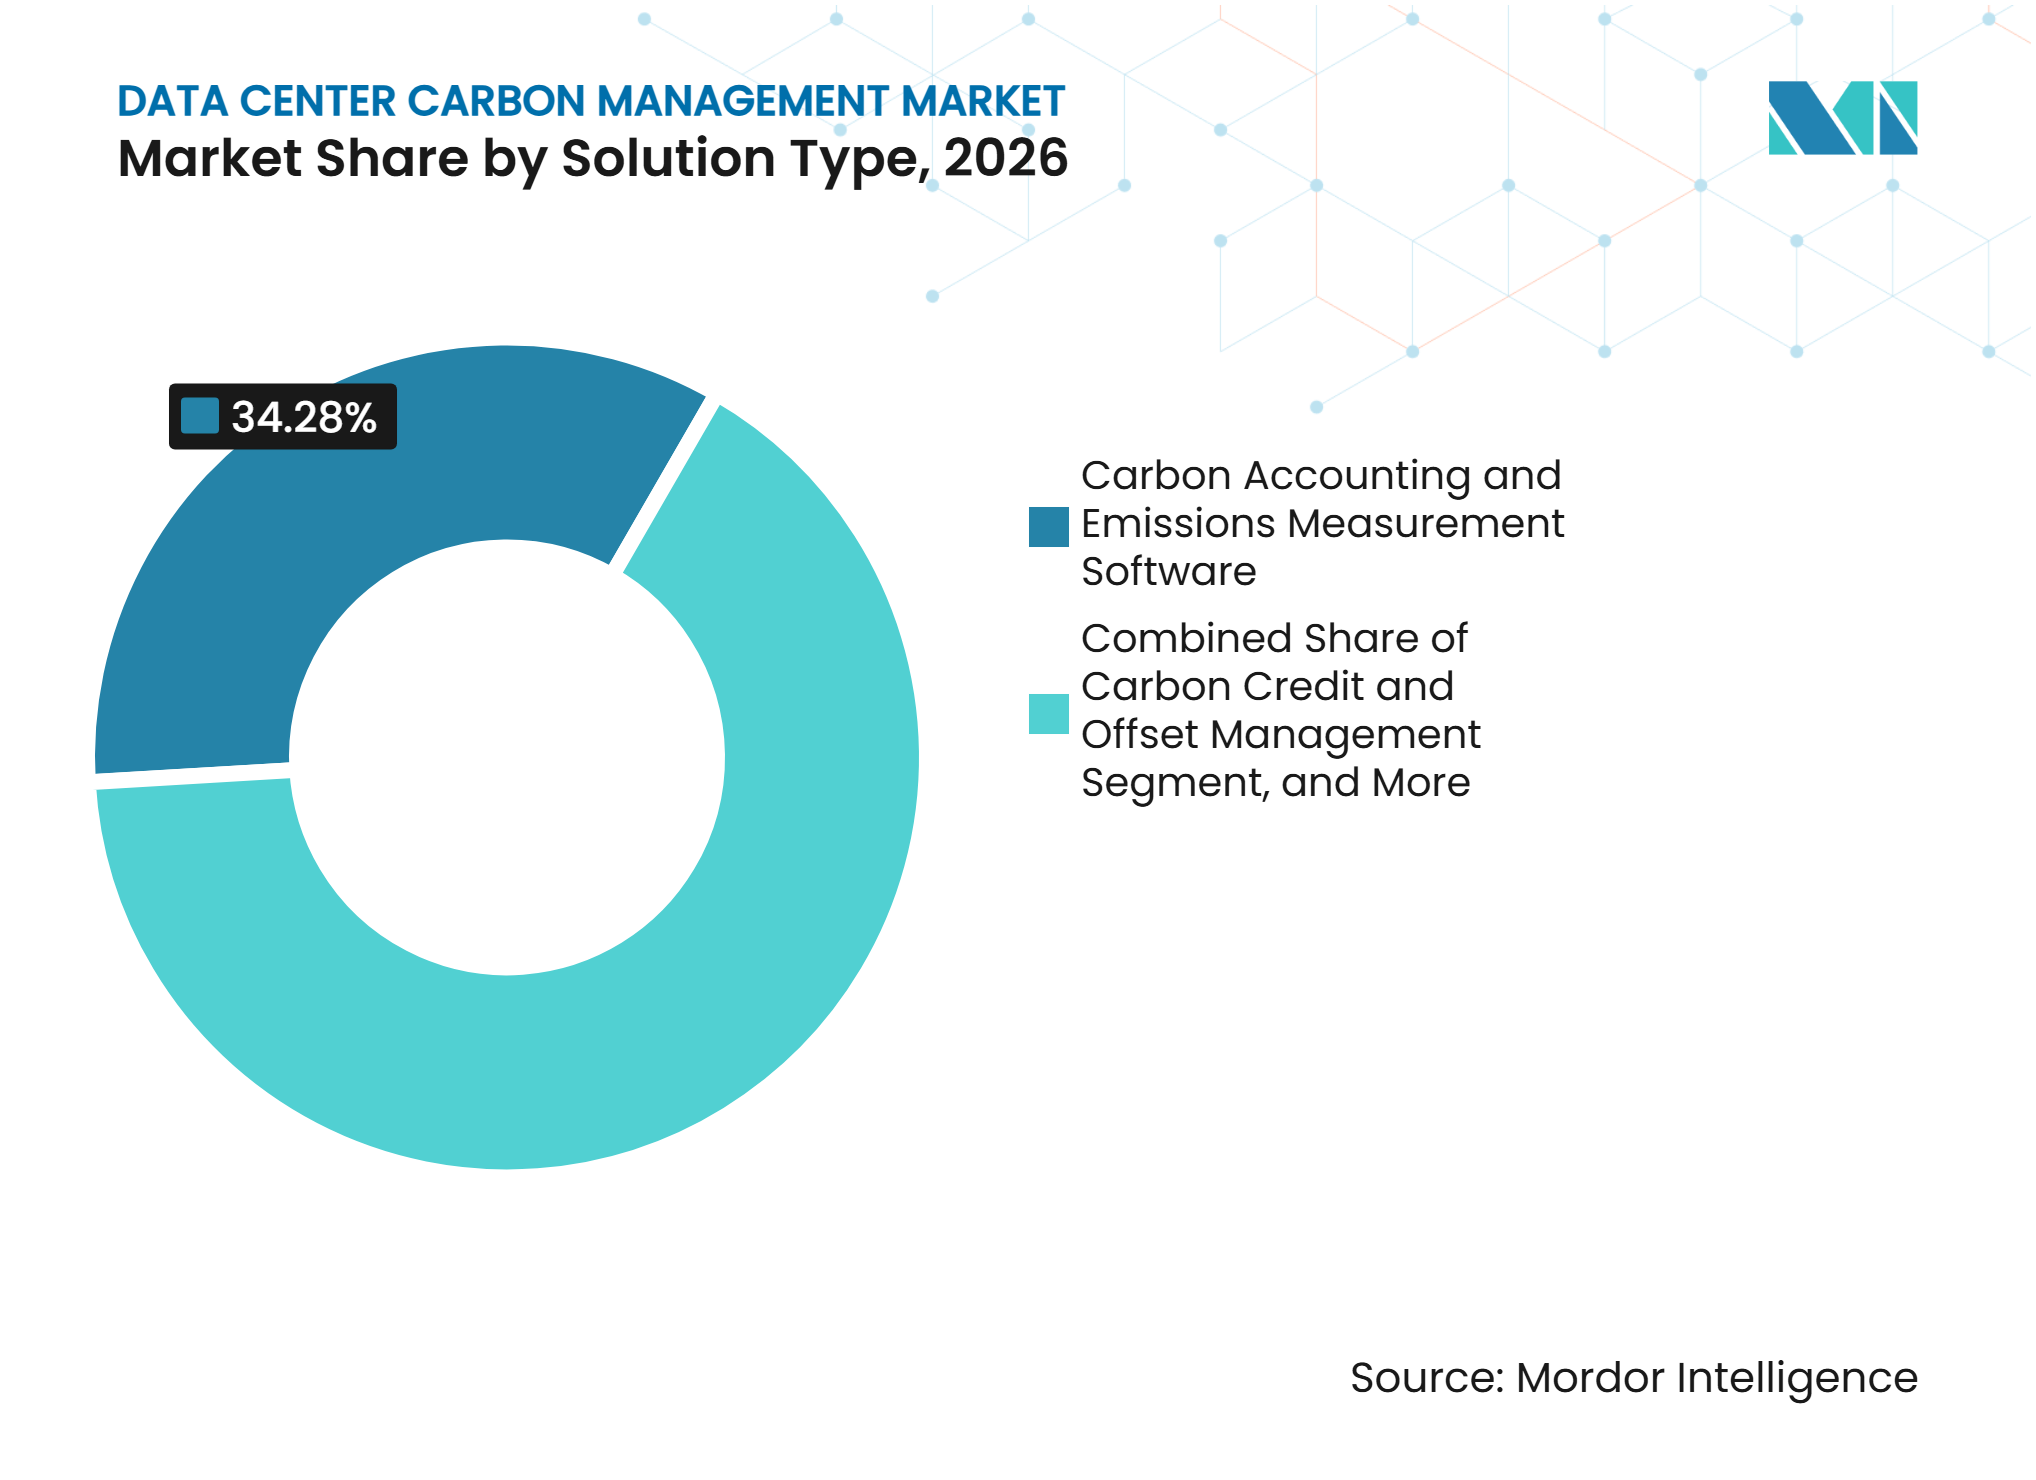
Software Platforms Anchor Carbon MeasurementCarbon accounting and emissions measurement software held 34.38% of the data center carbon management market share by solution type in 2026. This position reflects the compliance-first purchasing pattern used by many operators. They need a defensible baseline before they can plan reductions or manage carbon removal. Measurement software gathers activity data, applies emissions factors, and prepares disclosure outputs. It also provides sustainability teams with a common record of electricity, refrigerants, fuels, and supplier information. Emissions monitoring and reporting platforms form the next important category. These tools are most relevant where operators need continuous information from energy systems instead of manually assembled periodic reports.
Carbon removal and permanent storage solutions are projected to expand at a 20.79% CAGR from 2027 to 2032. They address residual emissions that cannot be eliminated by efficiency projects or renewable energy procurement. High-integrity removal instruments require careful tracking of delivery, permanence, and verification. Carbon credit and offset management tools therefore remain useful, but buyers increasingly assess credit quality before making a purchase. Carbon advisory, verification, and assurance services support the underlying process by testing calculations and documentation. The OCP and iMasons disclosure specification also strengthens attention to embodied emissions in equipment and materials. The data center carbon management market is moving from a measurement-only requirement toward a broader workflow that connects data, planning, assurance, and emissions action.



By Emissions Scope:
Scope 3 Accelerates Disclosure ComplexityScope 2 accounted for 49.21% of the data center carbon management market size by emissions scope in 2026. Purchased electricity is the most established part of an operator’s emissions program. Renewable energy certificates and power purchase agreements have also made Scope 2 easier to address than value-chain emissions. Scope 1 remains smaller because it primarily covers sources such as diesel backup generators and refrigerants. However, regulatory attention to these sources is rising. Illinois enacted SB 0025 in 2026, requiring diesel-powered data center backup generators to meet Environmental Protection Agency Tier 4 Final standards. This creates a stronger reason to connect facility asset data with the carbon record.
Scope 3 is projected to expand at a 20.19% CAGR from 2027 to 2032. Hardware manufacturing, construction materials, logistics, and outsourced services are central to this category. The ICEF Sustainable Data Centers Roadmap states that embodied emissions can exceed 40% of lifetime emissions when a facility primarily uses low-carbon electricity. AWS expanded its Customer Carbon Footprint Tool methodology to include relevant embodied carbon categories for IT hardware, buildings, and non-IT equipment. ESRS E1 also increases the relevance of Scope 3 information in transition plans. Operators need supplier questionnaires, equipment-level disclosures, and clear allocation methods to make this information usable. These requirements make Scope 3 a more difficult but increasingly important area of the data center carbon management industry.
By Deployment Model:
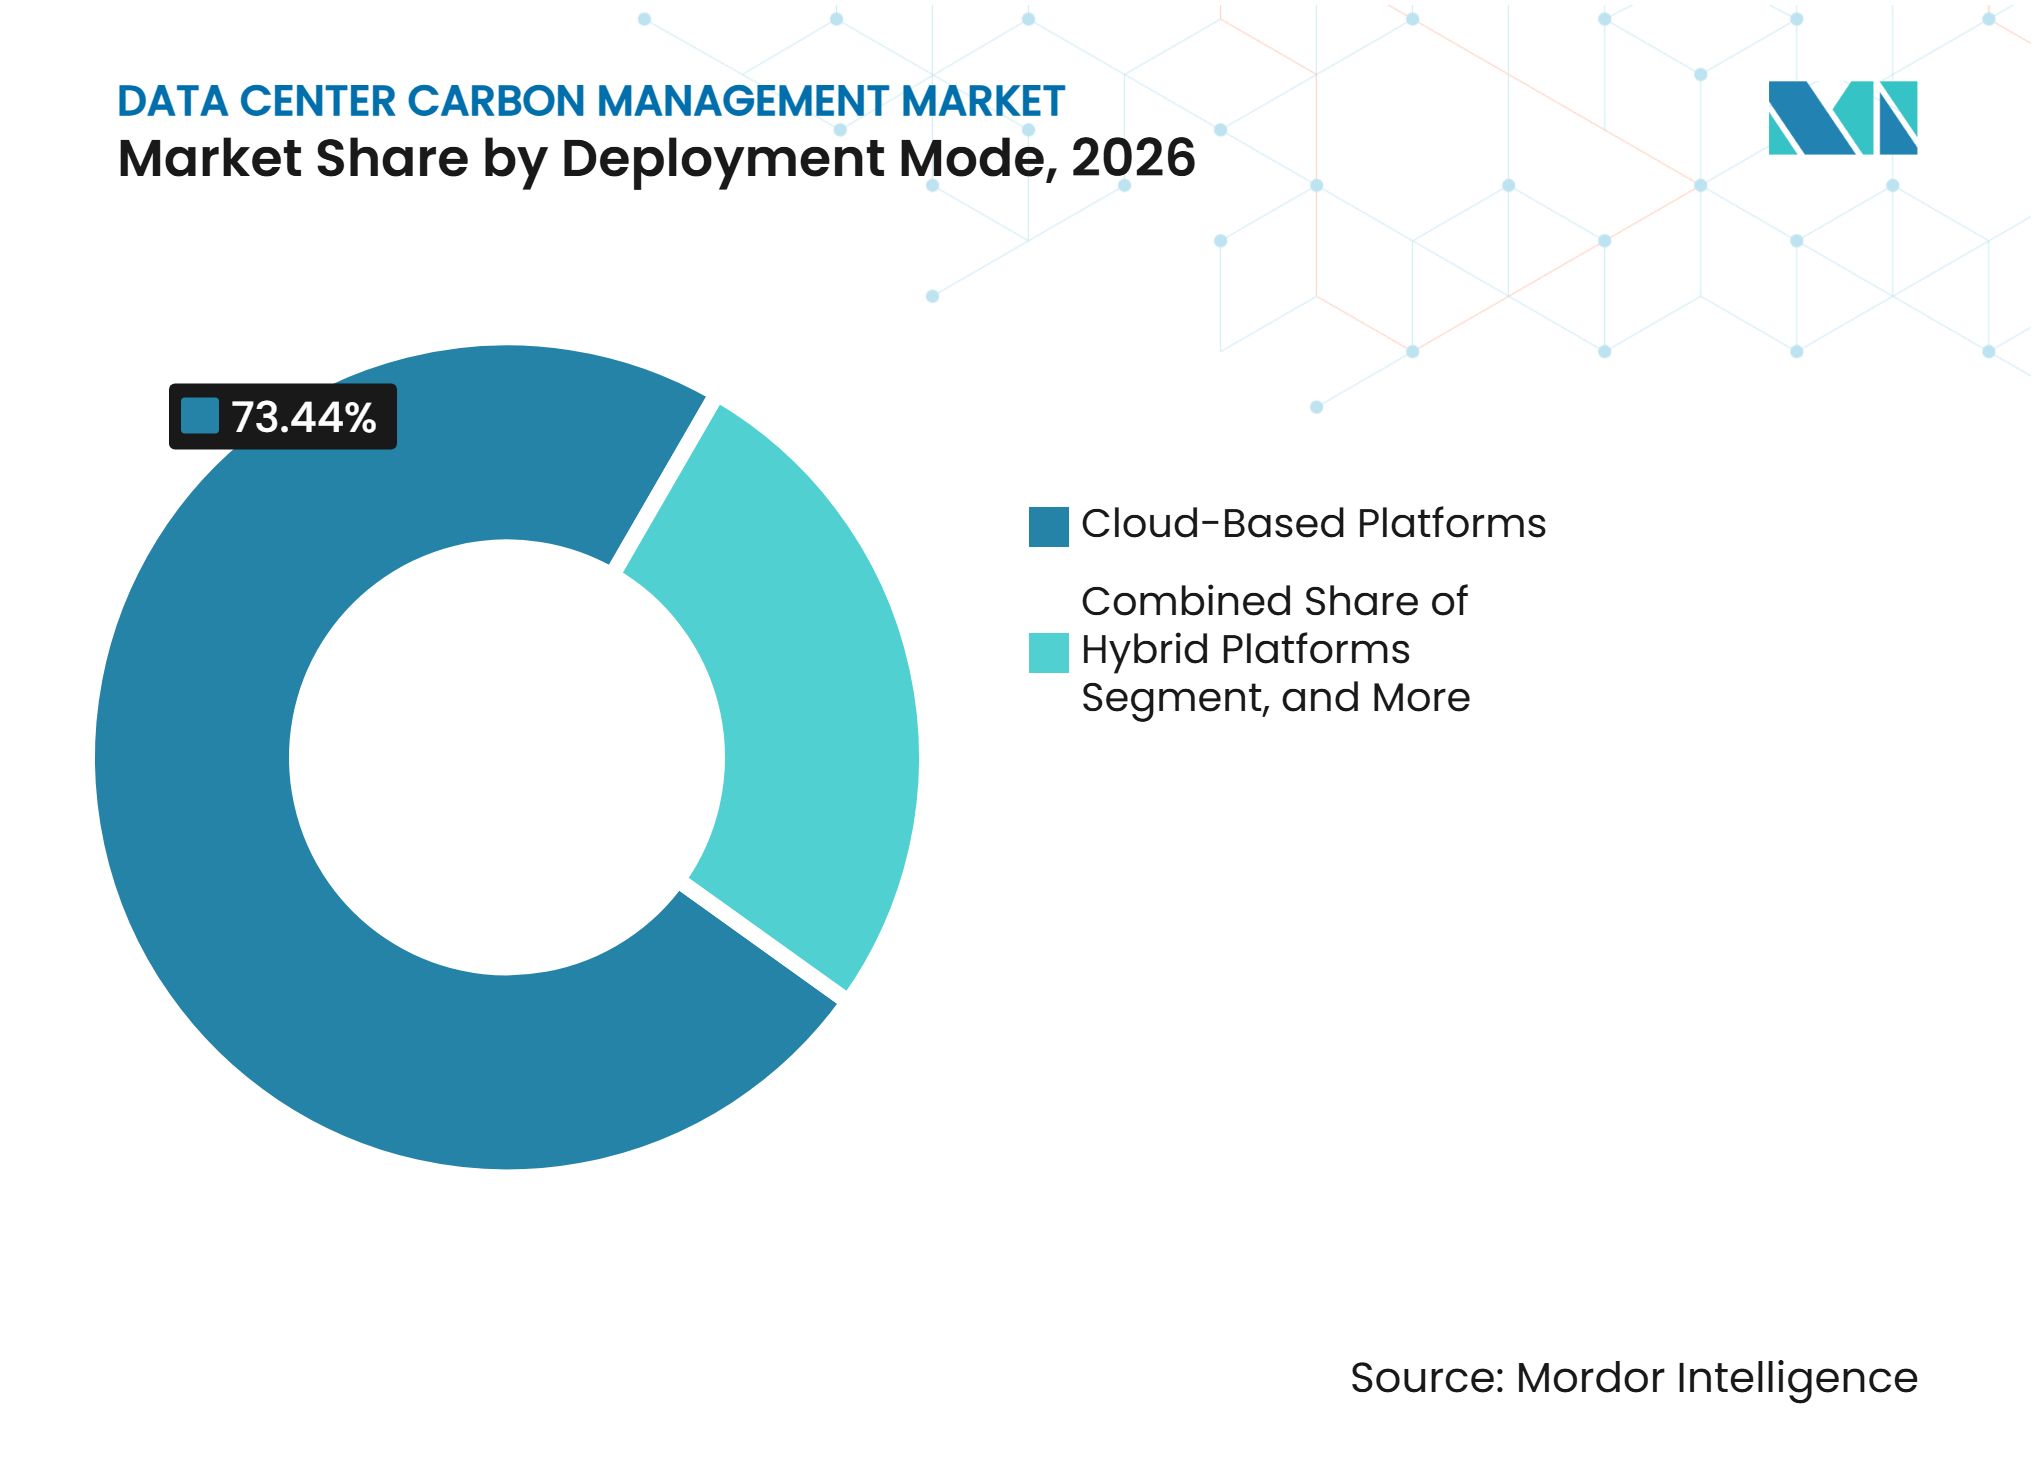
Cloud Deployment Commands Platform AdoptionCloud-based platforms held a 73.44% share of the deployment model segment in 2026 and are projected to expand at a 20.17% CAGR through 2032. Cloud delivery allows software providers to update emissions factors and reporting templates without local system upgrades. It can also connect directly to cloud-provider accounts, energy systems, and billing records. This reduces the internal technology burden for operators entering carbon accounting. OUTSCALE launched its Carbon Footprint service in November 2025 with account-level, service-level, and emissions-source information for cloud users. Such tools show how carbon information is becoming part of the cloud service experience. The data center carbon management market benefits when measurement is built into existing operating systems rather than treated as a separate project.
On-premises platforms remain relevant where data residency, classified workloads, or strict connectivity policies limit cloud use. These systems can provide direct control over data handling, but they may require more local maintenance. Hybrid models combine on-site metering with cloud-based analytics and reporting. They help organizations unify legacy facilities and multi-cloud deployments within a single account. Watershed made its European data residency capability generally available in August 2025. This capability addresses data sovereignty needs without requiring a full return to on-premises architecture. As cloud vendors add regional processing options, the distinction between deployment models may increasingly rest on governance needs rather than software capability.

By Service Type:
Accounting Services Lead, Implementation Gains GroundCarbon accounting and reporting services accounted for 30.21% of the service-type segment in 2026. Many organizations select managed services for their first reporting cycle because they lack internal carbon accounting teams. These providers support data collection, calculation design, and preparation of disclosures. Auditing and verification services are becoming more important as reporting frameworks require stronger evidence. Decarbonization strategy services also help operators identify efficiency investments, renewable procurement options, and target-setting pathways. Rackspace Technology received approval from the Science Based Targets initiative for its near-term and net-zero targets in July 2025, including a 50% emissions reduction commitment by 2032 from a 2023 baseline. This type of target-setting work creates a clear role for structured advisory support.
Implementation of carbon reduction programs is projected to expand at a 20.56% CAGR from 2027 to 2032. Buyers are moving beyond measurement and planning into execution of power purchase agreements, cooling retrofits, power infrastructure upgrades, and carbon-aware workload scheduling. Implementation work requires a link between reported emissions and operational decisions. Carbon credit procurement and management services can help bridge the gap between current emissions and near-term commitments. ISO 14064 and GHG Protocol requirements are relevant because customers increasingly want service outputs that can be checked against recognized methods. Smaller operators may use a managed approach to avoid the cost of building a large internal team. The data center carbon management market therefore creates an opportunity for services that translate emissions data into documented actions.
By Primary Application:
Disclosure Drives Initial AdoptionEmissions measurement and disclosure held 33.86% of the primary application segment in 2026. This share reflects the need to meet GHG Protocol, CSRD, and California reporting expectations. Most operators begin by establishing a baseline and preparing reports that can be reviewed by customers, investors, and regulators. Carbon reduction planning is a related application because organizations need a quantified pathway once the baseline is established. It supports decisions on energy efficiency, equipment investments, and renewable electricity procurement. Supply chain emissions management covers hardware suppliers, logistics firms, and subcontracted data center services. Audit questions on embodied carbon are making this application more important for operators with global supply chains.
Renewable energy and electricity emissions tracking is projected to expand at a 20.74% CAGR from 2027 to 2032. The application helps operators distinguish annual renewable procurement from the carbon intensity of electricity used at each time and location. It also supports decisions on workload timing in regions with variable renewable output. Research in Nature Reviews Clean Technology found that grid-integrated AI workload management can reduce emissions by 10% in high-renewable-penetration grids. Carbon offset and removal management remains relevant where direct reductions cannot address all emissions. Net-zero target monitoring enables management teams to track progress against interim milestones. These applications show that the data center carbon management market is becoming more closely linked to electricity operations and procurement.
By Data Center Size:
Hyperscale Operators Set Decarbonization BenchmarksHyperscale facilities held 44.79% of the data center carbon management market share by data center size in 2026 and are projected to expand at a 20.34% CAGR through 2032. Their scale creates a large electricity and supply-chain footprint, as well as greater scrutiny from investors and enterprise customers. Major operators are publishing carbon methodologies that cover Scope 1, Scope 2, and Scope 3 emissions across global estates. Microsoft has integrated sustainability capabilities into its Dynamics 365 environment, bringing carbon data closer to procurement and financial workflows. This makes carbon management part of operating information rather than a standalone sustainability record. Mid-market operators may be expected to provide comparable evidence when seeking large customer contracts. Hyperscale practices can therefore influence requirements throughout the data center carbon management industry.
Large data centers below hyperscale scale are expanding programs in response to colocation tenant requests and corporate disclosure rules. They often have significant load but fewer dedicated sustainability staff than the largest operators. Medium and small facilities may depend more on managed service providers or cloud-based tools. These operators need simpler data collection and lower implementation costs. The ASEAN Guide for Sustainable Data Center Development identifies legacy infrastructure and fossil-fuel-dependent grids as obstacles for operators in emerging markets. Lightweight platforms can help address these gaps without requiring a major local technology program. This gives vendors a route to serve facilities that are earlier in their carbon management adoption.
By Data Center Type:
Cloud Providers Lead Carbon Accountability ProgramsCloud service providers held a 40.11% share of the data center type segment in 2026 and are projected to expand at a 20.28% CAGR through 2032. Their customers are increasingly using provider emissions information in sourcing and reporting decisions. This makes carbon transparency a commercial and compliance requirement. AWS, Google Cloud, and Microsoft provide customer-facing carbon tools that link usage data to emissions estimates. These tools shift part of the reporting process from the operator to the customer. They also make emissions information visible alongside cloud consumption data. In the data center carbon management market, this connection can support retention and differentiate cloud services for customers with disclosure obligations.
Colocation operators must provide tenants with granular energy and emissions information because tenants retain important reporting responsibilities. Their data must be sufficiently credible to be entered into the tenant’s Scope 2 and Scope 3 records. Enterprise and edge facilities face a different position because their infrastructure may be older and less extensively metered. They can also have limited budgets for specialized sustainability systems. The iMasons Climate Accord works toward common carbon measurement practices for digital infrastructure operators. Open approaches could lower the technical barrier for smaller facilities seeking audit-ready data. This creates an opportunity for providers to combine standard reporting with simple integration into mixed infrastructure environments.
Geography Analysis
North America
North America accounted for 40.63% of the global data center carbon management market in 2026. The region contains the highest concentration of hyperscale infrastructure and a large base of corporate sustainability buyers. California SB-253 requires covered companies to prepare Scope 1 and Scope 2 disclosures starting in 2026, and Scope 3 disclosures starting in 2027. The proposed Clean Cloud Act also signals a stronger policy focus on data center emissions and electricity use. These rules increase demand for records that are consistent across facilities, suppliers, and customer accounts. The United States remains a major location for cloud capacity, which makes customer carbon tools commercially relevant. Canada adds lower-carbon power options in hydroelectric provinces, but operators with cross-border estates still need to account for hardware and supplier emissions. Regulatory influence and customer due diligence support adoption of audit-ready platforms across the region.
Asia-Pacific
Asia-Pacific is projected to expand at a 20.58% CAGR from 2027 to 2032. Regional data center power capacity is projected to increase from 16 GW in 2025 to 70 GW by 2030. This expansion increases the need to measure electricity emissions while new capacity is being developed. Fossil-fuel grid dependence remains a structural issue in several major markets. The ASEAN sustainable data center guide identifies energy efficiency, renewable integration, and standardized reporting as key regional priorities. Singapore’s Digital Infrastructure Bill introduced binding efficiency and clean-energy requirements for larger facilities, while Malaysia requires clean energy for new data centers, and China has set renewable-energy goals for the sector. Carbon tracking, renewable energy accounting, and verification services can help operators respond to these requirements. Asia-Pacific is therefore a significant opportunity for cloud-based tools that can work across different grid conditions and regulatory settings.
Europe, South America, and the Middle East and Africa
Europe has mature compliance demand due to CSRD reporting and the ESRS E1, which bring Scope 1, Scope 2, and Scope 3 information into sustainability reporting for covered companies. The recast Energy Efficiency Directive also requires annual energy and sustainability reporting from large data centers. European Union measures on energy performance labels add public accountability for reporting facilities.[2] South America remains earlier in adoption, although multinational operators can extend their global reporting methods into Brazilian operations before local rules require them. The Middle East and Africa are adding capacity in Saudi Arabia and the United Arab Emirates, where national net-zero plans support the deployment of renewables around new infrastructure hubs. High grid emissions intensity and uneven access to renewables in some markets can increase the value of carbon accounting and verification. These mixed geographies require tools that reflect local electricity conditions while maintaining common reporting methods for multinational operators. This creates a practical role for vendors in the data center carbon management market with flexible frameworks, regional data handling, and established compliance mappings.
Competitive Landscape
Market Concentration
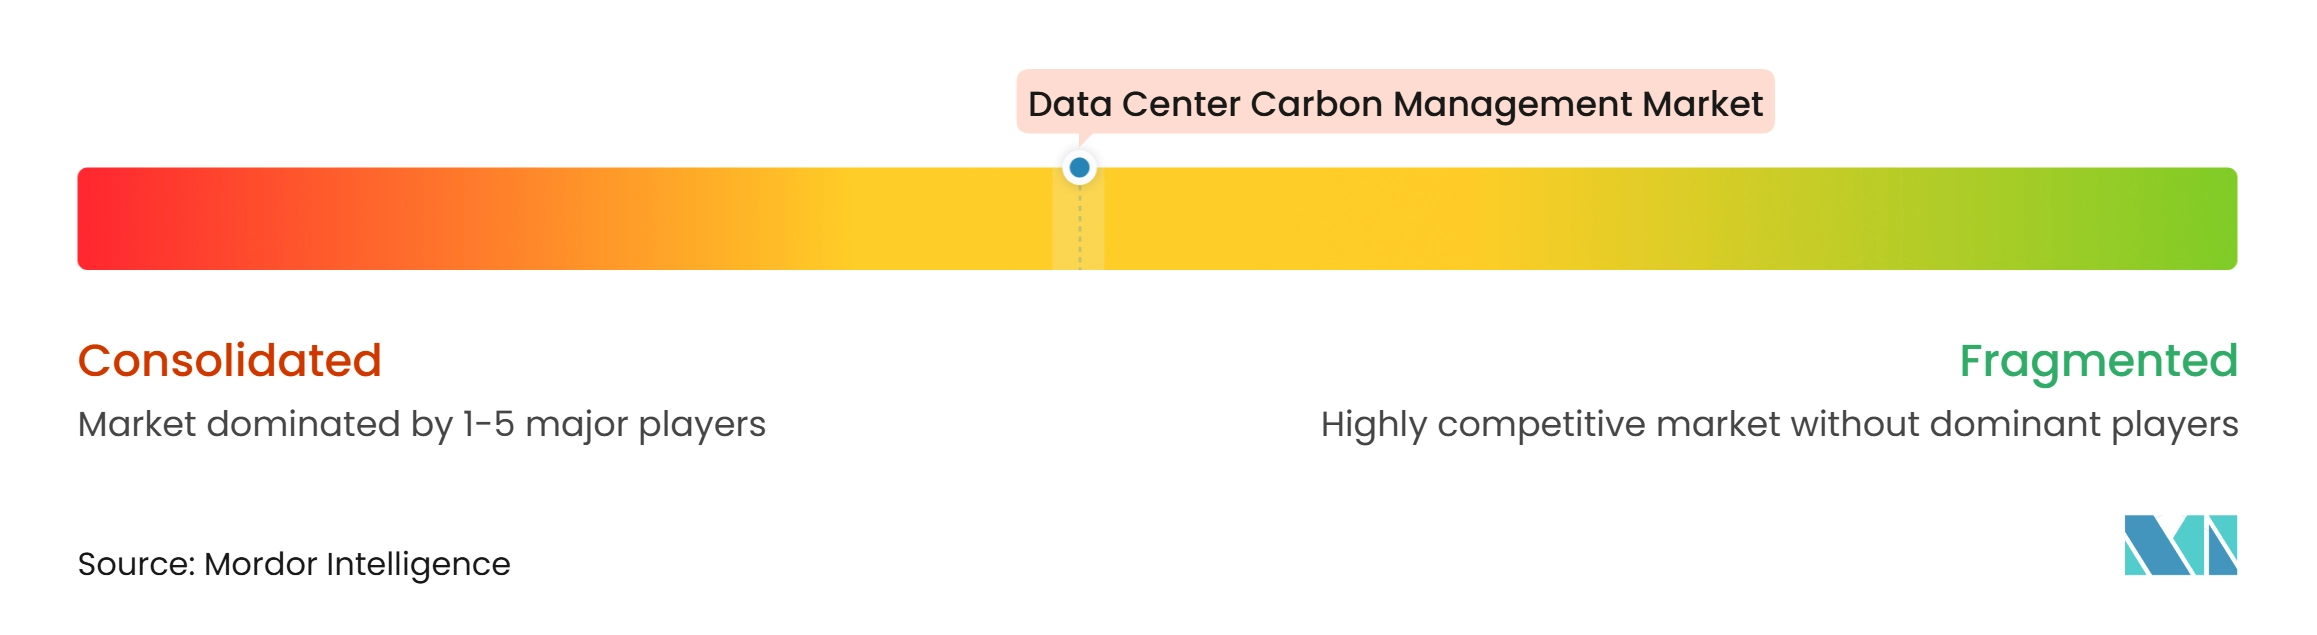
The data center carbon management market has moderate concentration, as leadership is spread among carbon accounting specialists, enterprise platform providers, and industrial energy management companies. Pure-play providers include Watershed, Persefoni, Normative, Greenly, Sweep, and Sphera. They compete on calculation quality, audit readiness, and Scope 3 automation. SAP, Microsoft, IBM, and Salesforce integrate carbon functions into enterprise software that customers already use. Schneider Electric, Siemens, Eaton, and ABB can draw on equipment and energy telemetry to create operational emissions data. This creates different routes to market, spanning sustainability teams, finance, procurement, engineering, and facility operations. No single provider controls every part of the workflow, particularly where suppliers, cloud services, and physical equipment data must be combined.
Competitive strategies increasingly focus on reducing manual data work and embedding carbon information into operating systems. Watershed introduced AI-supported utility bill ingestion and Scope 3 mapping features during 2025 and 2026. Microsoft continued to connect sustainability data with Dynamics 365 processes, including procurement and financial workflows.[3] OUTSCALE launched a sovereign cloud carbon footprint service in November 2025, offering detailed account, service, and emission-source views. These moves reflect a need to make emissions data usable in everyday technology, procurement, and cloud decisions. The data center carbon management market also depends on reporting alignment with the GHG Protocol, ISO 14064, CSRD, and ESRS E1. Vendors that can document calculations and source data clearly have an advantage in formal procurement processes.
The OCP and iMasons embodied carbon disclosure specification highlights an open area in AI workload and embodied Scope 3 measurement. This area remains difficult because operators need information from equipment manufacturers, construction suppliers, energy systems, and cloud services. Cloud-native tools that combine cost management and carbon measurement also seek to reach engineering teams rather than only sustainability functions. Partnerships with verification providers, consultants, and data suppliers can improve the quality of these offerings. Established enterprise and industrial suppliers benefit from existing customer relationships and broad access to data. Specialists can differentiate through ease of use, faster automation, and deeper Scope 3 workflows. Competition in the data center carbon management market is likely to remain active because customers need both credible reports and practical tools to reduce emissions.
Data Center Carbon Management Industry Leaders
-
Schneider Electric
-
IBM Corporation
-
SAP SE
-
Microsoft Corporation
-
Salesforce, Inc.
- *Disclaimer: Major Players sorted in no particular order
Data Center Carbon Management Market Companies Covered in this Report
- Schneider Electric SE
- Salesforce, Inc.
- Watershed Technology, Inc.
- Persefoni AI, Inc.
- Sweep SAS
- Greenly SAS
- Plan A Sustainable Technologies GmbH
- Normative AB
- Sphera Solutions, Inc.
- SAP SE
- International Business Machines Corporation
- Microsoft Corporation
- Salesforce, Inc.
- South Pole Group AG
- ClimatePartner GmbH
- 3Degrees Group, Inc.
- CarbonChain Ltd.
- The Carbon Trust
- DNV AS
- ERM Worldwide Group Limited
- Eaton Corporation plc
- ABB Ltd.
- Siemens AG
- Vertiv Holdings Co.
- Huawei Technologies Co., Ltd.
- Amazon Web Services, Inc.
- Google LLC
- Oracle Corporation
- Accenture plc
- Infosys Limited
Recent Industry Developments in Data Center Carbon Management Market
- November 2026: Microsoft integrated Sustainability Manager into the Dynamics 365 ERP portfolio, rebranding it as Dynamics 365 Sustainability and introducing a Green Ledger view that links carbon data with financial and operational procurement processes. This move positions carbon accounting as core ERP infrastructure for data center operators, rather than a standalone sustainability tool, and is expected to accelerate enterprise adoption by embedding emissions tracking within procurement workflows already operating on Dynamics 365.
- October 2026: The European Commission published a regulation under the recast Energy Efficiency Directive establishing an EU-managed database for data center energy performance, with annual labels issued to facilities reporting under Delegated Regulation (EU) 2024/1364 and valid from August 15 of each year. The public labels, available in all EU official languages, introduce a mandatory transparency layer for data center operators across EU member states, directly expanding compliance scope for carbon measurement and reporting platforms.
- November 2025: OUTSCALE, a brand of Dassault Systèmes, launched Carbon Footprint, a sovereign cloud service enabling IT and CSR teams to measure and manage the estimated carbon footprint of cloud services, integrated into its SecNumCloud 3.2-qualified platform. The service provides account-level, service-level, and emission-source breakdowns and addresses the growing demand for carbon footprint transparency among enterprise cloud users operating under CSRD and other mandatory disclosure frameworks.
- October 2025: The Open Compute Project Foundation and iMasons Climate Accord jointly unveiled the Embodied Carbon Disclosure, OCP Base Specification, the first standardized framework for reporting embodied carbon of data center equipment and materials. Developed with contributions from Google, Meta, Microsoft, and Schneider Electric, the specification targets Scope 3 supply chain carbon disclosure and harmonizes reporting practices across the digital infrastructure ecosystem, with a Carbon Disclosure Ready recognition icon planned for the OCP Marketplace.
Global Data Center Carbon Management Market Report Scope
The Data Center Carbon Management Market encompasses the range of software solutions, digital platforms, technologies, and professional services designed to measure, monitor, report, manage, and reduce greenhouse gas (GHG) emissions associated with data center operations and infrastructure.
The Data Center Carbon Management Market Report is Segmented by Solution Type (Carbon Accounting and Emissions Measurement Software, Emissions Monitoring and Analytics Platforms, Carbon Reduction Planning and Optimization, Carbon Credit and Offset Management, Carbon Removal and Permanent Storage Solutions, and Carbon Advisory, Verification, and Assurance Services), Emissions Scope (Scope 1 Emissions, Scope 2 Emissions, and Scope 3 Emissions), Deployment Model (Cloud-Based Platforms, On-Premises Platforms, and Hybrid Platforms), Service Type (Carbon Accounting and Reporting Services, Emissions Auditing and Verification, Decarbonization Strategy and Consulting, Carbon Credit Procurement and Management, and Carbon Reduction Program Implementation), Primary Application (Emissions Measurement and Disclosure, Carbon Reduction Planning, Renewable Energy and Electricity Emissions Tracking, Supply Chain Emissions Management, Carbon Offset and Removal Management, and Net-Zero Target Monitoring), Data Center Size (Small, Medium, Large, and Hyperscale), Data Center Type (Colocation, Cloud Service Providers, and Enterprise and Edge), and Geography (North America, South America, Europe, Asia-Pacific, and Middle East and Africa). The Market Forecasts are Provided in Terms of Value (USD) and Volume (Million Tons)
Segmentation Overview
| Carbon Accounting and Emissions Measurement Software |
| Emissions Monitoring and Reporting Platforms |
| Carbon Reduction Planning and Optimization |
| Carbon Credit and Offset Management |
| Carbon Removal and Permanent Storage Solutions |
| Carbon Advisory, Verification, and Assurance Services |
| Scope 1 Emissions |
| Scope 2 Emissions |
| Scope 3 Emissions |
| Cloud-Based Platforms |
| On-Premises Platforms |
| Hybrid Platforms |
| Carbon Accounting and Reporting Services |
| Emissions Auditing and Verification |
| Decarbonization Strategy and Consulting |
| Carbon Credit Procurement and Management |
| Carbon Reduction Program Implementation |
| Emissions Measurement and Disclosure |
| Carbon Reduction Planning |
| Renewable Energy and Electricity Emissions Tracking |
| Supply Chain Emissions Management |
| Carbon Offset and Removal Management |
| Net-Zero Target Monitoring |
| Small Data Centers |
| Medium Data Centers |
| Large Data Centers |
| Hyperscale Data Centers |
| Colocation Data Centers |
| Cloud Service Providers (CSPs) |
| Enterprise and Edge Data Centers |
| North America | United States |
| Canada | |
| Mexico | |
| South America | Brazil |
| Chile | |
| Colombia | |
| Argentina | |
| Peru | |
| Rest of South America | |
| Europe | United Kingdom |
| Germany | |
| France | |
| Netherlands | |
| Ireland | |
| Spain | |
| Italy | |
| Nordics | |
| Rest of Europe | |
| Asia-Pacific | China |
| India | |
| Japan | |
| Australia | |
| Singapore | |
| South Korea | |
| Malaysia | |
| Indonesia | |
| Rest of Asia-Pacific | |
| Middle East and Africa | Saudi Arabia |
| United Arab Emirates | |
| Qatar | |
| South Africa | |
| Egypt | |
| Rest of Middle East and Africa |
| By Solution Type | Carbon Accounting and Emissions Measurement Software | |
| Emissions Monitoring and Reporting Platforms | ||
| Carbon Reduction Planning and Optimization | ||
| Carbon Credit and Offset Management | ||
| Carbon Removal and Permanent Storage Solutions | ||
| Carbon Advisory, Verification, and Assurance Services | ||
| By Emissions Scope | Scope 1 Emissions | |
| Scope 2 Emissions | ||
| Scope 3 Emissions | ||
| By Deployment Model | Cloud-Based Platforms | |
| On-Premises Platforms | ||
| Hybrid Platforms | ||
| By Service Type | Carbon Accounting and Reporting Services | |
| Emissions Auditing and Verification | ||
| Decarbonization Strategy and Consulting | ||
| Carbon Credit Procurement and Management | ||
| Carbon Reduction Program Implementation | ||
| By Primary Application | Emissions Measurement and Disclosure | |
| Carbon Reduction Planning | ||
| Renewable Energy and Electricity Emissions Tracking | ||
| Supply Chain Emissions Management | ||
| Carbon Offset and Removal Management | ||
| Net-Zero Target Monitoring | ||
| By Data Center Size | Small Data Centers | |
| Medium Data Centers | ||
| Large Data Centers | ||
| Hyperscale Data Centers | ||
| By Data Center Type | Colocation Data Centers | |
| Cloud Service Providers (CSPs) | ||
| Enterprise and Edge Data Centers | ||
| By Geography | North America | United States |
| Canada | ||
| Mexico | ||
| South America | Brazil | |
| Chile | ||
| Colombia | ||
| Argentina | ||
| Peru | ||
| Rest of South America | ||
| Europe | United Kingdom | |
| Germany | ||
| France | ||
| Netherlands | ||
| Ireland | ||
| Spain | ||
| Italy | ||
| Nordics | ||
| Rest of Europe | ||
| Asia-Pacific | China | |
| India | ||
| Japan | ||
| Australia | ||
| Singapore | ||
| South Korea | ||
| Malaysia | ||
| Indonesia | ||
| Rest of Asia-Pacific | ||
| Middle East and Africa | Saudi Arabia | |
| United Arab Emirates | ||
| Qatar | ||
| South Africa | ||
| Egypt | ||
| Rest of Middle East and Africa | ||
Key Questions Answered in the Report
What is the size of the data center carbon management market?
The data center carbon management market size is USD 0.96 billion in 2026 and is projected to reach USD 2.96 billion by 2032 at a 19.59% CAGR.
What is driving adoption of data center carbon management solutions?
The data center carbon management market is supported by emissions disclosure rules, electricity demand, net-zero commitments, and customer requests for verified carbon information.
Which solution type has the largest share?
Carbon accounting and emissions measurement software held 34.38% share in 2026 because operators need a baseline for reporting and reduction programs.
Why is Scope 3 measurement becoming more important for data centers?
Hardware, construction materials, logistics, and outsourced services can form a substantial part of lifecycle emissions, particularly where electricity is low carbon.
Which deployment model is most widely used for carbon accounting?
Cloud-based platforms held 73.44% share in 2026 because they can connect with provider accounts, update emissions factors, and lower local technology needs.
Which region is expanding fastest?
Asia-Pacific is projected to expand at a 20.58% CAGR through 2032 as capacity increases and operators respond to grid emissions and emerging compliance requirements.