
Cross-Border B2B Payments Market Size and Share
Market Overview
| Study Period | 2020 - 2031 |
|---|---|
| Market Size (2026) | USD 198.47 Trillion |
| Market Size (2031) | USD 266.42 Trillion |
| Growth Rate (2026 - 2031) | 6.07 % |
| Fastest Growing Market | Asia-Pacific |
| Largest Market | Europe |
| Market Concentration | Low |
Major Players *Disclaimer: Major Players sorted in no particular order Image © Mordor Intelligence. Reuse requires attribution under CC BY 4.0. | |
Cross-Border B2B Payments Market Analysis by Mordor Intelligence
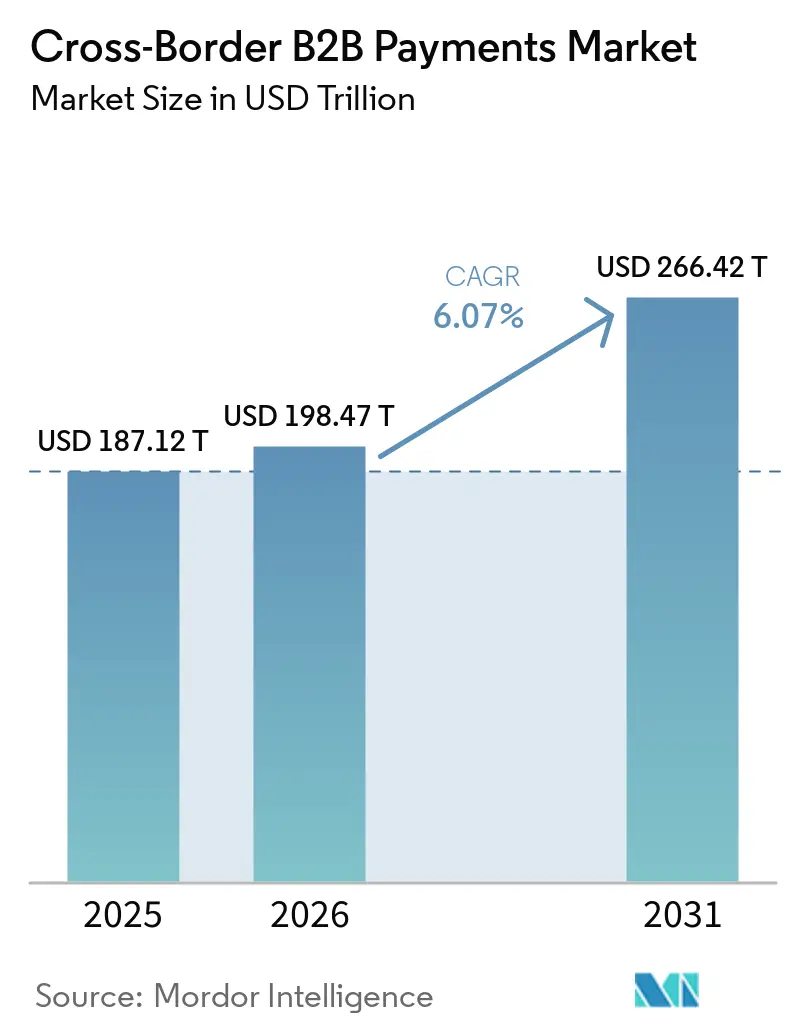
The cross-border B2B payments market size is projected to expand from USD 187.12 trillion in 2025 and USD 198.47 trillion in 2026 to USD 266.42 trillion by 2031, registering a CAGR of 6.1% between 2026 and 2031.
The cross-border B2B payments market is being reshaped by wider use of ISO 20022 messaging, regulated stablecoin frameworks, and links between domestic instant payment systems. Structured payment data has become a competitive requirement because it supports reconciliation, compliance checks, and payment tracking. The November 2025 migration to ISO 20022 gave institutions a more consistent basis for exchanging payment information across borders. The United States GENIUS Act and European Union crypto-asset rules have also clarified requirements for payment stablecoin activity. Providers that combine structured data, real-time screening, and multi-rail execution can better serve corporations that need faster settlement and clearer visibility.
Key Report Takeaways
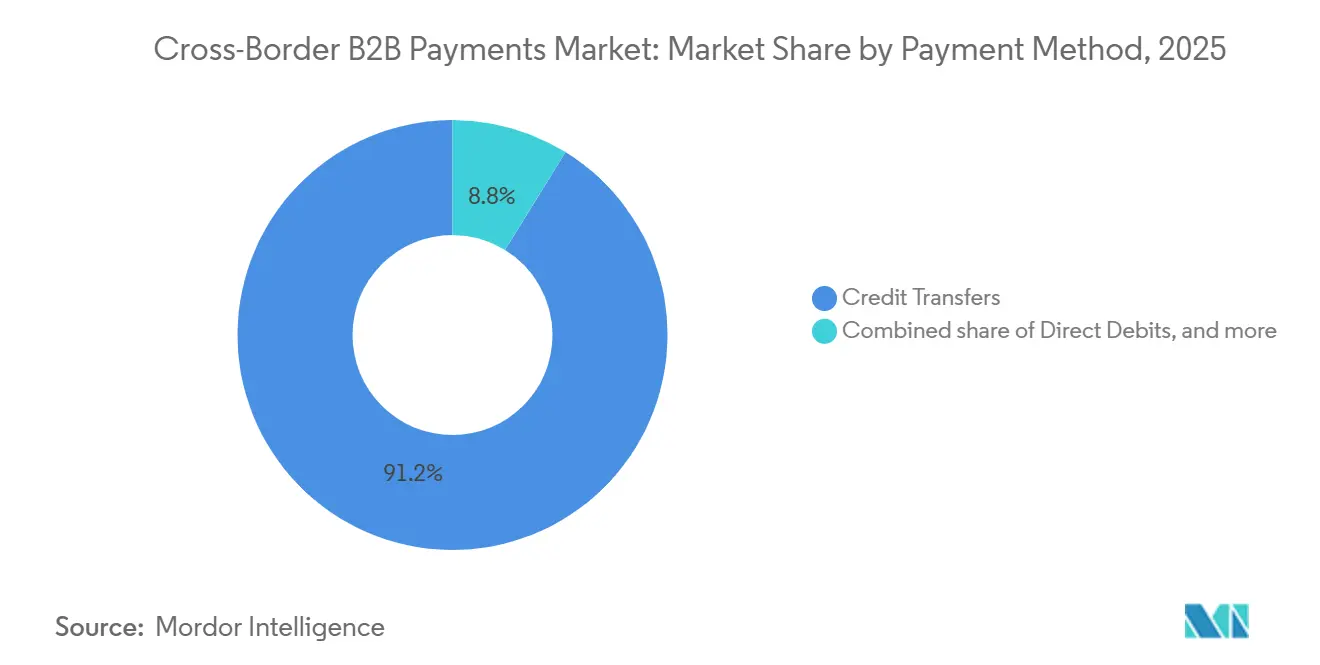
- By payment method, credit transfers captured 91.2% of the cross-border B2B payments market share in 2025, while e-money and closed-loop business wallets are projected to grow at a 12.5% CAGR through 2031.
- By ticket size, wholesale transactions captured 92.6% of the cross-border B2B payments market share in 2025, while retail B2B transactions are projected to grow at a 9.2% CAGR through 2031.
- By enterprise size, large enterprises captured 86.7% of the cross-border B2B payments market share in 2025, while small and medium-sized enterprises are projected to grow at an 8.1% CAGR through 2031.
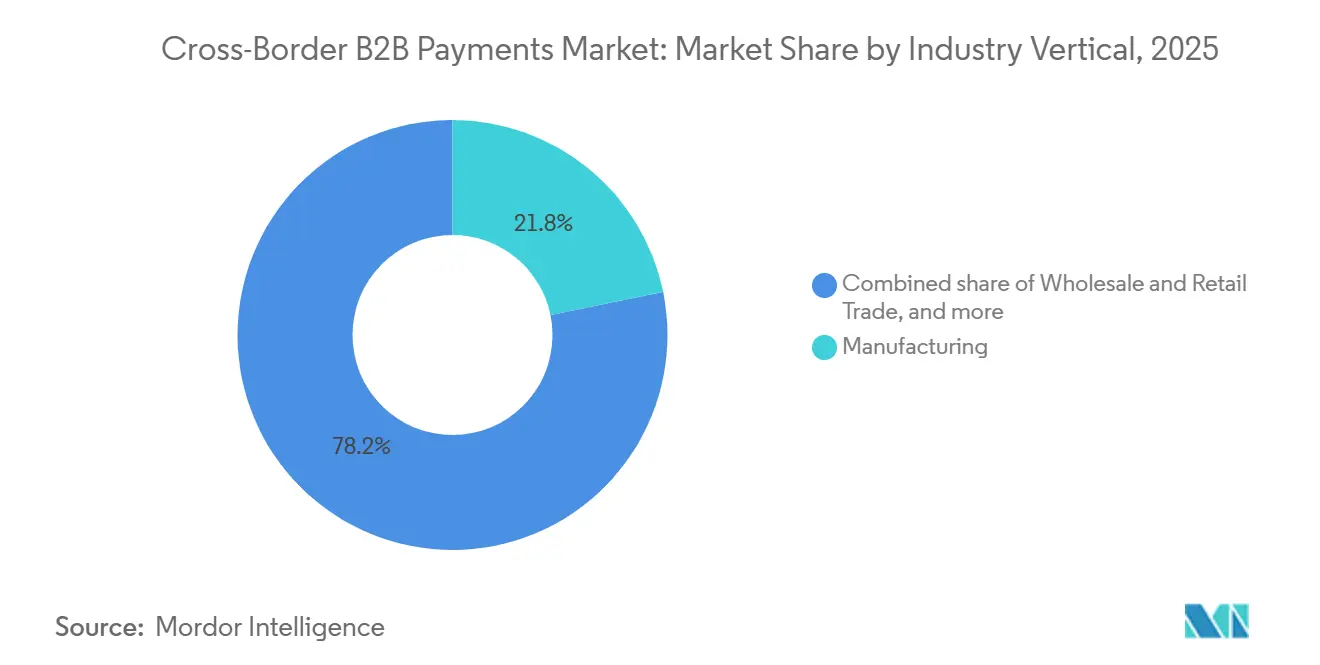
- By industry vertical, manufacturing captured 21.8% of the cross-border B2B payments market share in 2025, while information technology and telecommunications are projected to grow at an 8.8% CAGR through 2031.
- By economic purpose, intra-group treasury and intercompany funding captured 67.9% of the cross-border B2B payments market share in 2025, while the others category is projected to grow at a 9.7% CAGR through 2031.
- By geography, Europe captured 37.3% of the cross-border B2B payments market share in 2025, while Asia-Pacific is projected to grow at a 7.7% CAGR through 2031.
Note: Market size and forecast figures in this report are generated using Mordor Intelligence’s proprietary estimation framework, updated with the latest available data and insights as of January 2026.
Global Cross-Border B2B Payments Market Trends and Insights
Drivers Impact Analysis*
| Driver | (~) % Impact on CAGR Forecast | Geographic Relevance | Impact Timeline |
|---|---|---|---|
| Real-Time Payment Rail Interlinking | +1.2% | Global, with the earliest gains in the Asia-Pacific and European Union corridors | Medium term (2-4 years) |
| Embedded Payments in B2B Marketplaces and ERP Platforms | +1% | Global, led by North America and Western Europe | Medium term (2-4 years) |
| Digital Trade, E-Invoicing and Automated VAT Reporting | +0.8% | European Union, Asia-Pacific, and Latin America | Medium term (2-4 years) |
| Virtual Cards and Working-Capital Optimization | +0.6% | North America and the European Union, with expansion into the Asia-Pacific | Short term (≤ 2 years) |
| Tokenized Deposits and Regulated Stablecoin Settlement | +0.9% | Global, anchored in the United States and European Union-regulated corridors | Long term (≥ 4 years) |
| AI-Enabled Treasury, Payables and Payment Routing | +0.7% | Global | Medium term (2-4 years) |
| Source: Mordor Intelligence | |||
Real-Time Payment Rail Interlinking: Corridor Expansion Compresses Corporate Settlement Windows
The Group of Twenty has placed a fast payment system interlinking within its Cross-Border Payments Roadmap. More than 100 jurisdictions operate or are developing domestic real-time payment systems, making domestic instant settlement more widely available than in earlier payment modernization cycles. Project Nexus set out a multilateral approach in 2024 for connecting fast payment systems across several jurisdictions, rather than requiring separate technical arrangements for every bilateral corridor. The European Central Bank began the realization phase for linking TARGET Instant Payment Settlement with India’s Unified Payments Interface in November 2025[1]. Corporate payments can benefit when these links reduce the time between payment initiation, confirmation, and the availability of funds. Providers that can route transactions through real-time, gross settlement, and correspondent banking rails can respond more effectively to the differing speed, cost, and currency needs of each corridor.
Embedded Payments in B2B Marketplaces and ERP Platforms: Finance Stack Consolidation Rewires AP and AR Workflows
Payment execution is moving closer to enterprise resource planning and procure-to-pay workflows. This approach allows invoice information, foreign exchange conversion, payment approval, and reconciliation to operate within a connected process rather than being transferred manually between systems. Finexio and MassPay launched an embedded cross-border accounts payable service in July 2026 for vendor payments in 180 countries and 80 currencies[2]. The offering included identity verification, multi-rail routing, and stablecoin options within the payment process. The cross-border B2B payments market benefits when payment instructions are initiated where payable records, approvals, and invoice documentation are already managed. Positions within enterprise resource planning ecosystems can create recurring payment volumes because companies are less likely to change essential operating workflows once settlement and reconciliation are embedded.
Tokenized Deposits and Regulated Stablecoin Settlement: Institutional Infrastructure Moves Beyond Pilot Phase
Tokenized deposits and stablecoin settlement systems are moving from controlled testing toward wider institutional use. The GENIUS Act, signed in July 2025, established a United States federal framework for payment stablecoins and addressed reserve assets, issuer duties, and direct interest payments. The European Union’s Markets in Crypto-Assets transition period ended on July 1, 2026, making full authorization necessary for covered providers. J.P. Morgan expanded Kinexys Blockchain Deposit Accounts to AUD, HKD, JPY, RMB, and SGD in June 2026, taking the network to 8 currencies[3]. The network had processed more than USD 4 trillion cumulatively and averaged more than USD 7 billion in daily volume. The cross-border B2B payments market could gain more always-on settlement options and greater support for programmable transactions, although central banks continue to assess the monetary effects of large-scale stablecoin use.
AI-Enabled Treasury, Payables and Payment Routing: Machine Speed Redefines the Compliance-Cost Trade-Off
Artificial intelligence is being used for payment routing, treasury operations, and compliance-related processes. J.P. Morgan reported that its technology supports more than USD 12 trillion in daily processing across 60 million transactions in over 200 countries[4]. The bank also reported a 99.5% straight-through processing rate and said 93% of financial institutions were modernizing payment infrastructure. Faster routing decisions can improve execution when foreign exchange liquidity, payment cutoffs, and compliance checks vary by corridor and by payment method. Automated tools can support suppliers onboarding, receivables, virtual cards, foreign exchange execution, and reconciliation without separating these activities into disconnected processes. The cross-border B2B payments market is placing greater value on systems that combine payment execution with controls, especially when businesses need faster resolution of exceptions, more consistent foreign exchange decisions, and clear operational records for compliance teams, finance managers, and treasury staff responsible for cross-border payment oversight.
Restraints Impact Analysis*
| Restraint | (~) % Impact on CAGR Forecast | Geographic Relevance | Impact Timeline |
|---|---|---|---|
| Fragmented AML, KYC, Sanctions, and Licensing Requirements | -0.7% | Global, with the highest friction in multi-jurisdictional corridors | Long term (≥ 4 years) |
| Payment Fraud, Business Email Compromise, and Account Takeover | -0.5% | Global, concentrated in North America, the European Union, and the Asia-Pacific | Short term (≤ 2 years) |
| ERP Integration and Legacy Reconciliation Complexity | -0.4% | Global, particularly acute in North America and the European Union, mid-market businesses | Medium term (2-4 years) |
| Interoperability Gaps Between Tokenized-Money Rails and Legacy Systems | -0.3% | Global, with the highest friction in jurisdictions without distributed ledger technology frameworks | Long term (≥ 4 years) |
| Source: Mordor Intelligence | |||
Fragmented AML, KYC, Sanctions and Licensing Requirements: Compliance Architecture Compounds Multi-Corridor Costs
Anti-money laundering, know-your-customer, sanctions, and licensing requirements differ across jurisdictions. Each additional corridor can introduce separate verification thresholds, documentation standards, and screening requirements. The European Union’s Anti-Money Laundering Directive 6 creates criminal liability for legal persons, while the United States Bank Secrecy Act requirements follow different rules. Financial Action Task Force Recommendation 16 requires originator and beneficiary information to accompany qualifying virtual-asset transfers, but national implementation remains uneven. Data localization rules in countries such as India and Brazil can require separate infrastructure and limit the use of shared compliance systems. The cross-border B2B payments market favors providers that can interpret local rules through centralized but jurisdiction-aware compliance operations.
Payment Fraud, Business Email Compromise and Account Takeover: AI-Augmented Threats Outpace Defense Adoption
Payment fraud continues to create direct losses and operational disruption for corporate payment teams. The Association for Financial Professionals found that 76% of United States organizations experienced attempted or actual payment fraud in 2025, while business email compromise affected 74%. The Federal Bureau of Investigation recorded USD 3.05 billion in business email compromise losses across 24,768 complaints in 2025. Wire transfers accounted for 49% of email-enabled fraud targets in the Association for Financial Professionals survey. Only 17% of organizations used artificial intelligence to combat payment fraud, despite reported benefits for deepfake detection, reporting, and real-time identification. The cross-border B2B payments market requires stronger controls because fraud can also harm supplier relationships and slow investment in payment automation, particularly when a compromised payment affects a high-value invoice, delays settlement to a key supplier, or leads corporate teams to impose more manual review steps on future transactions.
*Our forecasts treat driver/restraint impacts as directional, not additive. The impact forecasts reflect baseline growth, mix effects, and variable interactions.
Segment Analysis
By Payment Method: Credit Transfers Anchor High-Value Flows as Digital Wallets Gain Programmable Ground
Credit transfers accounted for 91.2% of transaction value in 2025, making them the established foundation for high-value corporate settlements. This portion of the cross-border B2B payments market share reflects the continuing role of bank-to-bank correspondent networks in international treasury operations. Corporate treasury teams rely on credit transfers where settlement finality, compliance controls, and complete audit trails are essential. The method also fits intercompany settlements and trade payments that require clear records for multiple internal and external parties. ISO 20022 adoption has improved the ability of credit transfer systems to carry structured remittance and reference data. This change helps banks and corporate users match payments to invoices with less manual intervention, particularly when the payment reference, remittance record, and underlying payable data are retained in a consistent format across the systems used by the sending bank, receiving bank, and corporate treasury team.
E-money and closed-loop business wallets are forecast to expand at a 12.5% CAGR through 2031. Their growth is linked to marketplace operators, platform-based small and medium-sized enterprises, and payment needs that extend outside normal banking hours. These tools can provide programmable settlement features that fit high-frequency commercial payments. Direct debits, commercial cards, and virtual cards hold smaller portions of value, yet they remain important for recurring and specialized business workflows. Virtual cards can support greater payment control where businesses need specific approval rules or supplier-level visibility. The cross-border B2B payments market is likely to see wallet adoption strengthen in mid-value corridors where integrated foreign exchange and rapid reconciliation are useful. Their role does not displace credit transfers in wholesale flows, but it expands the number of viable payment options for firms with different operating needs, including businesses that require payment release outside banking hours, a direct connection to platform records, or a method that is easier to use for repetitive supplier and marketplace payments.
By Ticket Size: Wholesale Transactions Dominate as SME-Oriented Retail B2B Scales Faster
Wholesale transactions of at least USD 100,000 accounted for 92.6% of transaction value in 2025. This cross-border B2B payments market size concentration is consistent with corporate treasury transfers, intercompany funding, and large trade invoices. These transactions frequently involve several legal entities, currencies, and approval steps before funds can be released. They often require credit facilities, currency hedging, and compliance processes that are supported by established banking relationships. The high value of these payments increases the need for dependable execution and clear exception handling. Such requirements make these flows difficult for providers without banking capabilities or deep liquidity access to serve at scale, since a provider must manage settlement risk, currency availability, operational exceptions, and regulatory checks while also maintaining the service standards expected by multinational corporate customers.
Retail B2B transactions below USD 100,000 are forecast to grow at a 9.2% CAGR through 2031. Small and medium-sized enterprise internationalization, online marketplace activity, and broader access to instant payment systems support this growth. These businesses often need a simpler way to initiate foreign payments and determine the exchange rate before approval. Smaller payments can produce higher fee margins for providers because the cost of processing does not decline in proportion to transaction size. Payment tracking and invoice matching are also important because small businesses usually have limited treasury resources. The cross-border B2B payments market offers an opportunity for providers that make foreign exchange, payment initiation, and status information easier to manage. Better service conditions could encourage businesses to reconsider traditional provider relationships in suitable corridors, especially where a provider can present an exchange rate before payment approval, confirm transaction status promptly, and reduce the administrative work that normally falls on finance staff with limited specialist support.
By Enterprise Size: Large Enterprises Define Volume as SME Access Infrastructure Matures
Large enterprises held 86.7% of transaction value in 2025. Their position in the cross-border B2B payments market is supported by global supply chains, multi-entity treasury operations, and high-value internal funding. These organizations generally use formal policies for payment approval, banking access, and foreign exchange risk management. Their enterprise resource planning choices and bank relationships can determine the payment methods available to a large supplier network. This effect can reinforce established payment providers across corporate networks over extended contract periods. Large enterprises also face rising scrutiny of transfer pricing, capital controls, and beneficial ownership in cross-border capital movements, which increases the importance of payment documentation, complete counterparty records, and internal control procedures that can be applied consistently across entities and jurisdictions.
Small and medium-sized enterprises are forecast to grow at an 8.1% CAGR through 2031. Application programming interface-based platforms are making multi-rail payments and foreign exchange tools more accessible to this customer group. These platforms reduce the need for smaller firms to build direct connections to several banks or payment networks. Corpay expanded Corpay One in January 2026 to add foreign exchange and cross-border payment capabilities for small and medium-sized enterprises. Large payment networks are also seeking to connect small business platforms with account, card, and wallet payout options in cross-border corridors. The cross-border B2B payments market is becoming more accessible to smaller firms, while large enterprises remain the primary source of transaction value, because new platforms can package payment initiation, foreign exchange support, and payout options into services that smaller finance teams can use without maintaining extensive internal payment infrastructure.
By Industry Vertical: Manufacturing Anchors Flows as IT and Telecommunications Accelerates Value-Chain Disruption
Manufacturing accounted for 21.8% of transaction value in 2025. It held the largest allocation of the cross-border B2B payments market because global goods trade relies on complex, multi-currency supplier settlement. Automotive, electronics, and industrial supply chains typically involve high invoice volumes across several production locations. Their extended payment cycles create a continuing need for accurate foreign exchange management and clear supplier payment records. Structured invoice data can also improve how manufacturers reconcile large numbers of commercial transactions. Manufacturing flows are particularly important in trade corridors connecting China, the United States, and the European Union, where supply chains can involve repeated settlement between component suppliers, manufacturers, distributors, and related companies that must manage payment timing alongside the delivery of physical goods.
Information technology and telecommunications are forecast to grow at an 8.8% CAGR through 2031. Subscription billing, software licensing, and digital services transactions create recurring payments across several jurisdictions. These activities are less dependent on conventional correspondent banking than physical goods trade because payment workflows are often platform-based. Healthcare and life sciences also require payment traceability, vendor accreditation, and regulatory reporting. Visa and Airwallex announced a 2026 collaboration to develop embedded finance for freight and shipping platforms. The cross-border B2B payments industry is rewarding payment models that reflect the operating requirements of individual verticals. Providers with sector-specific capabilities can address payment processes that broad, standardized services may not fully support, including requirements for recurring billing, supplier approval, freight documentation, regulated vendor records, or the reconciliation practices that vary materially between goods-based and digital service businesses.
By Economic Purpose: Intra-Group Treasury Leads as Emerging-Purpose Flows Diversify the Pipeline
Intra-group treasury and intercompany funding accounted for 67.9% of transaction value in 2025. This transaction value share demonstrates the importance of multinational companies’ internal liquidity management. Netting, cash sweeping, and intercompany lending generate recurring, high-value payment flows between related entities. These transactions are predictable because they support planned funding and liquidity allocation across a corporate group. They also create long-term relationships with banks that provide treasury services and foreign exchange management. Third-party goods and services payments represent the remaining major purpose categories, and these transfers can have different timing, documentation, and counterparty requirements from internal corporate funding, even when they use the same underlying cross-border payment infrastructure and foreign exchange arrangements.
The others category is forecast to grow at a 9.7% CAGR through 2031. It includes platform-based supplier payments, marketplace settlements, and cross-border gig-economy payouts that do not fit traditional goods or services classifications. These payment types require flexible settlement arrangements because they can involve many payees, currencies, and payment timings. J.P. Morgan’s June 2026 Kinexys expansion enabled always-on foreign exchange settlement across 8 currencies, with Payoneer and JERA Global Markets among the first Asia-Pacific users. Conditional payments, real-time cash sweeping, and multi-entity netting can support the movement of some treasury activity from batch processes. The cross-border B2B payments industry is seeing payment needs broaden as platform-based commercial models expand, creating demand for payment arrangements that can support multiple beneficiaries, scheduled releases, currency conversion, and clearer information for corporate users who must oversee liquidity across a growing set of commercial channels.
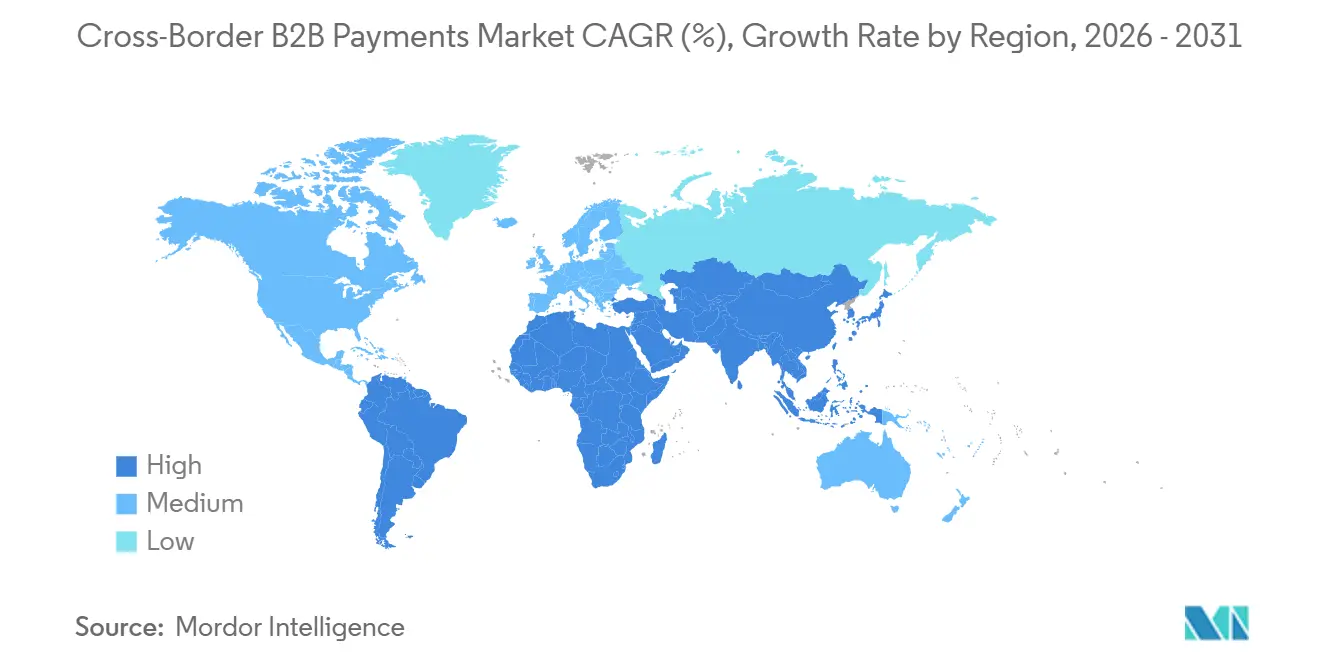
Geography Analysis
Europe held 37.3% of transaction value in 2025, making it the largest regional component of the cross-border B2B payments market. Supply chain integration in the euro area and the Single Euro Payments Area support this position. The European Union Instant Payments Regulation requires full reachability for Single Euro Payments Area instant credit transfers. France’s September 1, 2026, deadline for mandatory electronic invoice reception supports more standardized accounts payable data. Germany, the United Kingdom, and France remain important anchors for intra-European B2B payment flows.
Asia-Pacific is forecast to grow at a 7.7% CAGR through 2031. China, India, Southeast Asia, and Northeast Asian manufacturing centers support growth through dense goods-trade corridors. The region combines bilateral payment links, including Unified Payments Interface and PayNow, with institutional tokenized settlement networks. Singapore has an important regional role as an Asian banking hub in the SWIFT distributed ledger core design group. The cross-border B2B payments market has opportunities in the Asia-Pacific because corridor demand is rising across manufacturing and digital trade.
North America, South America, and the Middle East and Africa have different corridor needs. North American B2B flows are supported by deep United States-Canada and United States-Mexico trade ties, while FedNow and CHIPS have upgraded domestic payment foundations. Brazil’s PIX and Mexico’s SPEI support domestic instant payments, but cross-border interoperability remains limited. Saudi Arabia’s trade digitization plans, the United Arab Emirates’ gateway role, and expanding African fintech infrastructure support activity across the Middle East and Africa.
Competitive Landscape
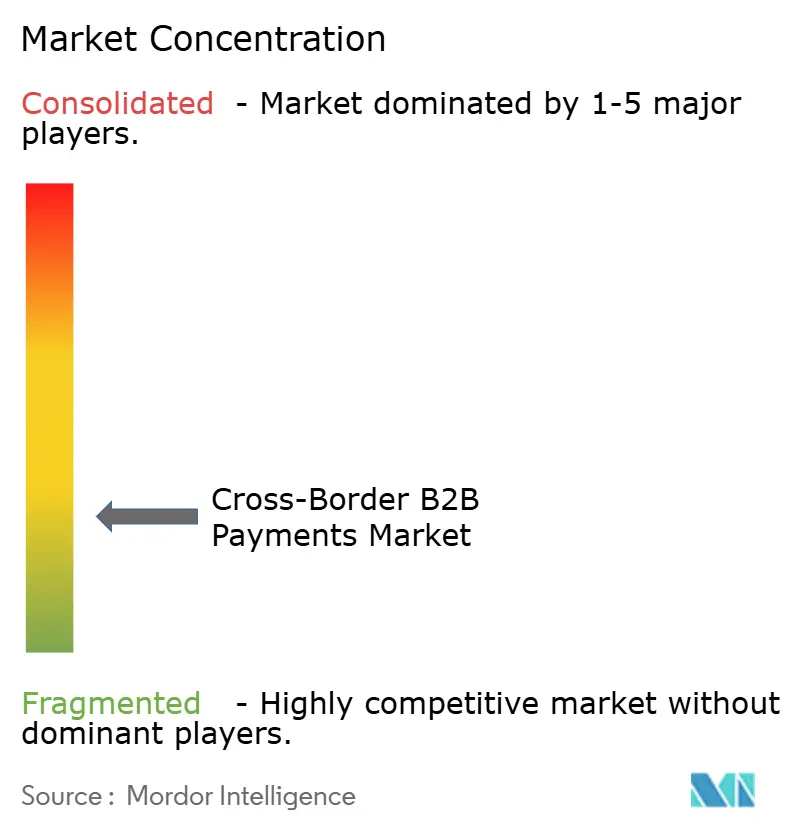
The cross-border B2B payments market is fragmented in small and medium-sized enterprise services. J.P. Morgan, Citibank, HSBC, and other global transaction banks serve substantial intra-group treasury and trade finance volumes. Fintech providers compete most actively in corridors that need simpler onboarding, multi-currency access, and tailored workflows. Compliance capability, ISO 20022 data, and licensing requirements affect which providers can operate across regulated corridors. This creates an advantage for companies that combine payment services with mature compliance operations.
Nuvei and Payoneer announced a definitive acquisition agreement in June 2026 with an equity value of USD 2.75 billion. The deal reflects the importance of payment scale, geographic reach, and multi-rail capabilities. Airwallex raised USD 320 million at a USD 11 billion valuation in June 2026 and said it would support artificial intelligence development and regulatory expansion. J.P. Morgan Payments and Mastercard developed a B2B virtual card offering for Europe in 2026 for complex supply chains. These actions show how established networks and fintech providers are investing in different parts of the cross-border B2B payments market.
Citi completed live transactions on SWIFT’s distributed ledger with First Abu Dhabi Bank and OCBC in September 2026. Airwallex, Nium, Wise, Rapyd, Thunes, and dLocal are building positions in selected corridors and customer groups. The main gap remains multi-currency liquidity management for mid-market companies in Latin America, Africa, and Southeast Asia. Large-enterprise treasury tools and consumer transfer applications do not fully meet the needs of these businesses.
Cross-Border B2B Payments Industry Leaders
-
J.P. Morgan
-
Citibank
-
HSBC Holdings plc
-
PayPal Holdings, Inc.
-
Wise plc
- *Disclaimer: Major Players sorted in no particular order
Recent Industry Developments
- September 2026: Citi, in collaboration with First Abu Dhabi Bank and OCBC, completed the first United States bank live transactions on SWIFT's blockchain-based distributed ledger for cross-border payments, the first in the Middle East and Southeast Asia, as part of a controlled proof-of-concept phase running July-December 2026, advancing interoperable 24/7 tokenized settlement for institutional clients globally.
- July 2026: DBS and Citi partnered to enable instant 24/7 cross-border USD payments using tokenized deposits, extending institutional-grade blockchain settlement to Southeast Asian corridors and building on DBS's 2024 launch of DBS Token Services.
- June 2026: J.P. Morgan expanded Kinexys Blockchain Deposit Accounts to 8 currencies by adding AUD, HKD, JPY, RMB, and SGD, enabling 24/7 on-chain foreign exchange settlement and programmable payments across Asia-Pacific corridors. Payoneer and JERA Global Markets were among the first live users, and Kinexys had cumulatively processed more than USD 4 trillion in transactions at an average daily volume exceeding USD 7 billion.
- June 2026: Visa and Airwallex announced a collaboration to develop embedded-finance solutions for freight and shipping platforms, combining Visa's B2B payment strategy with Airwallex's multi-currency infrastructure to build vertical-specific financial products for one of the most complex B2B segments.
Global Cross-Border B2B Payments Market Report Scope
| Credit Transfers |
| Direct Debits |
| Commercial Cards and Virtual Cards |
| E-money / Closed-Loop Business Wallets |
| Other Instruments |
| Wholesale (≥ USD 100,000) |
| Retail B2B (< USD 100,000) |
| Large Enterprises |
| Small and Medium-Sized Enterprises |
| Manufacturing |
| Wholesale and Retail Trade |
| Transportation and Logistics |
| Information Technology and Telecommunications |
| Energy, Utilities and Resources |
| Healthcare and Life Sciences |
| Professional and Business Services |
| Construction and Real Estate |
| Other Industries |
| Third-Party Goods Settlement |
| Third-Party Services Settlement |
| Intra-group Treasury and Intercompany Funding |
| Others |
| North America | United States |
| Canada | |
| Mexico | |
| South America | Brazil |
| Argentina | |
| Rest of South America | |
| Europe | United Kingdom |
| Germany | |
| France | |
| Italy | |
| Spain | |
| Rest of Europe | |
| Asia-Pacific | China |
| Japan | |
| India | |
| South Korea | |
| Australia | |
| Indonesia | |
| Thailand | |
| Malaysia | |
| Singapore | |
| Vietnam | |
| Rest of Asia-Pacific | |
| Middle East and Africa | Saudi Arabia |
| United Arab Emirates | |
| Turkey | |
| South Africa | |
| Egypt | |
| Rest of Middle East and Africa |
| By Payment Method | Credit Transfers | |
| Direct Debits | ||
| Commercial Cards and Virtual Cards | ||
| E-money / Closed-Loop Business Wallets | ||
| Other Instruments | ||
| By Ticket Size | Wholesale (≥ USD 100,000) | |
| Retail B2B (< USD 100,000) | ||
| By Enterprise Size | Large Enterprises | |
| Small and Medium-Sized Enterprises | ||
| By Industry Vertical | Manufacturing | |
| Wholesale and Retail Trade | ||
| Transportation and Logistics | ||
| Information Technology and Telecommunications | ||
| Energy, Utilities and Resources | ||
| Healthcare and Life Sciences | ||
| Professional and Business Services | ||
| Construction and Real Estate | ||
| Other Industries | ||
| By Economic Purpose | Third-Party Goods Settlement | |
| Third-Party Services Settlement | ||
| Intra-group Treasury and Intercompany Funding | ||
| Others | ||
| By Geography | North America | United States |
| Canada | ||
| Mexico | ||
| South America | Brazil | |
| Argentina | ||
| Rest of South America | ||
| Europe | United Kingdom | |
| Germany | ||
| France | ||
| Italy | ||
| Spain | ||
| Rest of Europe | ||
| Asia-Pacific | China | |
| Japan | ||
| India | ||
| South Korea | ||
| Australia | ||
| Indonesia | ||
| Thailand | ||
| Malaysia | ||
| Singapore | ||
| Vietnam | ||
| Rest of Asia-Pacific | ||
| Middle East and Africa | Saudi Arabia | |
| United Arab Emirates | ||
| Turkey | ||
| South Africa | ||
| Egypt | ||
| Rest of Middle East and Africa | ||
Key Questions Answered in the Report
What is the projected value of cross-border B2B payments by 2031?
Transaction value is projected to reach USD 266.42 trillion by 2031, growing at a 6.1% CAGR from 2026. The projection reflects wider adoption of structured messaging, instant payment connections, and payment tools that support business workflows across jurisdictions.
Which payment method leads cross-border B2B transactions?
Credit transfers led with 91.2% of transaction value in 2025, reflecting their role in high-value corporate settlement. Their established banking infrastructure, compliance controls, and auditable records remain important for treasury and trade transactions.
Why are business wallets growing in cross-border payments?
E-money and closed-loop business wallets are projected to grow at a 12.5% CAGR through 2031 because platforms need programmable and always-on settlement. They are relevant to platform-based companies that need a payment process connected to operational records and available outside traditional banking hours.
Which region is growing fastest for cross-border B2B payments?
Asia-Pacific is projected to grow at a 7.7% CAGR through 2031, supported by trade corridors and instant-payment links. Manufacturing activity, growing digital trade, and links between domestic payment systems support the region’s position.
What are the main risks for corporate cross-border payment operations?
Fragmented compliance obligations and payment fraud are key risks. United States organizations reported high fraud exposure in 2025. Companies must maintain strong counterparty checks, payment approval processes, and transaction monitoring across the countries where they operate.
How are tokenized deposits changing corporate payments?
Tokenized deposits can support always-on settlement and programmable payments. J.P. Morgan expanded its Kinexys network to 8 currencies in June 2026. The expansion demonstrates the use of blockchain deposit accounts for continuous foreign exchange settlement and programmable business payments in selected corridors.