
Coworking Spaces Market Size and Share
Market Overview
| Study Period | 2021 - 2032 |
|---|---|
| Market Size (2027) | USD 28.12 Billion |
| Market Size (2032) | USD 43.16 Billion |
| Growth Rate (2027 - 2032) | 8.95 % |
| Fastest Growing Market | Asia-Pacific |
| Largest Market | North America |
| Market Concentration | Medium |
Major Players *Disclaimer: Major Players sorted in no particular order Image © Mordor Intelligence. Reuse requires attribution under CC BY 4.0. | |
Coworking Spaces Market Analysis by Mordor Intelligence
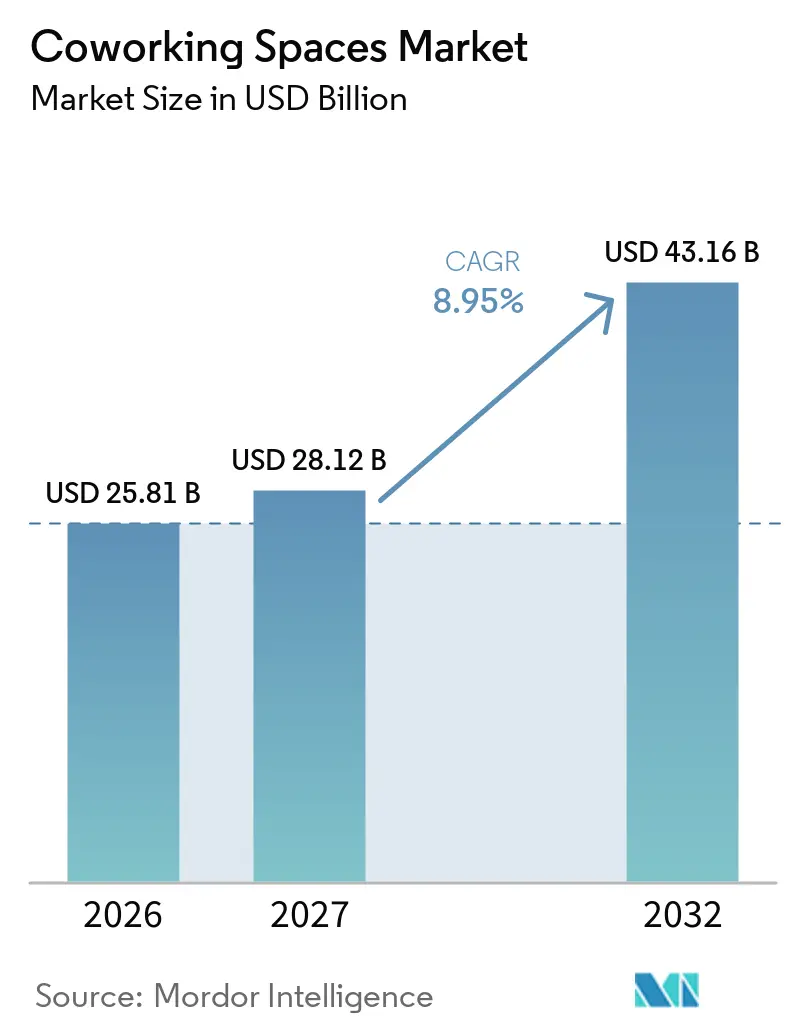
The Coworking Spaces Market size is expected to grow from USD 25.81 billion in 2026 to USD 28.12 billion in 2027 and is forecast to reach USD 43.16 billion by 2032 at 8.95% CAGR over 2027-2032.
The coworking spaces market is moving toward a more durable enterprise-led model as employers use flexible offices to manage hybrid schedules, variable headcount, and capital spending. Rising office use does not necessarily restore the traditional lease model because many employers still require access across several locations without committing to long property terms. This change favors operators with dense networks, reliable private-office capacity, and services that can support large accounts across several locations, while shifting attention toward response times, building access, digital booking, and account support that corporate real estate teams can evaluate consistently. Demand is also moving beyond central business districts, creating room for operators that can serve suburban and secondary-city clients without undermining service quality. Competition is increasingly shaped by capital-light expansion, network partnerships, and managed-office offerings rather than by leasing more space on an operator balance sheet, so the coworking spaces market rewards operating discipline as much as property expansion.
Key Report Takeaways
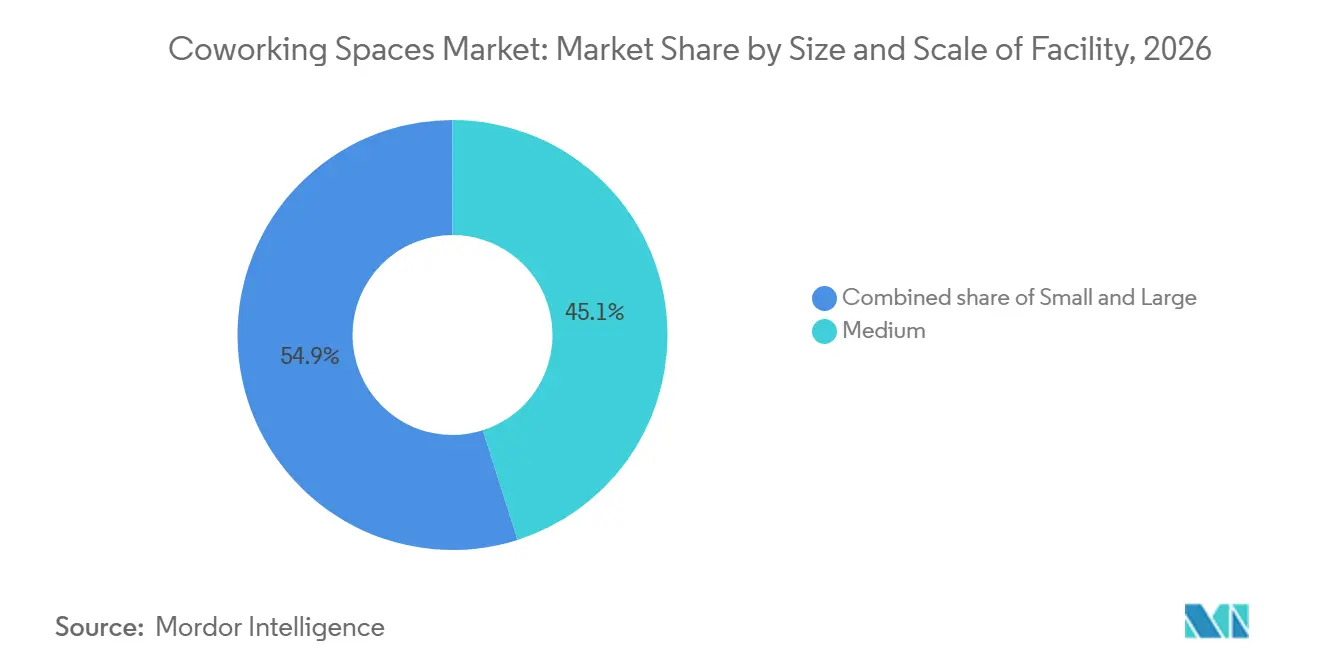
- By size and scale of facility, medium-sized centers held 45.1% of the coworking spaces market share in 2026, while large facilities are projected to grow at a 9.88% CAGR through 2032.
- By sector, IT and ITES accounted for 39.2% of the coworking spaces market share in 2026, while other services are projected to advance at a 10.22% CAGR through 2032.
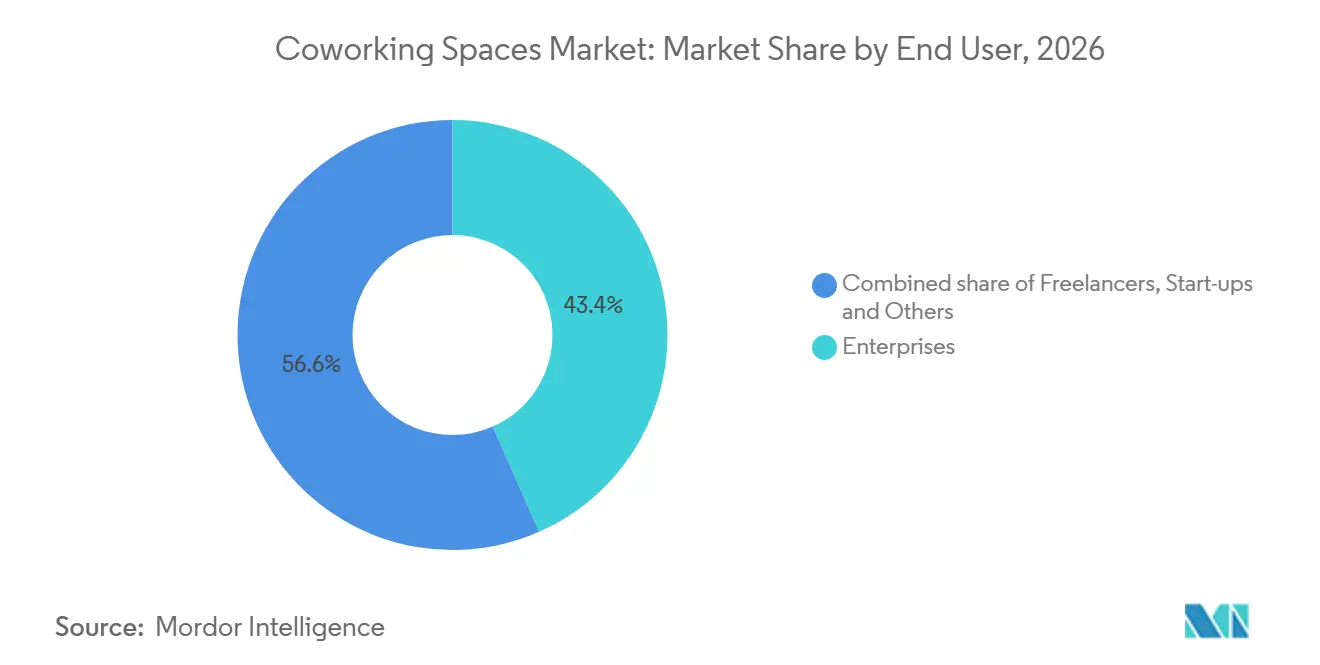
- By end user, enterprises accounted for 43.4% of global revenue in 2026, while start-ups and others are projected to expand at a 10.12% CAGR through 2032.
- By geography, North America accounted for 34.5% of global revenue in the coworking spaces market size in 2026, while Asia-Pacific is projected to grow at a 10.34% CAGR through 2032.
Note: Market numbers in this report are based on Mordor Intelligence's proprietary estimation framework, which combines nine months of actuals with Q4 projections for base year 2026.
Market Trends and Insights
Drivers Impact Analysis of Coworking Spaces Market*
| Drivers | (~) % Impact on CAGR Forecast | Geographic Relevance | Impact Timeline |
|---|---|---|---|
| Hybrid Work Adoption and Flexible Office Access | +2.2% | Global, concentrated in North America, Western Europe, and India | Short term (≤ 2 years) |
| Corporate Real Estate Cost Optimization | +1.8% | Global, most acute in North America and the European Union | Short term (≤ 2 years) |
| Startup and Entrepreneurship Growth | +1.2% | Asia-Pacific, South America, and EMEA emerging hubs | Medium term (2-4 years) |
| Global Capability Center and Multinational Expansion | +1.0% | Asia-Pacific core, with spillover to the Middle East and Africa | Medium term (2-4 years) |
| Secondary City and Suburban Penetration | +0.8% | North American secondary metros and European non-capital cities | Medium term (2-4 years) |
| Premium Amenities and Networking Demand | +0.6% | Global, with early gains in London, New York, Singapore, and Bengaluru | Long term (≥ 4 years) |
| Source: Mordor Intelligence | |||
Hybrid Work Adoption Broadens the Enterprise User Base for Flexible Office Access
Hybrid work is making flexible access a practical part of workplace planning rather than a temporary response to disruption. Hybrid schedules are changing how employers assess the amount, location, and type of office space they need. WeWork reported 82,241 average monthly on-demand bookings in the first half of 2026, up 20.4% from a year earlier, indicating that users still need space even when they do not attend a central office every day[1]. The coworking spaces market benefits when employees need convenient locations for meetings, focused work, and periodic team sessions. Peak in-office days place value on a broad local network, since a single flagship center cannot serve distributed teams as effectively. Operators that combine reliable booking tools with private space can therefore strengthen their position with employers that manage attendance across several sites.
Corporate Real Estate Cost Optimization Accelerates the Lease-to-Flex Transition
Corporate cost control supports a shift from fixed office commitments to arrangements that can expand or contract with headcount. Employers can use flexible space to limit upfront fit-out spending and reduce the risk of holding more space than they need. Flexible arrangements can reduce the need for upfront fit-outs and preserve cash when business plans change. Longer enterprise agreements can also improve revenue visibility for operators, provided that pricing remains aligned with occupancy costs. This dynamic is particularly relevant where construction pipelines are constrained, and companies need ready-to-use space without waiting for a conventional fit-out process. It can also give corporate real estate teams more flexibility to test a new city, support a project, or accommodate a temporary increase in staff. The coworking spaces industry is therefore increasingly linked to corporate real estate planning, not only to individual memberships.
Startup and Entrepreneurship Growth Sustains Demand Across Emerging Markets
Startups, freelancers, and small project teams still provide essential occupancy for flexible offices, especially in markets where enterprise adoption is developing. Brazil recorded 84% occupancy in WeWork locations during 2025, supported by technology firms, fintech companies, and international businesses seeking low-commitment entry options[2]. These users often need functional offices, meeting rooms, and short commitments instead of dedicated long-term premises. Demand can spread from established business districts into residential and secondary commercial areas as business creation widens. The coworking spaces market can capture this activity when operators keep entry costs clear and location choices practical. A diversified customer base also helps new sites build occupancy before larger contracts are secured. It gives operators a wider daily user base and lets communities form around business activity rather than a single employer. The coworking spaces market can retain these users when service quality remains consistent as a site grows.
Global Capability Center Expansion Drives Premium Managed Workspace Demand
Global capability centers are driving increased demand for managed offices that can support larger teams and more specific operating requirements. In India, these centers accounted for 40% of enterprise flex seat absorption in the first quarter of 2026 and 52% of demand in managed workspace centers[3]. Average deal size rose from 25 seats in 2023 to 53 seats in 2025, indicating a move toward larger requirements. The coworking spaces market is better positioned to serve this demand, where operators can provide secure technology, custom layouts, and dependable facility management. Larger contracts can support steadier cash flows, but they require stronger delivery standards than open-desk memberships. This demand is also spreading across Southeast Asia as firms build regional operating hubs. The coworking spaces market can benefit when providers use this demand to develop long-term capabilities, rather than relying only on temporary project work.
Restraints Impact Analysis of Coworking Spaces Market*
| Restraints | (~) % Impact on CAGR Forecast | Geographic Relevance | Impact Timeline |
|---|---|---|---|
| Fixed Lease Obligations and Operating Costs | -1.5% | Global, most acute in Western Europe and major North American metros | Short term (≤ 2 years) |
| Competition and Membership Pricing Pressure | -1.0% | Global, particularly North America and Western Europe | Medium term (2-4 years) |
| Short Membership Terms and Occupancy Volatility | -0.7% | Global, with greater severity in emerging and secondary markets | Medium term (2-4 years) |
| Corporate Data Security and Confidentiality Requirements | -0.5% | North America and European Union, especially BFSI, healthcare, and legal sectors | Long term (≥ 4 years) |
| Source: Mordor Intelligence | |||
Fixed Lease Obligations Create Structural Profitability Risk Across Operator Tiers
Fixed lease commitments remain a central financial risk because many operators collect revenue through shorter memberships. Germany-based Unicorn Workspaces entered insolvency in 2025 despite 80% occupancy after sustained rent increases placed pressure on its cost base. This example shows that occupancy alone does not protect a site where rent escalation outpaces achievable membership revenue. Management agreements can reduce this exposure by sharing operating risk between owners and operators. The coworking spaces market will favor companies that match contract structure, local demand, and service costs more carefully. Financial discipline is particularly important in expensive central business districts where rent resets can be material. Operators also need to judge whether local demand is sufficiently diverse to withstand changes in a single customer group.
Competition From Global Platforms and Marketplace Aggregators Limits Pricing Power
Large platforms and booking marketplaces give buyers more choices and more visibility into desk and office pricing. Yardi acquired the Deskpass and Hubble platforms in January 2025, bringing flexible workspace search and booking capabilities into its commercial real estate technology portfolio. This structure can make it harder for individual operators to charge a premium without clear location, service, or product advantages. Competition is also intensified where discounted sublease space provides an alternative for corporate customers. Operators need a defined proposition, such as a broad network, specialized privacy features, or a focused local community. Without a clear point of difference, the coworking spaces industry can face margin pressure even when occupancy is healthy. The coworking spaces market is more resilient when customers recognize a specific benefit that a simple booking listing cannot replicate.
*Our forecasts treat driver/restraint impacts as directional, not additive. The impact forecasts reflect baseline growth, mix effects, and variable interactions.
Coworking Spaces Market Segment Analysis
By Size and Scale of Facility:
Medium Formats Support Broad Demand While Large Sites Address Enterprise RequirementsMedium-sized centers accounted for 45.1% of the coworking spaces market share in 2026, making this format the main revenue base across many cities. Their scale supports a mix of open memberships, meeting rooms, and private offices within a single operating model. This flexibility helps operators serve different customer groups without relying on a single type of contract. Medium formats can also remain viable in locations where demand is not deep enough for a campus-style facility. They are well suited to employers that need local access for hybrid teams but do not require a dedicated floor. The format can balance membership density with the privacy needs of smaller corporate groups. It can also allow operators to adjust the mix of desks, offices, and meeting areas as local demand changes. This makes the coworking spaces market accessible to companies that require an alternative to a fixed traditional office.
Large facilities are forecast to grow at a 9.88% CAGR through 2032 as enterprises seek custom layouts, dedicated technology, and space for larger teams. Large facilities can organize private suites, dedicated floors, and shared amenities to suit large client teams. Large sites can host global capability center teams and project groups that need secure areas and consistent services. They also require higher initial investment and more disciplined contract management than medium locations. Small facilities remain relevant in lower-cost suburban and secondary-city settings, where community and local convenience can offset limited scale. Across all sizes, building standards and environmental credentials can influence enterprise procurement decisions. These considerations raise the operational expectations operators must meet when competing for larger accounts.

By Sector:
IT and ITES Provide the Revenue Base While Other Services Expand AdoptionIT and ITES accounted for 39.2% of global revenue in the coworking spaces market in 2026. Technology teams often work across locations and project cycles, which aligns with managed offices and network access. In India, WeWork India operated 70 centers across 8 cities, covering 7.7 million square feet with 80.2% portfolio occupancy in the second quarter of 2026. The footprint shows the importance of technology-related demand in large flexible-office networks. Information Technology (IT) and Information Technology-Enabled Services (ITES) clients also support demand for secure private suites, meeting capacity, and support services. Their requirements are helping operators develop products beyond traditional shared desks. They can also encourage operators to improve network management, technology support, and service reliability. The coworking spaces market gains depth when these products can be offered across locations rather than as one-off solutions.
Other Services is forecast to grow at a 10.22% CAGR through 2032 as retail, life sciences, energy, and legal users extend their use of managed workspace. These users may need specialized access rules, confidential areas, or proximity to project locations. Life sciences firms can use flexible commercial suites near innovation clusters, while energy companies can house temporary project teams in operating regions. Legal users value private rooms and dependable meeting facilities where client work can be handled appropriately. Security guidance for shared workspaces highlights the need for providers to manage physical security, visitor procedures, and information protection. This wider adoption supports the coworking spaces market, although operators must prove that their controls meet each sector’s requirements. Appropriate design, clear access processes, and trained on-site teams can make a shared setting more workable for specialized users.
By End User:
Enterprises Lead Revenue While Start-ups and Others Extend Demand into New LocationsEnterprises accounted for 43.4% of global revenue in 2026 and remain the leading end-user group. Corporate customers use managed offices to provide access across cities while keeping real estate commitments more flexible. They also bring larger contract values and can create more stable occupancy when agreements extend beyond short desk bookings. Corporate users represented 47% of global flex occupancy in 2025, compared with 13% in 2020. This shift has changed design priorities toward secure, branded, and managed suites. It has also increased the importance of account management and consistent experiences across an operator network.
Start-ups and others are projected to expand at a 10.12% CAGR through 2032, supported by entrepreneurship and demand from independent workers. India’s flexible seat demand increased from 38,000 seats in 2020 to an estimated 300,000 in 2026, reflecting the growth of flexible work formats alongside enterprise demand. This group includes freelancers, digital nomads, and employees who make individual workspace bookings. These customers help establish day-to-day activity in newer sites and may become future small-business accounts. Their demand is sensitive to price, convenience, and transport access. They may also use space on a changing schedule, which makes simple membership choices and flexible booking tools important. Operators that provide easy booking and clear membership options can use this segment to expand beyond the largest business districts.
Geography Analysis
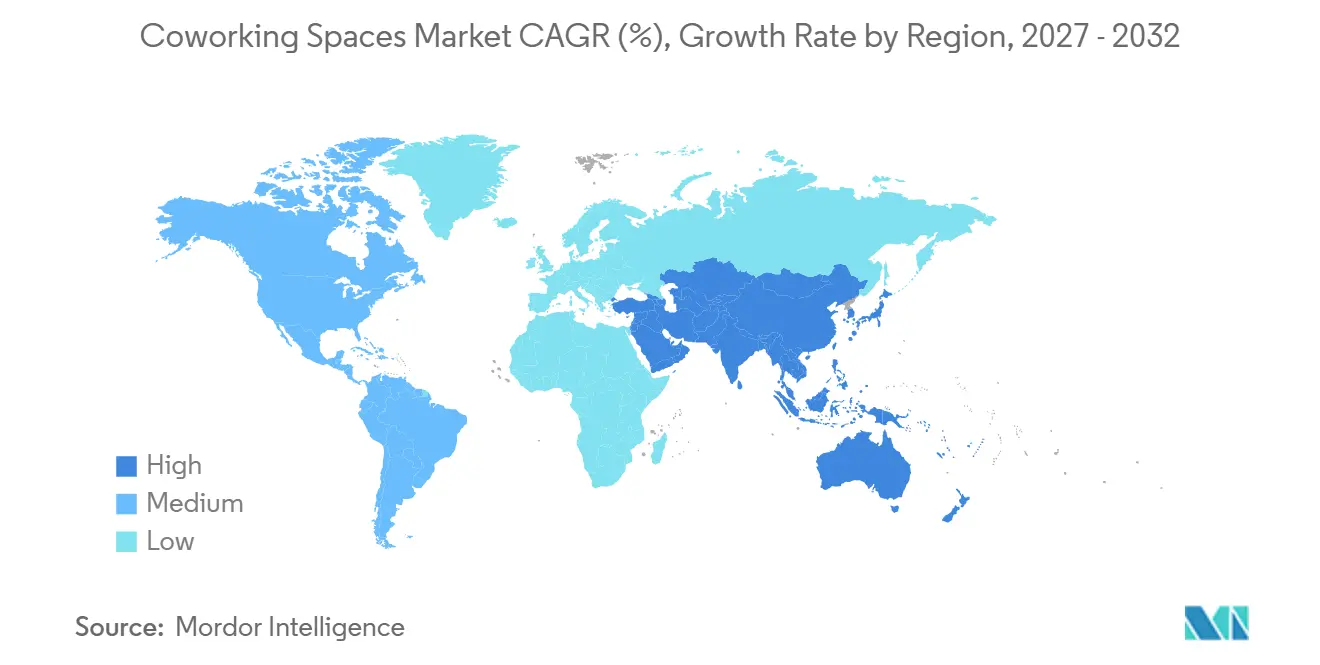
North America held 34.5% of global revenue in 2026, supported by mature enterprise use and a wide set of established operators. United States coworking inventory reached 164 million square feet across 9,136 locations at the end of the first quarter of 2026, up 16.5% from a year earlier. Secondary markets including Philadelphia, Tampa-St. Petersburg, and California’s Inland Empire are gaining inventory as operators address areas outside traditional gateway cities. This expansion gives employers more options for distributed teams and reduces dependence on central offices. The coworking spaces market in the region also benefits from demand for private space, meeting capacity, and more flexible corporate real estate arrangements. Operators are responding by improving local coverage and providing formats that can support individual users as well as large accounts.
Asia-Pacific is projected to grow at a 10.34% CAGR through 2032, making it the fastest-growing regional market. India’s share of global on-demand flexible-office bookings rose from 2.2% in the first half of 2025 to 10.2% in the first half of 2026. India had 88.7 million square feet of flexible-office inventory in the first half of 2026, equal to 10.5% of total office stock. Operators leased 8.5 million square feet across the top 8 cities during the period, setting a strong first-half result. Global capability centers are a major source of this demand, particularly for managed space with secure technology and customized layouts. Their requirements encourage providers to invest in operational processes that can serve complex teams over longer periods.
Europe is consolidating in mature hubs while some markets in the Middle East, Africa, and South America are still expanding from smaller bases. Germany had 1,962 coworking locations in October 2026, down from 2,129 a year earlier as smaller operators faced cost pressure. This consolidation may create room for better-capitalized operators with management-agreement capabilities. Brazil remains important in South America because technology firms and international companies use flexible locations for market entry. The United Arab Emirates and Saudi Arabia are attracting enterprise and startup demand connected to economic diversification plans. In Africa, growth prospects are linked to urban expansion and employment in technology-related services. The coworking spaces market has diverse regional conditions, so operators need location-specific pricing, product design, and partnership models. A format that succeeds in a mature urban hub may not fit a fast-growing secondary city or an emerging business district.
Competitive Landscape
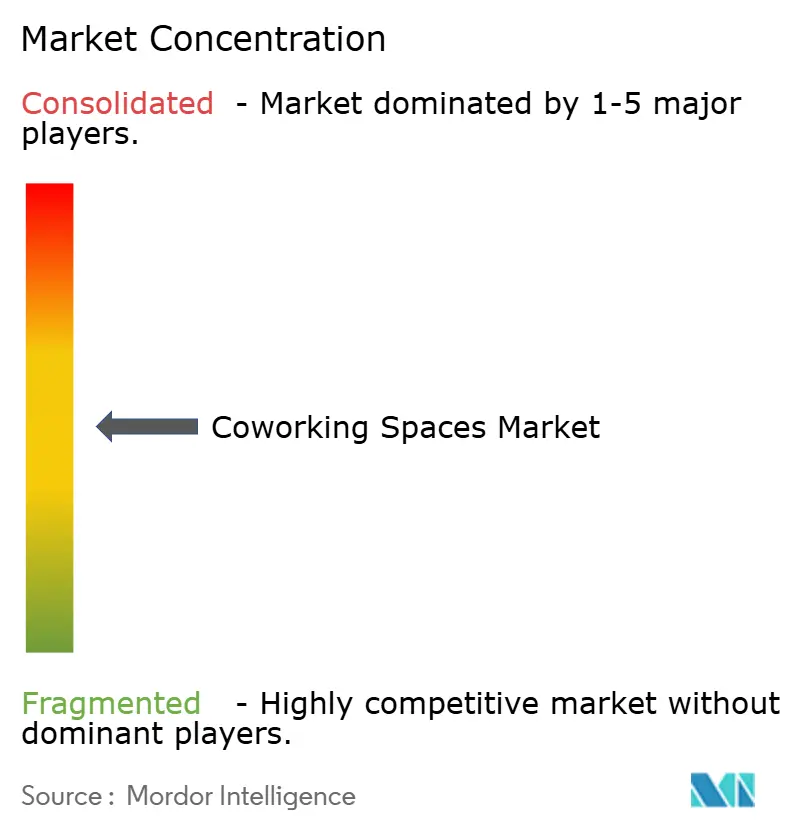
The coworking spaces market is moderately concentrated, with major global platforms competing alongside numerous regional and local operators. International Workplace Group (IWG) operates more than 4,260 centers across over 120 countries, supported by a capital-light expansion strategy. In the first half of 2026, all but two of its 496 signings used management agreements or franchise partnerships, enabling network growth while limiting direct lease exposure. WeWork also extends its reach through partner locations and standardized booking services. Large operators benefit from their broad networks, enterprise relationships, technology, and ability to serve corporate clients across multiple cities.
Strategic transactions and partnerships are strengthening competition. Yardi’s acquisitions of Deskpass and Hubble expanded its flexible workspace technology portfolio, while WeWork increased its Coworking Partner Network to 2,000 locations in February 2026. IWG’s record capital-light signings in 2025 further demonstrate the importance of franchise and management models. These developments allow operators to expand coverage without owning or leasing every location, increasing competitive pressure on smaller providers. However, regional operators can remain competitive through local relationships, specialized offerings, and targeted customer segments.
Growth opportunities remain in secondary cities, emerging business hubs, and regulated sectors that require secure, customized workspaces. Providers serving banking, financial services, insurance, healthcare, and legal clients can differentiate themselves through data protection and visitor access controls. Dedicated global capability center operators may also command premium pricing through tailored facilities and operational expertise. Nevertheless, smaller operators face pressure from transparent pricing, rising service expectations, and competition from established networks. Their ability to maintain profitability will depend on location advantages, service differentiation, and efficient operations.
Coworking Spaces Industry Leaders
-
IWG plc
-
WeWork Companies LLC
-
The Office Group Ltd
-
Mindspace Business Parks REIT
-
Industrious
- *Disclaimer: Major Players sorted in no particular order
Coworking Spaces Market Companies Covered in this Report
- IWG plc
- WeWork Companies LLC
- The Office Group Ltd
- Mindspace Business Parks REIT
- Industrious
- Impact Hub GmbH
- Talent Garden S.r.l.
- Huckletree
- betahaus
- WorkRepublic GmbH
- Fora Space
- Second Home
- Tribes
- Servcorp Ltd
- Techspace Group Ltd
- Morning
- Cubo Work
- Orega
- Runway East
- Wizu Workspace
- Desana
- Hubble
- The Executive Centre
Recent Industry Developments in Coworking Spaces Market
- August 2026: IWG plc acquired Wojo from Bouygues Immobilier and Accor Group after receiving approval from the French Competition Authority. Wojo operates 17 centers in France, covering 100,000 m² and serving more than 900 companies. The combined IWG and Wojo network will operate around 157 centers across France.
- April 2026: WeWork launched WeWork Go, deploying private office pods in high-traffic locations including airports and convention centers, extending flexible workspace access into infrastructure-embedded environments and reaching mobile professionals who do not operate from WeWork's conventional leased network.
- March 2026: IWG acquired Design Offices, Germany’s largest premium flexible workspace operator, from EMH Partners and Art-Invest Real Estate. The acquisition included 50 locations across 15 German cities, covering 260,000 m² and generating USD 153 million in annual revenue.
Global Coworking Spaces Market Report Scope
Segmentation Overview
| Small |
| Medium |
| Large |
| IT and ITES |
| BFSI |
| Business Consulting and Professional Services |
| Other Services (Retail, Life Sciences, Energy, Legal) |
| Freelancers |
| Enterprises |
| Start-ups and Others |
| North America | United States |
| Canada | |
| Mexico | |
| South America | Brazil |
| Argentina | |
| Rest of South America | |
| Europe | Germany |
| United Kingdom | |
| France | |
| Italy | |
| Spain | |
| Russia | |
| Rest of Europe | |
| Asia-Pacific | China |
| India | |
| Japan | |
| South Korea | |
| Australia | |
| Rest of Asia-Pacific | |
| Middle East | United Arab Emirates |
| Saudi Arabia | |
| Rest of Middle East | |
| Africa | South Africa |
| Nigeria | |
| Egypt | |
| Rest of Africa |
| By Size and Scale of Facility | Small | |
| Medium | ||
| Large | ||
| By Sector | IT and ITES | |
| BFSI | ||
| Business Consulting and Professional Services | ||
| Other Services (Retail, Life Sciences, Energy, Legal) | ||
| By End User | Freelancers | |
| Enterprises | ||
| Start-ups and Others | ||
| By Geography | North America | United States |
| Canada | ||
| Mexico | ||
| South America | Brazil | |
| Argentina | ||
| Rest of South America | ||
| Europe | Germany | |
| United Kingdom | ||
| France | ||
| Italy | ||
| Spain | ||
| Russia | ||
| Rest of Europe | ||
| Asia-Pacific | China | |
| India | ||
| Japan | ||
| South Korea | ||
| Australia | ||
| Rest of Asia-Pacific | ||
| Middle East | United Arab Emirates | |
| Saudi Arabia | ||
| Rest of Middle East | ||
| Africa | South Africa | |
| Nigeria | ||
| Egypt | ||
| Rest of Africa | ||
Key Questions Answered in the Report
What is the projected value of the coworking spaces market by 2032?
The coworking spaces market size is projected to reach USD 43.16 billion by 2032, from USD 28.12 billion in 2027, at an 8.95% CAGR.
Which facility format leads global revenue?
Medium-sized centers lead global revenue, with a 45.1% share in 2026.
Which customer group contributes the most revenue?
Enterprises lead, accounting for 43.4% of global revenue in 2026.
Which region is growing fastest through 2032?
Asia-Pacific is projected to grow at a 10.34% CAGR through 2032, supported by demand in India and other regional hubs.
Why are corporate customers using flexible workspaces?
Companies use flexible workspaces to manage hybrid schedules, reduce upfront costs, and support employees across locations.
What is the largest risk for coworking operators?
Long lease commitments can pressure profitability when membership revenue and occupancy do not cover operating costs.