
Cotton Market Analysis by Mordor Intelligence
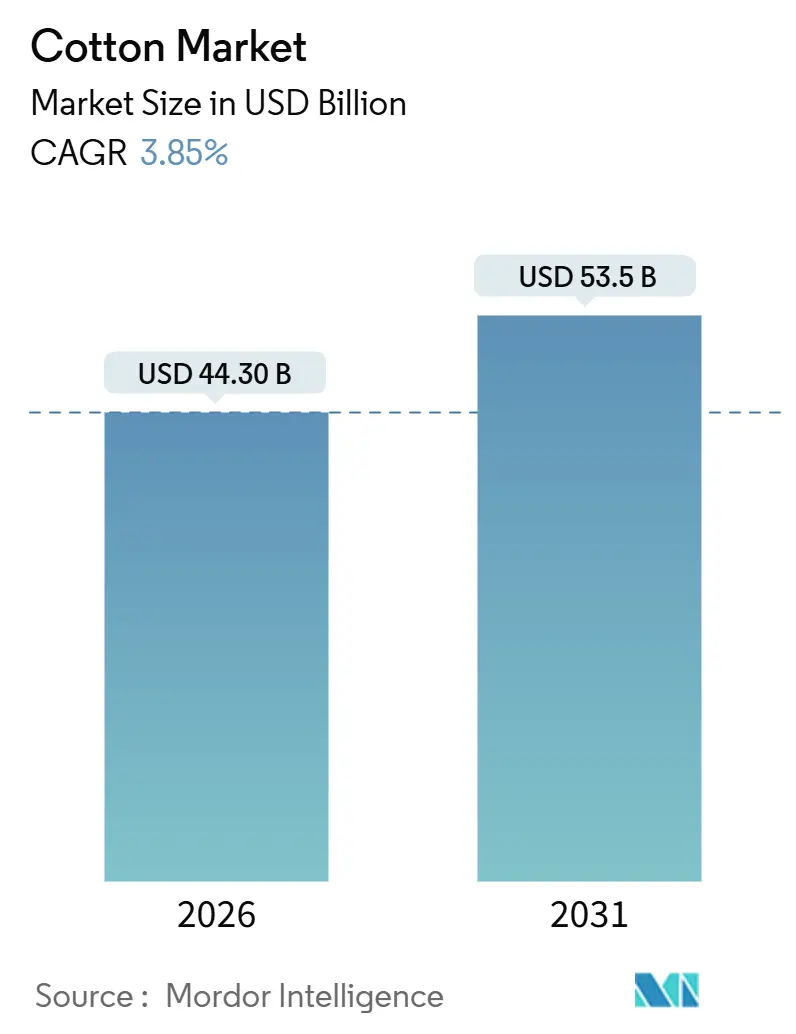
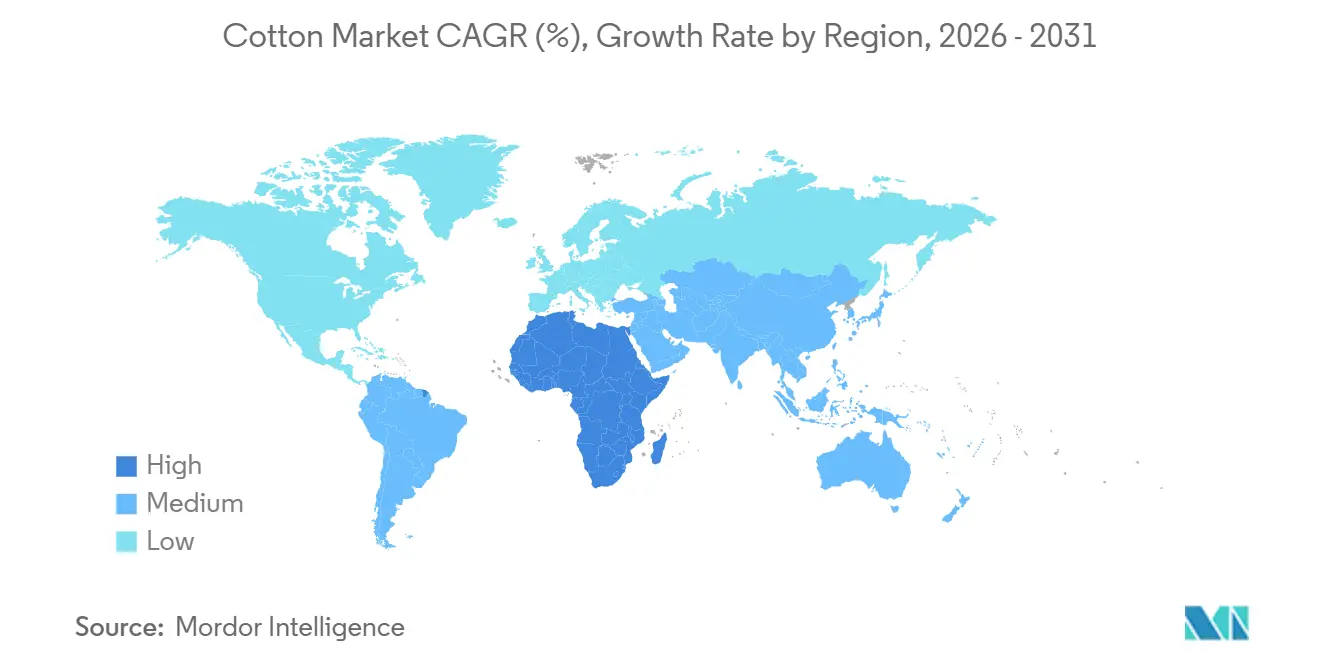
The cotton market size is USD 44.3 billion in 2026 and is projected to reach USD 53.5 billion by 2031, advancing at a 3.85% CAGR over the forecast period. Demand acceleration in the Asia-Pacific region, sustained biotechnology uptake, and brand-led sustainability premiums are driving revenue growth, yet water scarcity, rising input costs, and pest resistance are tempering the expansion[1]. The Asia-Pacific region holds the largest share of the cotton market, driven by China's dominant spinning industry and India's dual role as the largest cotton producer and a leading exporter. Africa is the fastest-growing region, driven by the efforts of West African governments to expand seed programs and enhance logistics corridors. In 2024, the adoption of biotech seeds reached 78.4% of the planted area, resulting in global yields that increased by up to 25.0% under moderate pest pressure. Additionally, regenerative agriculture contracts are offering a 10%-15% premium on verified fiber output, promoting the adoption of these practices in countries such as India and Pakistan.
Key Report Takeaways
- By geography, Asia-Pacific captured 60.4% of the 2025 consumption volume of the cotton market share, while Africa is projected to expand at a 4.0% CAGR through 2031.
Note: Market size and forecast figures in this report are generated using Mordor Intelligence’s proprietary estimation framework, updated with the latest available data and insights as of January 2026.
Market Trends and Insights
Drivers Impact Analysis of Cotton Market*
| Driver | (~) % Impact on CAGR Forecast | Geographic Relevance | Impact Timeline |
|---|---|---|---|
| Biotech-enabled yield gains | +0.8% | Global, with highest adoption in United States, India, Brazil, and Australia | Medium term (2-4 years) |
| Regenerative farming premiums | +0.5% | North America and Europe brand-sourcing regions, spill-over to India and Turkey | Long term (≥ 4 years) |
| Surge in organic cotton demand | +0.4% | Global, concentrated in India, Europe and United States | Medium term (2-4 years) |
| Government minimum-support-price programs | +0.6% | India, China, Pakistan and Turkey | Short term (≤ 2 years) |
| Digitized supply-chain traceability | +0.3% | Global, early adoption in United States, Europe, and Australia | Long term (≥ 4 years) |
| Climate-resilient seed varieties | +0.5% | Global, priority in water-stressed regions (Pakistan, Central Asia, Texas, Australia) | Medium term (2-4 years) |
| Source: Mordor Intelligence | |||
Biotech-Enabled Yield Gains
Genetically modified cotton now covers 78.4% of global acreage, pushing average yields up by 15%-25% compared with conventional cultivars[2]. Indian lint yields increased from 460 kg/ha in 2002 to 510 kg/ha in 2024, while United States farmers maintained levels close to 950 kg/ha by stacking insect- and herbicide-tolerance traits. Gene-editing programs at Texas A&M University delivered drought-tolerant lines that preserved 90% of irrigated yield under 40% water cuts during 2025 field trials[3]. The United States Department of Agriculture (USDA) has fast-tracked the approval of certain gene-edited crops, while the European Union's oversight continues to treat them as genetically modified organisms, thereby delaying regional rollouts. Licensing fees of USD 50-80/ha still limit adoption among sub-Saharan smallholders, underscoring the need for subsidy alignment.
Regenerative Farming Premiums
Brand commitments are reshaping procurement habits. H&M Hennes & Mauritz AB has committed to ensuring that all cotton will be either recycled or sustainably sourced by 2030, with 20.0% meeting regenerative criteria. Levi Strauss and Company enrolled 10,000 ha under regenerative protocols across India and Pakistan in 2025, paying a 10%-15% premium and delivering soil-carbon gains of 0.5 metric tons/ha annually. The United States Cotton Trust Protocol linked 2,500 farms to a digital dashboard that brands query for verified soil, water, and carbon metrics. Certification outlays of USD 30-USD 100/ha remain a hurdle, but cooperative aggregation is helping to ease the cost per grower.
Surge in Organic-Cotton Demand
Organic lint output reached 342,000 metric tons in 2024-25, equivalent to 1.4% of global production and fetching premiums of 20%–30% over conventional fiber. India alone supplied 51% of the total, followed by Turkey at 12% and China at 10%. The Global Organic Textile Standard (GOTS) rules require a 3-year pesticide-free conversion, which caps yields at 60%–70% of conventional levels. Patagonia Inc. secured 100% GOTS-certified lint for its flagship line in 2025, committing to floor prices 25% above local benchmarks. Consumer willingness to pay remains anchored in North America and Europe, although uptake in emerging markets is growing slowly.
Government Minimum-Support-Price Programs
India's scheme supported 35 million growers and guaranteed a price of USD 8,550 per metric ton (INR 71,210 per metric ton) for medium-staple lint in 2025-26, ensuring a 50% cost-plus return. China's reserve system concluded 2025 with 3.2 million metric tons purchased at USD 2,600 per metric ton (CNY 18,600 per metric ton), which buffered domestic quotes while distorting import flows. Pakistan's sporadic support fund intervened at USD 7,625 per metric ton (PKR 212,500 per metric ton) during late 2024, and the United States opted for revenue insurance over flat price floors, with 85% of acreage enrolled in Agriculture Risk Coverage programs in 2025.
Restraints Impact Analysis of Cotton Market*
| Restraint | (~) % Impact on CAGR Forecast | Geographic Relevance | Impact Timeline |
|---|---|---|---|
| Water-scarcity regulations | –0.6% | California, Pakistan's Indus Basin, Central Asia, and India | Short term (≤ 2 years) |
| Escalating farm-input costs | –0.5% | Global, with impacts most acute in import-dependent sub-Saharan and Southeast Asian regions | Short term (≤ 2 years) |
| Volatile trade-policy shifts | –0.4% | United States, China, and African Growth and Opportunity Act beneficiaries | Medium term (2-4 years) |
| Pest-resistance proliferation | –0.4% | India, Pakistan, United States Southeast, Brazil, and Australia | Medium term (2-4 years) |
| Source: Mordor Intelligence | |||
Water-Scarcity Regulations
California’s Sustainable Groundwater Management Act displaced 15,000 ha of land after full enforcement in 2025[4]. Pakistan’s Indus River System Authority lowered Punjab and Sindh canal flows by 25% in the 2024 kharif season, trimming the area by 8%. Uzbekistan’s acreage slid to 980,000 ha in 2024 amid the Aral Sea's collapse. The state of Maharashtra in India mandated the use of drip systems from 2024, adding USD 480/ha (INR 40,000/ha) in capital outlays for smallholders. Brands now request ISO 14046 water-footprint audits, pushing compliance costs higher.
Volatile Trade-Policy Shifts
The United States' 25% tariffs on Chinese cotton textiles remained in place through 2025, redirecting spinning to Vietnam and Bangladesh. The United States Uyghur Forced Labor Prevention Act enforcement blocked Xinjiang-source lint, indirectly constraining 20% of China’s third-country imports. Renewal uncertainty surrounding the African Growth and Opportunity Act (AGOA) led to a freeze in long-term sourcing from Lesotho and Kenyan mills in 2025. India reinstated a 5% export duty in November 2025, following a surge in domestic prices that disrupted exports to Bangladesh and Vietnam.
*Our forecasts treat driver/restraint impacts as directional, not additive. The impact forecasts reflect baseline growth, mix effects, and variable interactions.
Geography Analysis
APAC Cotton Market
Asia-Pacific generated 60.4% of the cotton market size in 2025, buoyed by China’s 6.0 million metric tons output and India’s 5.8 million metric tons harvest. China’s 110 million-spindle network consumed domestic lint alongside 2.6 million metric tons of imports in 2024, mostly from the United States, Brazil, and Australia. India shipped 1.2 million metric tons in 2024 to Bangladesh, Vietnam, and China under MSP-buffered pricing. Australia bounced back in 2024, following helpful rainfall, and exported 95.0% of its output. Southeast Asian mills accelerated purchases due to the European Union Deforestation Regulation (EUDR) compliance requirements, thereby lifting the region’s strategic edge. Asia-Pacific, however, faces mounting water-allocation pressure in Maharashtra, Gujarat, and Xinjiang that could cap expansion.
Africa Cotton Market
Africa exhibits the fastest 4.0% CAGR through 2031, with Benin, Burkina Faso, and Mali expanding the seeded area by 12% between 2023 and 2025 through seed distribution, fertilizer subsidies, and corridor upgrades. Benin harvested 720,000 metric tons in the 2024-25 season, exporting 90% of the production through the port of Cotonou. Egypt maintains an average of 180,000 metric tons of extra-long-staple lint annually, which earns premiums of 40%–50%, but competes with higher-margin vegetables in the Nile Delta. South Africa stabilized at 18,000 metric tons in 2024 with full Bt adoption, yet progress is hindered by infrastructure gaps in neighboring countries, where ginning delays shave 5%-8% off prices at delivery.
The Americas, Europe and Middle East Cotton Market
North America and South America diverge. The United States harvested 3.0 million metric tons in 2024-25, down 6% due to the Texas drought, with 85% of acreage carrying crop insurance cushions under the latest farm bill. Brazil’s Cerrado doubled cropping, touching 2.8 million metric tons and gaining share in China’s import mix due to second-crop sequences. Argentina's land area has increased to 622,000 ha in 2024, as high international demand and stabilizing economic policies, such as the removal of certain export restrictions, have made cotton more profitable for Argentine producers. In Europe and the Middle East, Turkey supplied 250,000 metric tons in 2024, mainly for domestic conversion. The European Union's Deforestation Regulation reduced compliance costs by 2%–3% of the free-on-board value, favoring exporters that are traceability-ready.
Regulatory Landscape
Cotton is shaped by a combination of farm-income support, import controls, and downstream due-diligence requirements that differ across major consuming and exporting regions. In the United States, USDA actions in 2026 highlighted policy support across the farm-textile chain, including the May 2026 Great American Cotton Plan and USDA AMS adjustments to the Economic Adjustment Assistance for Textile Mills program, which increased the payment rate to 5 cents per pound effective February 24, 2026 (retroactive applicability to August 1, 2025). In China, the National Development and Reform Commission continued the target-price based policy and updated TRQ administration in January 2026 with year-round access and faster electronic approvals, influencing import timing and stock management.
Trade and sustainability compliance remain key factors in sourcing decisions. The European Union amended timelines for the EU Deforestation Regulation (EUDR), delaying its application date to December 30, 2026, which changes near-term compliance sequencing for traceability-ready exporters and mills serving EU brands. At the multilateral level, WTO cotton workstreams and high-level cotton discussions at MC14 in 2026 kept attention on trade-distorting domestic support, while mobilization efforts for African cotton processing were channeled through institutional platforms referenced in WTO discussions (including Afreximbank and ITFC), reinforcing the policy push toward more local value addition in producing countries.
Value Chain Analysis
The cotton value chain runs from input supply (seed traits, fertilizers, crop protection, and water or irrigation) through cultivation and harvesting, ginning and classing, merchant aggregation and export logistics, and then into spinning and downstream textile manufacturing. Seed and trait licensing remains concentrated among a small set of global providers (notably Bayer AG, Corteva Agriscience, and BASF SE), while a fragmented grower base of smallholders feeds into ginning networks that determine lint uniformity and contamination control. On the demand side, large-scale spinning capacity in Asia anchors consumption, with China acting as a major importer and stockholder, which increases the value of bale quality, reliable shipment execution, and documentation for brand and regulatory traceability.
Trading and logistics are central value-capture points, given the scale of cross-border flows handled by multinational merchants (such as Cargill, Louis Dreyfus Company, Olam Group, and Glencore Agriculture). Export competitiveness has tightened as Brazil expanded its role as a leading exporter in 2024/25 on the back of successive strong crops, while global cotton trade contracted by 4.1% in 2024/25, lifting the premium on efficient port and inland logistics. In the United States, industry programs and funding mechanisms (including Cotton Board assessments and Cotton Incorporated research and promotion budgets) continue to support agronomy, fiber quality, and demand-building, reinforcing linkages between farm practices, bale attributes, and textile brand requirements.
Competitive Landscape
Roughly 100 million smallholders grow lint on 2-5 ha plots worldwide, creating fragmentation at the farm and ginning level. India’s 2,800 gins and Pakistan’s 1,200 gins each handle about 1,500 bales a season, whereas Australia’s 80 large-format units provide uniformity that wins a 3.0%-5.0% price edge in international tenders. Seed royalties are concentrated among three firms, including Bayer AG, Corteva Agriscience, and BASF SE, which are key providers of cotton seeds. These companies have filed over 60 patents for drought-tolerant traits since 2023. Additionally, multinational merchants such as Cargill, Incorporated, Louis Dreyfus Company B.V., Olam Group Limited, and Glencore Agriculture Limited dominate cross-border cotton flows.
Spinning shows regional consolidation. China’s top 20 mills process more than 200,000 metric tons each, verticalizing into fabric and dyeing. Indian groups, such as Welspun Limited and Trident Limited, mirror that scale, shipping yarn to Bangladesh and Vietnam clusters, drawn by lower labor costs. Vietnam’s spindle count surged 18.0% from 2023 to 2025, shaving 8.0%-10.0% off Chinese yarn landed prices through shorter freight lines. Technology adoption widens efficiency gaps, with Deere & Company's See and Spray system reducing chemical use by 60.0% across 50,000 hectares in 2025, resonating with sustainability-driven buyers.
Emerging disruptors include startup FibreTrace, which raised USD 15 million in 2024 to scale DNA-based origin tagging, and Oritain, which secured USD 20 million to expand its isotopic fingerprinting capabilities. Lab-grown cotton from Galy has collected USD 33 million to pilot bioreactor fiber, aiming for a 30.0% cost reduction by 2028. In 2025, the alignment of blockchain standards between the Better Cotton Initiative and Cotton 2040 reduced brand integration costs by 40.0%. These moves underscore a competitive landscape where traceability, trait innovation, and logistics mastery are key factors in determining value capture.
Market Opportunities and Future Outlook
Opportunities are concentrating in verified, lower-impact cotton supply and in productivity tools that directly address water and input constraints. Brand-led sourcing programs already attach price signals to outcomes: the United States Cotton Trust Protocol expanded data-driven verification for farm practices, and Levi Strauss and Company enrolled 10,000 ha under regenerative protocols across India and Pakistan in 2025 with a 10%-15% premium for verified output. Traceability investments are also becoming more standardized, supported by industry alignments such as the 2025 blockchain standards linkage between the Better Cotton Initiative and Cotton 2040, which reduced brand integration costs and lowers friction for multi-origin sourcing programs.
A second area of opportunity is in enabling compliance and trade continuity where regulation and market access are tightening. The EU decision to delay EUDR application to December 30, 2026 provides an additional implementation window for exporters, merchants, and mills to harden due-diligence workflows and digital identifiers without disrupting near-term shipment programs. On the supply side, water regulation and irrigation constraints (for example, California groundwater limits fully enforced in 2025 and mandated drip systems in parts of India from 2024) elevate the value of climate-resilient seed pipelines and precision agronomy that help preserve yields under water cuts, consistent with the report's emphasis on drought-tolerant development programs. In trading and logistics, investments that improve handling, storage, and shipment reliability along major export corridors, including Brazil to Asia routes, create space for merchants and terminal operators to win share where mills prioritize consistent quality and on-time delivery.
Recent Industry Developments in Cotton Market
- May 2026: The United States Department of Agriculture launched the Great American Cotton Plan to strengthen the cotton farm economy, with measures aimed at supporting producers and reinforcing domestic textile supply-chain activity. The program framing aligns farm-support tools with downstream manufacturing priorities, which can influence planted-area economics, marketing choices, and sourcing narratives for U.S.-origin lint.
- December 2025: India’s Ministry of Textiles introduced the Kasturi Cotton Bharat program alongside a five-year Cotton Productivity Mission covering certification, traceability, and digital MSP procurement. QR-coded, traceable bales link quality differentiation to export acceptance, improving the ability of Indian cotton to compete in brand-led procurement that requires auditable origin and handling.
- June 2025: Better Cotton moved to a third-party certification system and introduced an updated product label to enable traceable supply-chain claims for certified sustainable cotton. The shift strengthens assurance for brands and retailers and increases the value of compliant farm-to-gin documentation for merchants and mills serving sustainability-driven demand.
Cotton Market Report Scope and Research Methodology
Market Definition and Coverage
For this sizing, the cotton market is the value of raw cotton moving from growers into the first commercial transaction, which is then used by ginners, traders, and mills. The metric is reported in USD and is built around physical supply flows and observed price levels.
Scope exclusions: We exclude downstream yarn, fabric, apparel, and other finished textile value add, and we also exclude man-made fiber blends counted under synthetic fiber markets.
Segments Covered in This Report
- By Geography
- North America
- United States
- Production Analysis (Area Harvested, Yield, and Production Volume)
- Consumption Analysis (Consumption Value and Volume)
- Import Market Analysis (Import Value, Volume, and Key Supplying Markets)
- Export Market Analysis (Export Value, Volume, and Key Destination Markets)
- Wholesale Price Trend Analysis and Forecast
- Regulatory Framework
- List of Key Players
- Logistics and Infrastructure
- Seasonality Analysis
- Canada
- Production Analysis (Area Harvested, Yield, and Production Volume)
- Consumption Analysis (Consumption Value and Volume)
- Import Market Analysis (Import Value, Volume, and Key Supplying Markets)
- Export Market Analysis (Export Value, Volume, and Key Destination Markets)
- Wholesale Price Trend Analysis and Forecast
- Regulatory Framework
- List of Key Players
- Logistics and Infrastructure
- Seasonality Analysis
- United States
- South America
- Brazil
- Production Analysis (Area Harvested, Yield, and Production Volume)
- Consumption Analysis (Consumption Value and Volume)
- Import Market Analysis (Import Value, Volume, and Key Supplying Markets)
- Export Market Analysis (Export Value, Volume, and Key Destination Markets)
- Wholesale Price Trend Analysis and Forecast
- Regulatory Framework
- List of Key Players
- Logistics and Infrastructure
- Seasonality Analysis
- Argentina
- Production Analysis (Area Harvested, Yield, and Production Volume)
- Consumption Analysis (Consumption Value and Volume)
- Import Market Analysis (Import Value, Volume, and Key Supplying Markets)
- Export Market Analysis (Export Value, Volume, and Key Destination Markets)
- Wholesale Price Trend Analysis and Forecast
- Regulatory Framework
- List of Key Players
- Logistics and Infrastructure
- Seasonality Analysis
- Brazil
- Europe
- Russia
- Production Analysis (Area Harvested, Yield, and Production Volume)
- Consumption Analysis (Consumption Value and Volume)
- Import Market Analysis (Import Value, Volume, and Key Supplying Markets)
- Export Market Analysis (Export Value, Volume, and Key Destination Markets)
- Wholesale Price Trend Analysis and Forecast
- Regulatory Framework
- List of Key Players
- Logistics and Infrastructure
- Seasonality Analysis
- Germany
- Production Analysis (Area Harvested, Yield, and Production Volume)
- Consumption Analysis (Consumption Value and Volume)
- Import Market Analysis (Import Value, Volume, and Key Supplying Markets)
- Export Market Analysis (Export Value, Volume, and Key Destination Markets)
- Wholesale Price Trend Analysis and Forecast
- Regulatory Framework
- List of Key Players
- Logistics and Infrastructure
- Seasonality Analysis
- Russia
- Asia-Pacific
- China
- Production Analysis (Area Harvested, Yield, and Production Volume)
- Consumption Analysis (Consumption Value and Volume)
- Import Market Analysis (Import Value, Volume, and Key Supplying Markets)
- Export Market Analysis (Export Value, Volume, and Key Destination Markets)
- Wholesale Price Trend Analysis and Forecast
- Regulatory Framework
- List of Key Players
- Logistics and Infrastructure
- Seasonality Analysis
- India
- Production Analysis (Area Harvested, Yield, and Production Volume)
- Consumption Analysis (Consumption Value and Volume)
- Import Market Analysis (Import Value, Volume, and Key Supplying Markets)
- Export Market Analysis (Export Value, Volume, and Key Destination Markets)
- Wholesale Price Trend Analysis and Forecast
- Regulatory Framework
- List of Key Players
- Logistics and Infrastructure
- Seasonality Analysis
- Australia
- Production Analysis (Area Harvested, Yield, and Production Volume)
- Consumption Analysis (Consumption Value and Volume)
- Import Market Analysis (Import Value, Volume, and Key Supplying Markets)
- Export Market Analysis (Export Value, Volume, and Key Destination Markets)
- Wholesale Price Trend Analysis and Forecast
- Regulatory Framework
- List of Key Players
- Logistics and Infrastructure
- Seasonality Analysis
- Pakistan
- Production Analysis (Area Harvested, Yield, and Production Volume)
- Consumption Analysis (Consumption Value and Volume)
- Import Market Analysis (Import Value, Volume, and Key Supplying Markets)
- Export Market Analysis (Export Value, Volume, and Key Destination Markets)
- Wholesale Price Trend Analysis and Forecast
- Regulatory Framework
- List of Key Players
- Logistics and Infrastructure
- Seasonality Analysis
- China
- Middle East
- Turkey
- Production Analysis (Area Harvested, Yield, and Production Volume)
- Consumption Analysis (Consumption Value and Volume)
- Import Market Analysis (Import Value, Volume, and Key Supplying Markets)
- Export Market Analysis (Export Value, Volume, and Key Destination Markets)
- Wholesale Price Trend Analysis and Forecast
- Regulatory Framework
- List of Key Players
- Logistics and Infrastructure
- Seasonality Analysis
- Saudi Arabia
- Production Analysis (Area Harvested, Yield, and Production Volume)
- Consumption Analysis (Consumption Value and Volume)
- Import Market Analysis (Import Value, Volume, and Key Supplying Markets)
- Export Market Analysis (Export Value, Volume, and Key Destination Markets)
- Wholesale Price Trend Analysis and Forecast
- Regulatory Framework
- List of Key Players
- Logistics and Infrastructure
- Seasonality Analysis
- Turkey
- Africa
- Egypt
- Production Analysis (Area Harvested, Yield, and Production Volume)
- Consumption Analysis (Consumption Value and Volume)
- Import Market Analysis (Import Value, Volume, and Key Supplying Markets)
- Export Market Analysis (Export Value, Volume, and Key Destination Markets)
- Wholesale Price Trend Analysis and Forecast
- Regulatory Framework
- List of Key Players
- Logistics and Infrastructure
- Seasonality Analysis
- South Africa
- Production Analysis (Area Harvested, Yield, and Production Volume)
- Consumption Analysis (Consumption Value and Volume)
- Import Market Analysis (Import Value, Volume, and Key Supplying Markets)
- Export Market Analysis (Export Value, Volume, and Key Destination Markets)
- Wholesale Price Trend Analysis and Forecast
- Regulatory Framework
- List of Key Players
- Logistics and Infrastructure
- Seasonality Analysis
- Egypt
- North America
Data Sources, Market Sizing, and Validation
Desk Research
Desk research starts by mapping the cotton supply chain and assembling consistent series for planted area, yields, production, consumption, trade, and seasonality patterns for key producing and consuming countries. To keep the model grounded, we rely on public sources such as USDA and its WASDE and Cotton and Wool Outlook releases, FAOSTAT, UN Comtrade trade statistics, International Cotton Advisory Committee updates, and customs or agriculture ministry releases where available.
Once the core data series are in place, we sanity check price references using exchange-linked indicators (such as commonly tracked cents per pound benchmarks) and shipment pricing signals visible in public trade commentary and association notes. That step helps normalize values across crop years. We also use company filings, investor presentations, and trusted press to validate ginning throughput assumptions, capacity additions, and mill-side demand shifts. For additional detail, we use a paid subscription for company financials and intelligence and, where needed, a shipment-level import and export database to confirm directional trade movements. The desk research sources listed above are illustrative, and additional public documents were used for data collection, validation, and clarification.
Primary Interviews and Surveys
Primary interviews and surveys are used to stress-test the desk assumptions with participants who see cotton pricing and flow decisions firsthand, including growers, ginners, merchants, and mill procurement teams. Because cotton is a global commodity, we included discussions across major producing and consuming zones to reflect regional crop-year timing, quality mix, and export channel behavior in the final model.
Distribution of primary research fieldwork respondents
| Company type | Respondent position | Region |
|---|---|---|
| Top tier: 27% | CXOs: 15% | APAC: 50% |
| Mid tier: 58% | Functional/Unit leaders: 36% | EMEA: 29% |
| Smaller Players: 15% | Managers: 49% | Americas: 21% |
Market-Sizing & Forecasting
Sizing is built using a top-down reconstruction where global cotton value is derived by combining crop-year production and trade flow indicators with representative price levels, and then converting to a calendar-year value view where needed. After the headline total is formed, we corroborate it with selective bottom-up checks, such as sampling export unit values against volumes and cross-checking first-handler pricing against typical marketing channels, which helps correct any over-counting.
Inputs that matter for cotton are kept simple and traceable. The model uses planted area and yield trends, lint production and ending stocks, mill use and import demand signals, and export and import volumes for major corridors. Price progression is handled through observed benchmark price movements and expected quality mix shifts, rather than assuming a flat average price. For forecasting, we use scenario analysis tied to weather-driven yield outcomes, policy or subsidy changes, and expected mill demand, then narrow the final range using what interviewees consider realistic for the next few crop cycles. Where country data is missing or delayed, gaps are handled with proxy series from trade flows and nearby season averages, followed by a consistency check against global balance tables.
Data Validation & Update Cycle
Validation happens in layers, where model outputs are compared against independent signals like global balance sheets, trade shares, and price-to-volume relationships that should hold over time. When a number looks off, we trace it back to the driver (area, yield, price, or trade timing) and revise only after the underlying assumption is documented and re-checked.
Before sign-off, another analyst reviews the calculations for variance versus history and for any unit conversion issues. Follow-up outreach is triggered when a key assumption shifts or an outlier appears in a major producing region. Reports are refreshed annually, and interim updates are made when material events occur, including sharp price changes or major crop disruptions. Right before delivery, a final pass is completed so clients receive the latest updated view.
Mordor Intelligence's Cotton Market Size Compared With Other Published Estimates
Published cotton market values can differ widely because authors may count different value points in the chain, use different crop-year versus calendar-year timing, or apply prices in different ways. Differences also show up when one estimate treats cotton as a farm commodity, while another stretches the scope into textile processing and finished goods.
The main gap comes from whether the value stops at raw cotton sold into the first handler channel or whether it continues into yarn and fabric value add, which can lift totals even if physical volumes are unchanged. This study focuses on the farm-gate to first-handler value view, and Mordor Intelligence applies price normalization by aligning crop-year supply signals with observed benchmark price movements, rather than using broad average textile pricing.
Benchmark comparison
| Source | Market Size | Gaps in Research Methodology |
|---|---|---|
| Mordor Intelligence | USD 44.30 B (2026) | |
| Global Consultancy A | USD 47.30 B (2025) | Uses a different base year and tends to include broader application-led scope that can blend raw cotton value with downstream textile-related revenue, which raises the reported total. |
| Regional Consultancy B | USD 39.45 B (2024) | Anchors the market closer to textile end uses and uses an earlier base year with a slower price and demand progression, which can understate periods with stronger commodity pricing. |
The spread in the table is best explained by scope depth and timing choices, and then by how price paths are carried forward in the forecast. By keeping the market tied to measurable supply, trade, and price signals, the resulting value stays easier to reconcile with real-world cotton balances and repeatable checks.
Key Questions Answered in the Report
How large is the cotton market in 2026 and what is its growth outlook?
The cotton market size stands at USD 44.3 billion in 2026 and is on course to reach USD 53.5 billion by 2031 at a 3.85% CAGR.
Which region contributes most to global cotton supply?
Asia-Pacific accounts for 60.4% of revenue in 2025, with China and India together delivering nearly half of world output.
What share of global acreage uses biotech seed?
Biotech traits cover 78.4% of planted area and support 15%-25% higher yields under moderate pest pressure.
Why is Africa the fastest-growing cotton supplier?
West African governments are widening seed distribution, upgrading export corridors, and capturing premium demand, driving a 4.0% CAGR through 2031.
How are brands improving cotton traceability?
Platforms like TextileGenesis assign digital identifiers to each bale, while ventures such as CottonConnect Global integrate blockchain to ensure origin verification from farm to store.
What impact do water-scarcity regulations have on United States production?
California’s groundwater caps pushed 15,000 ha out of cotton, shifting acreage to alternative crops and tightening domestic supply.