
Continuous Compliance Automation Market Size and Share
Market Overview
| Study Period | 2020 - 2031 |
|---|---|
| Market Size (2026) | USD 0.8 Billion |
| Market Size (2031) | USD 3.10 Billion |
| Growth Rate (2026 - 2031) | 31.20 % |
| Fastest Growing Market | Asia-Pacific |
| Largest Market | North America |
| Market Concentration | Medium |
Major Players *Disclaimer: Major Players sorted in no particular order Image © Mordor Intelligence. Reuse requires attribution under CC BY 4.0. | |
Continuous Compliance Automation Market Analysis by Mordor Intelligence
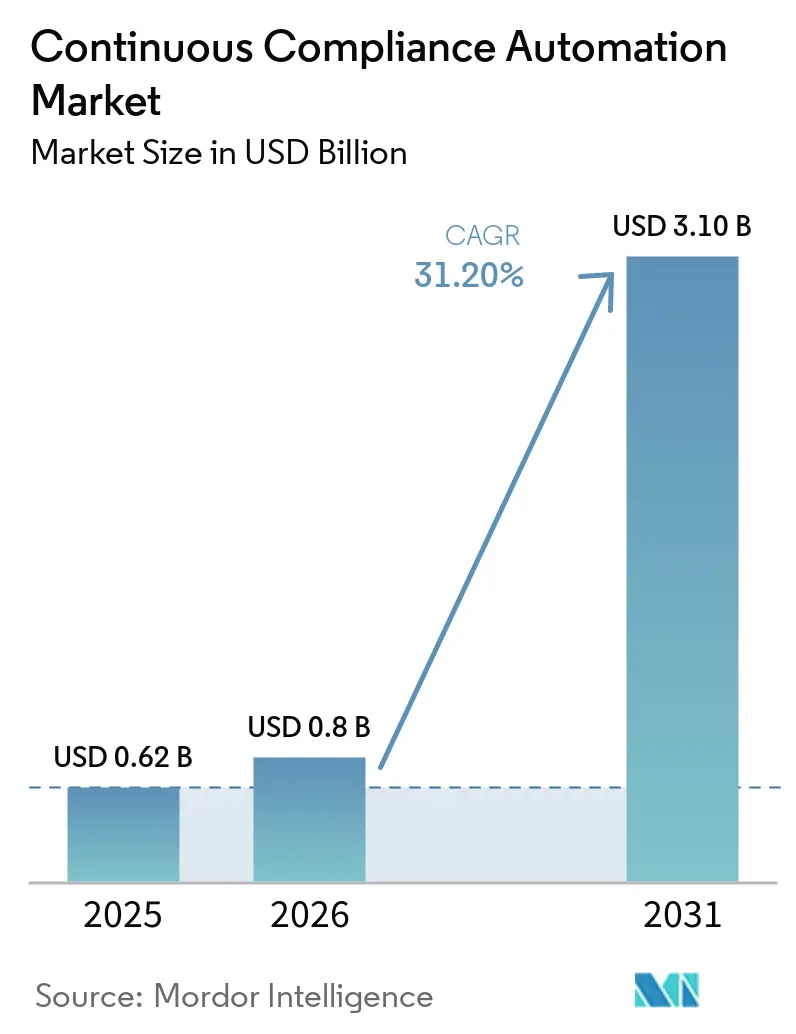
The Continuous Compliance Automation Market size was valued at USD 0.62 billion in 2025 and estimated to grow from USD 0.80 billion in 2026 to reach USD 3.10 billion by 2031, at a CAGR of 31.20% during the forecast period (2026-2031). The Continuous Compliance Automation Market is moving from periodic audit preparation toward continuous testing and evidence collection as regulatory requirements overlap across jurisdictions. DORA, PCI DSS v4.0, SEC cybersecurity disclosure rules, and wider cloud use have made annual compliance reviews insufficient for many regulated organizations. Buyers increasingly want a single platform that can map the same control evidence to SOC 2, ISO 27001, HIPAA, CMMC, and FedRAMP requirements. The category is also expanding into AI governance, as organizations need auditable records for AI inventories, model governance, and security controls. Established GRC providers and AI-native specialists are therefore competing on integration coverage, the speed of evidence collection, and the ability to support mixed cloud, on-premises, and legacy environments.
Key Report Takeaways
- By component, software held 68.29% of the Continuous Compliance Automation Market share in 2025, while services are projected to expand at a 32.56% CAGR through 2031.
- By deployment, cloud accounted for 52.41% of the Continuous Compliance Automation Market revenue in 2025, while hybrid deployment is projected to expand at a 32.28% CAGR through 2031.
- By organization size, large enterprises accounted for 70.32% of the Continuous Compliance Automation Market revenue in 2025, while SMEs are projected to expand at a 32.89% CAGR through 2031.
- By end-user industry, BFSI accounted for 32.12% of the Continuous Compliance Automation Market revenue in 2025, while healthcare and life sciences are projected to expand at a 31.66% CAGR through 2031.
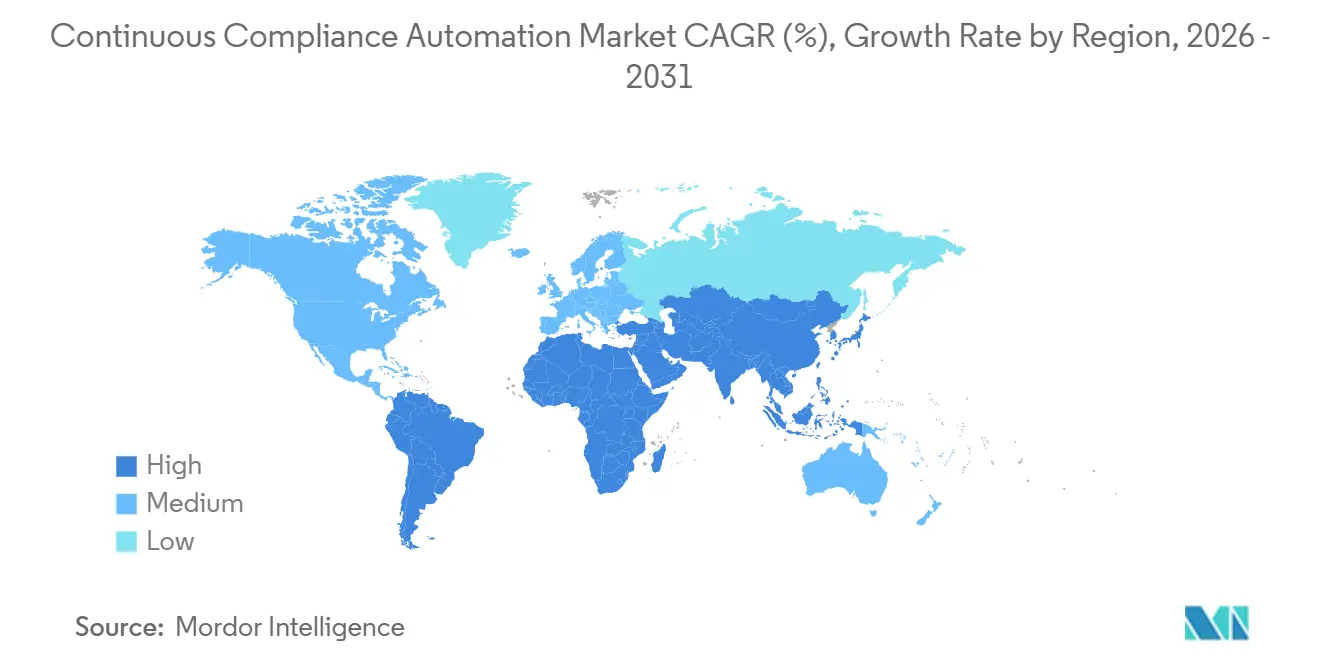
- By geography, North America accounted for 37.49% of the Continuous Compliance Automation Market revenue in 2025, while Asia-Pacific is projected to expand at a 31.90% CAGR through 2031.
Note: Market size and forecast figures in this report are generated using Mordor Intelligence’s proprietary estimation framework, updated with the latest available data and insights as of January 2026.
Global Continuous Compliance Automation Market Trends and Insights
Drivers Impact Analysis*
| Driver | (~) % Impact on CAGR Forecast | Geographic Relevance | Impact Timeline |
|---|---|---|---|
| Escalating Multi-Framework Regulatory Complexity | +8.5% | Global | Short term (≤ 2 years) |
| Shift From Point-in-Time Audits to Continuous Compliance Monitoring | +7.2% | Global | Medium term (2-4 years) |
| Expansion of Cloud and Distributed Technology Environments | +5.6% | Global, with Asia-Pacific and North America as core | Medium term (2-4 years) |
| Increasing Demand for Demonstrable Always-On Compliance Assurance | +4.2% | North America and Europe | Medium term (2-4 years) |
| Expansion of AI-Specific Compliance Obligations | +3.4% | Europe and North America, with spillover to Asia-Pacific | Short term (≤ 2 years) |
| Rising Customer and Supply-Chain Assurance Requirements | +2.6% | Global | Medium term (2-4 years) |
| Source: Mordor Intelligence | |||
Escalating Multi-Framework Regulatory Complexity
The Continuous Compliance Automation Market is supported by obligations that arrive faster than many internal compliance teams can absorb. The World Economic Forum reported that 76% of surveyed CISOs said regulation fragmentation greatly affects their ability to maintain compliance. DORA has applied to EU financial entities since January 17, 2025, and it requires documented, testable digital operational resilience across several areas of ICT risk management. PCI DSS v4.0 expanded its requirements, making 47 new requirements effective in March 2025, including ongoing detection expectations under Requirement 11.6.1. These changes make manual evidence gathering more difficult when a single organization must satisfy multiple frameworks at once. Platforms that reuse a single control across multiple mappings can reduce duplicate documentation in financial services and healthcare.
Shift From Point-in-Time Audits to Continuous Compliance Monitoring
The Continuous Compliance Automation Market benefits as organizations reconsider audit programs that only demonstrate compliance at a single point in time. Configuration changes in cloud environments can occur shortly after an audit closes, leaving material gaps between assessment periods. Qualys reported in September 2026 that organizations using continuous monitoring can reduce audit preparation time by 60-80% and experience 45% fewer audit findings than organizations using periodic assessment methods. SOC 2 Type II, ISO 27001, and PCI DSS programs increasingly favor evidence that is collected throughout the assessment period. Continuous evidence changes a concentrated pre-audit exercise into a recurring operating process. This approach can appeal to both compliance leaders and operating teams because the evidence is available when customers or auditors request it.
Expansion of Cloud and Distributed Technology Environments
The Continuous Compliance Automation Market is expanding as enterprises distribute regulated workloads across public cloud, private infrastructure, and legacy systems. Inconsistent enforcement of controls across cloud providers can create policy drift, making it difficult to demonstrate a consistent security posture. AWS has expanded Security Hub to help unify security operations across multicloud environments. Datadog added support for frameworks, including APRA CPS 234, MAS TRM, UK Cyber Essentials, the EU Cyber Resilience Act, and Australia Essential Eight, in 2026. This shift favors platforms that can connect AWS, Azure, Google Cloud, and Oracle Cloud Infrastructure via a single policy layer. It also supports compliance-as-code practices that validate controls in deployment pipelines before production release.
Increasing Demand for Demonstrable Always-On Compliance Assurance
The Continuous Compliance Automation Market is also supported by customer procurement processes that increasingly examine a supplier's security posture before a technical evaluation. Security questionnaires, trust centers, and certifications now influence how prospective buyers assess vendor readiness. Suppliers with clear, current compliance evidence can address those reviews more efficiently than suppliers relying on static documents. Automated trust-center information can draw on current evidence from connected systems rather than relying on static documents. This gives a platform value for both assurance operations and commercial teams. It may be especially useful for smaller suppliers that face certification expectations without large dedicated compliance teams.
Restraints Impact Analysis*
| Restraint | (~) % Impact on CAGR Forecast | Geographic Relevance | Impact Timeline |
|---|---|---|---|
| Legacy-System Integration and Total Cost of Ownership | -3.2% | Global | Long term (≥ 4 years) |
| Fragmented Regulatory Taxonomies and Control Interpretations | -2.0% | Global | Medium term (2-4 years) |
| Uncertainty Around AI-Generated Evidence Validation and Accountability | -1.4% | Europe and North America, with spillover to Asia-Pacific | Short term (≤ 2 years) |
| Non-API, OT, and Air-Gapped Environment Blind Spots | -0.8% | Industrial sectors, Middle East and Africa | Long term (≥ 4 years) |
| Source: Mordor Intelligence | |||
Legacy-System Integration and Total Cost of Ownership
Legacy-system integration remains a structural constraint on the Continuous Compliance Automation Market. Financial institutions and industrial organizations often depend on mainframes, enterprise resource planning systems, or operational technology that lack modern application programming interfaces. DORA requires regulated financial entities to document and manage ICT risks, which can expose poorly documented legacy environments as compliance liabilities.[1] A platform without relevant connectors may produce incomplete evidence, which limits the value of automated testing. Custom work can extend an implementation from days to months and raise the total cost of ownership. This constraint is most material for mid-tier regulated organizations with limited compliance engineering resources.
Fragmented Regulatory Taxonomies and Control Interpretations
Fragmented regulatory taxonomies can hinder the growth of the Continuous Compliance Automation Market. ISO/IEC 27001, NIST CSF 2.0, and SOC 2 can each address access management, encryption, and incident response through separate control structures. A 2026 academic paper on the AspisAI framework found that translating multiple standards into a machine-interpretable control model requires complex cross-standard mapping. The work increases when an organization adds a second or third framework to an existing program. Teams may need to revise evidence templates and align each mapping with auditor expectations before automation is reliable. The resulting delay can reduce the near-term speed-to-compliance benefit that buyers expect.
*Our forecasts treat driver/restraint impacts as directional, not additive. The impact forecasts reflect baseline growth, mix effects, and variable interactions.
Segment Analysis
By Component: Software Infrastructure Leads as Services Narrow the Gap
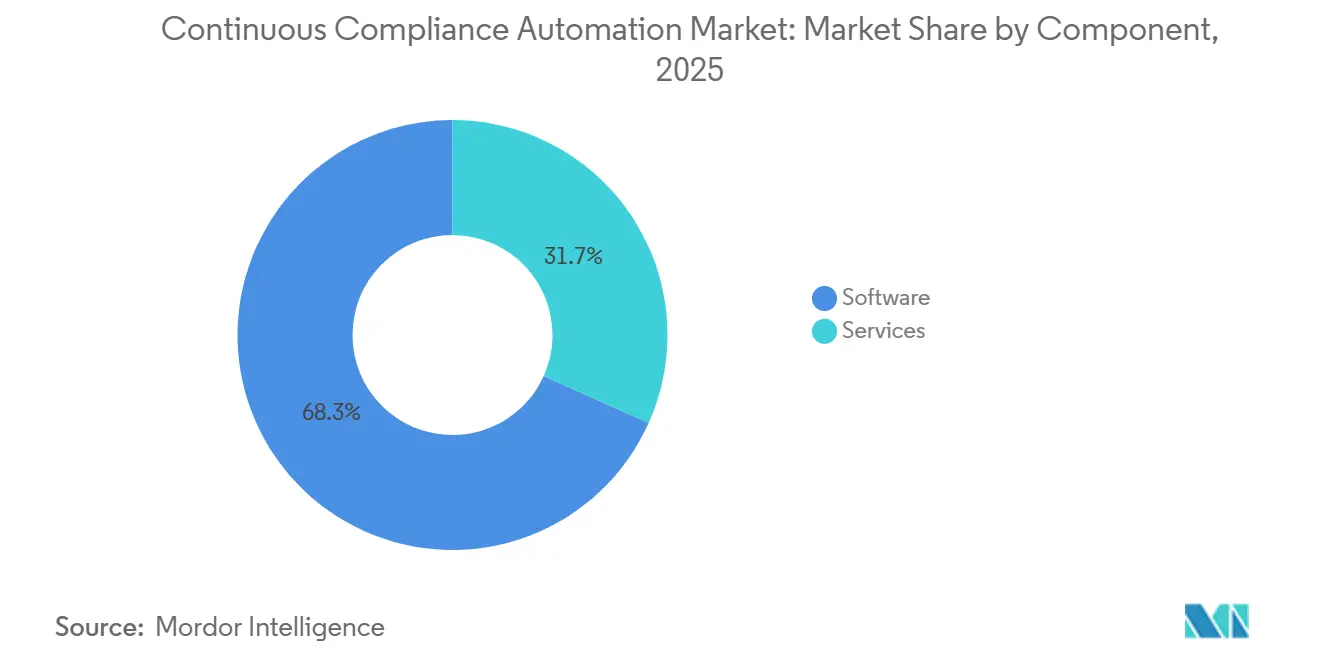
Software held 68.29% of category revenue in 2025. It provides the connectors, control libraries, and framework mappings that turn infrastructure data into audit-ready evidence. These capabilities are difficult to replicate through periodic consulting alone. Software platforms can collect evidence automatically, test controls, and display results in integrated dashboards. Vanta introduced its Control Framework in 2026 as a common-control layer that maps evidence across several frameworks. This model can reduce the repeated documentation that separate evidence sets require. It also helps buyers manage compliance across multiple standards within a single operating environment. These functions explain why platform investment remained concentrated in software.
Services are projected to expand at a 32.56% CAGR through 2031. The services portion of the Continuous Compliance Automation Market supports audit readiness, implementation, and managed compliance operations. Continuous monitoring-as-a-service can remove an upfront resource barrier for mid-market buyers. Providers can assume recurring control testing and evidence management under a subscription arrangement. As automated collection increases, service teams are shifting toward interpreting regulatory changes and managing auditor relationships. The ISO/IEC 27001:2022 revision contains 93 Annex A controls, including cloud security and threat intelligence controls that may require new control mapping. This work maintains a role for specialist services even when evidence collection becomes more automated. The two components are therefore complementary rather than interchangeable.
By Deployment: Cloud Anchors the Category as Hybrid Reshapes Enterprise Architecture
Cloud deployment accounted for 52.41% of revenue in 2025. Cloud-based platforms align with modern enterprise environments because they can collect infrastructure telemetry through read-only connections. The Continuous Compliance Automation Market size for cloud deployment reflects demand for continuous evidence from AWS, Azure, and Google Cloud environments. This approach can reduce manual collection activity and support more frequent control validation. It is particularly suited to organizations with cloud-native applications and distributed engineering teams. Platforms also use cloud delivery to update regulatory content and control libraries without an on-site software rollout. These capabilities keep cloud deployment central to category demand. Data residency and air-gapped requirements, however, limit a full move away from other models.
Hybrid deployment is projected to expand at a 32.28% CAGR through 2031. Many regulated organizations keep core systems on premises while building new applications in public cloud environments. The Continuous Compliance Automation Market needs to support both environments to provide a complete evidence record. This is important in BFSI, healthcare, and defense, where legacy workloads can remain essential. The Monetary Authority of Singapore (MAS) Technology Risk Management (TRM) guidelines in Singapore and APRA CPS 234 in Australia have reinforced demand for platforms that can support jurisdiction-specific evidence storage and controls.[2] On-premises deployment remains relevant for air-gapped government systems and strict data-residency needs. Hybrid capability can therefore become a practical selection requirement, rather than a secondary feature. Vendors unable to cover all environments risk leaving evidence gaps that auditors can identify.
By Organization Size: Large Enterprises Define Demand While SMEs Accelerate
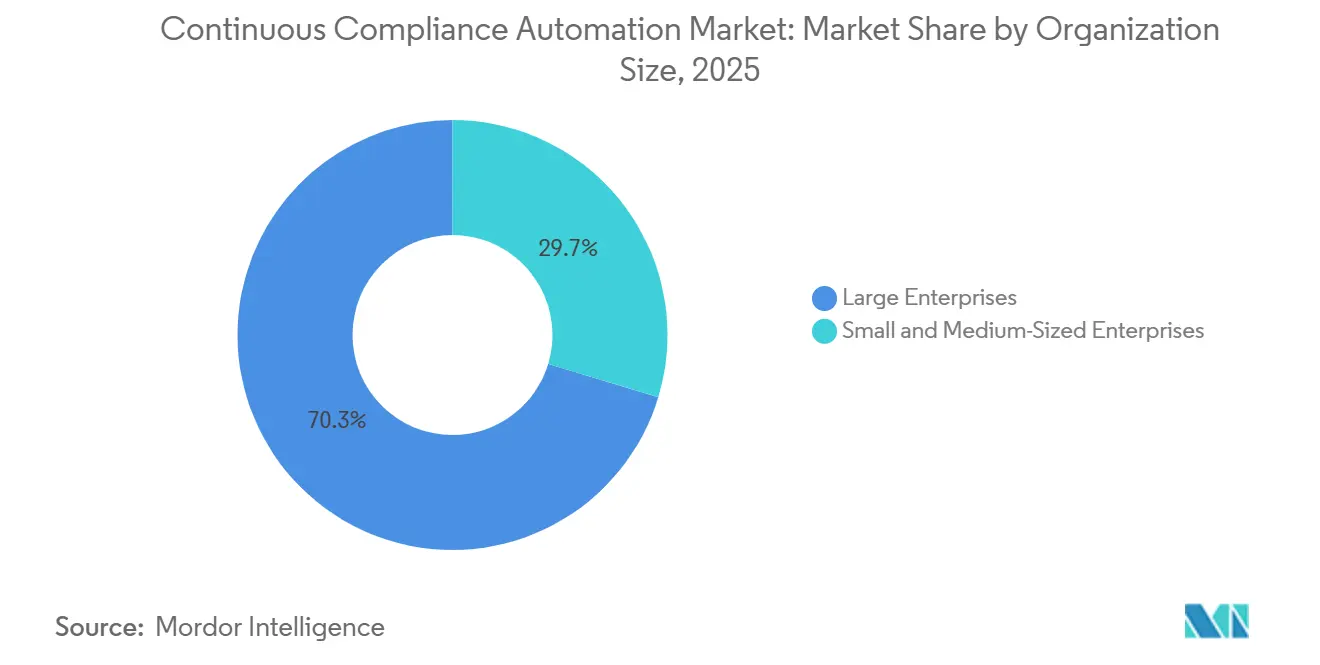
Large enterprises commanded 70.32% of category revenue in 2025. Their scale exposes them to multiple requirements across financial reporting, privacy, cybersecurity, and third-party risk. A large financial institution may need to manage Basel III, DORA, SOX, GDPR, and ESG disclosure requirements simultaneously. Separate tools for every obligation can create duplicate evidence requests and coordination burdens. Centralized platforms can preserve a common evidence base and propagate updates across mapped frameworks. This addresses an operational issue for larger organizations, not simply a reporting preference. Existing IT, identity, and vendor-risk relationships also make enterprise platform adoption easier. These conditions kept large organizations as the main revenue base.
SMEs are projected to expand at a 32.89% CAGR through 2031. Enterprise buyers increasingly ask suppliers to show compliance certification during procurement and vendor onboarding. The OECD reported in 2026 that AI adoption among surveyed SMEs was increasing, with efficiency as a primary motivation alongside persistent skills gaps. Cloud-based modular software and subscription pricing can make formal compliance programs more accessible to smaller businesses. This can reduce the need for dedicated internal compliance headcount during initial certification. SMEs still need help with skills, framework interpretation, and customer-specific questionnaires. Vendors that combine automated evidence collection with practical implementation support can address these needs. The segment's expansion is therefore closely linked to supply-chain assurance requirements set by larger customers.
By End-User Industry: BFSI Anchors Demand While Healthcare Changes Its Compliance Architecture
BFSI held 32.12% of category revenue in 2025. Financial institutions face a dense set of operational resilience, privacy, anti-money laundering, and payment security requirements. DORA requires financial entities to manage ICT risk, including third-party dependencies and resilience testing. Banks and insurers also manage obligations associated with AML, KYC, MiCA, NIS2, GDPR, and PCI DSS. A unified platform can reuse control evidence without reducing the rigor of individual attestations. This is valuable where compliance teams must respond to many internal and external assurance requests. IT and telecommunications, manufacturing, retail and e-commerce, energy and utilities, and aerospace and defense also require sector-specific controls. NIS2 and CMMC 2.0 extend such requirements across critical infrastructure and defense supply chains.
Healthcare and life sciences are projected to expand at a 31.66% CAGR through 2031. The Continuous Compliance Automation Market is relevant to this segment because traditional data and quality controls are converging with AI governance needs. AI-enabled clinical and diagnostic systems add governance work to existing compliance programs. These places added importance to evidence that is current and auditable. Hospital systems can therefore manage requirements related to clinical research, privacy, claims, and medical technology simultaneously. Continuous audit trails and locked evidence records are closely aligned with the capabilities of compliance automation platforms. This alignment makes healthcare and life sciences a prominent area of future demand. The opportunity depends on platforms that can translate technical evidence into controls accepted by healthcare compliance teams.
Geography Analysis
North America held 37.49% of the Continuous Compliance Automation Market share in 2025. Dense regulatory enforcement and a large base of cloud-native software companies supported the region's leading position. SEC rules require registrants to disclose material cybersecurity incidents within 4 business days, while CMMC 2.0 extends cybersecurity assessment requirements across the US Department of Defense supply chain.[3] These obligations add demand for current evidence in sectors that previously relied more heavily on periodic reviews. The United States remained the main source of regional revenue, while Canada contributed through evolving privacy requirements and alignment with US assurance expectations.
Europe is the second-largest geography in the Continuous Compliance Automation Market. DORA, NIS2, GDPR enforcement, and the EU AI Act create overlapping reasons for organizations to improve how they collect and retain evidence of control. The United Kingdom, Germany, and France are major country markets, while South America and Africa remain early-stage demand areas. Brazil's data-protection framework and South Africa's privacy requirements are creating a foundation for more formal enterprise compliance programs.
Asia-Pacific is projected to expand at a 31.90% CAGR through 2031. Financial services digitization, stronger enforcement, and cloud-native fintech growth support demand across India, China, Japan, and Singapore. The Continuous Compliance Automation Market size in the region is shaped by requirements that differ across MAS TRM, APRA CPS 234, FSA FISC guidance, and RBI expectations. Platforms need local framework mapping and jurisdiction-specific reporting, which raises the engineering requirement for vendors entering the region. UAE and Saudi Arabia are extending cybersecurity mandates through national frameworks, creating additional demand among critical-sector operators in the Middle East.
Competitive Landscape
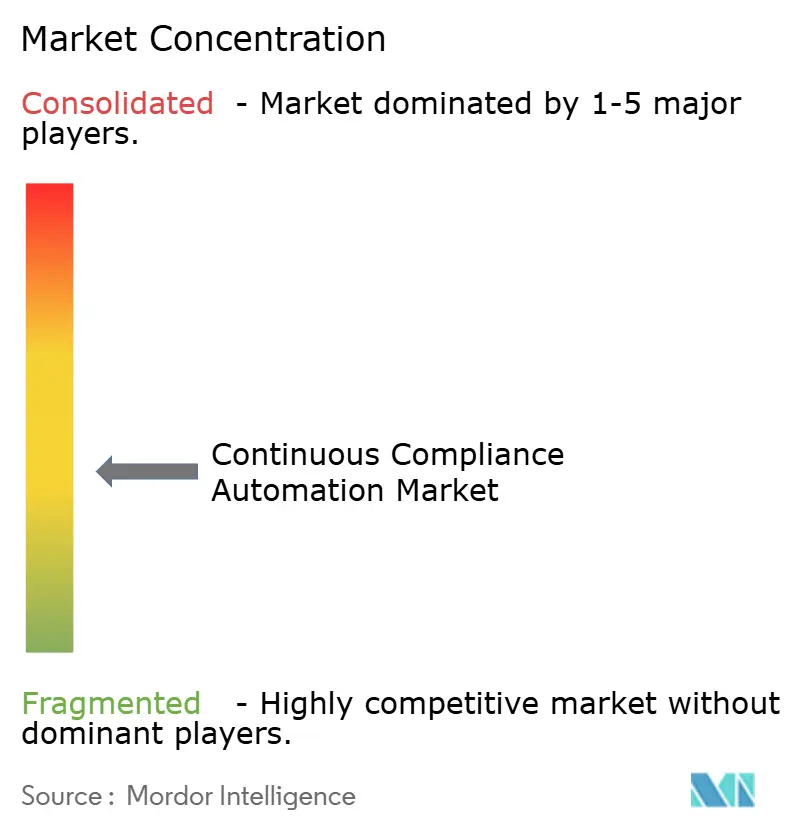
The Continuous Compliance Automation Market remains moderately fragmented. Specialist platforms, including Vanta, Drata, Secureframe, and Sprinto, compete with GRC providers such as ServiceNow and OneTrust. Specialists emphasize integration coverage, automated evidence, and time to certification, while larger providers build on existing customer relationships in identity, privacy, vendor risk, and enterprise workflows. Product breadth and integration depth are likely to influence vendor choice more than a single framework capability.
Rapid7 made Cyber GRC generally available in July 2026, linking GRC workflows with live security telemetry and assurance partners for programs including SOC 2, ISO 27001, HITRUST, CMMC, and FedRAMP. Drata launched AI Agent Governance in August 2026 to help enterprises discover, monitor, govern, and record evidence for AI agents.[4] OneTrust introduced CORIE in September 2026 to enforce enterprise policies in real time as AI agents operate across systems. These moves shift the category from infrastructure compliance toward governance of autonomous AI activity. Vendors are adding AI inventories, policy enforcement, and tamper-evident logs to established control-evidence capabilities.
The Continuous Compliance Automation Market is placing pressure on narrowly focused point solutions. Leading platforms are combining evidence automation with vendor risk, privacy, and AI governance functions. Secureframe built an early position through ISO 42001, NIST AI RMF, and EU AI Act framework coverage. Buyers may prefer fewer platforms when one controls evidence-based support for security, privacy, and AI governance requirements. Competition through 2031 will depend on whether providers can combine broad coverage with trusted, auditor-ready evidence.
Continuous Compliance Automation Industry Leaders
-
Vanta, Inc.
-
Drata, Inc.
-
Secureframe, Inc.
-
Sprinto Technology Private Limited
-
Hyperproof, Inc.
- *Disclaimer: Major Players sorted in no particular order
Recent Industry Developments
- September 2026: OneTrust unveiled its platform evolution at TrustWeek 2026, introducing CORIE, Contextual Orchestration for Reasoning, Intelligence, and Evidence, a shared intelligence layer that enforces enterprise policies in real time as AI agents work across systems. CORIE draws on a decade of accumulated regulatory data to determine permitted actions, enforce decisions, and capture tamper-evident evidence of what occurred, making OneTrust the first major governance platform to offer inline AI agent policy enforcement at scale.
- September 2026: Drata launched its Third-Party Risk Management product as an independent solution built around an agentic assessment engine, replacing static point-in-time vendor scoring with continuous, evidence-backed risk decisions. This marked Drata's expansion beyond its compliance automation core, extending its platform, used by more than 8,500 organizations worldwide, into standalone vendor risk management.
- August 2026: Drata launched AI Agent Governance in limited availability, enabling enterprises to discover, monitor, govern, and produce tamper-evident traceability for AI agents operating inside their organizations. The product shipped with Anthropic integration and provides immediate inventory visibility, along with board-ready, auditor-ready evidence logging within minutes of connection.
- July 2026: Rapid7 announced the general availability of Rapid7 Cyber GRC, becoming the first major security operations platform to connect live GRC workflows with security telemetry data. The release integrates with assurance partners, including HITRUST, Insight Assurance, and 360 Advanced, for certification programs across SOC 2, ISO 27001, HITRUST, CMMC, and FedRAMP.
Global Continuous Compliance Automation Market Report Scope
The Continuous Compliance Automation Market comprises software solutions and associated services that enable organizations to continuously monitor, assess, manage, and maintain compliance with regulatory, cybersecurity, privacy, risk management, and industry-specific standards through automated controls, evidence collection, policy management, risk monitoring, and audit readiness processes. These platforms help organizations automate compliance workflows across frameworks such as ISO 27001, SOC 2, PCI DSS, HIPAA, GDPR, NIST, and other regulatory requirements while providing real-time visibility into compliance posture and control effectiveness.
The Continuous Compliance Automation Market Report is Segmented by Component (Software, and Services), Deployment (Cloud, On-Premises, and Hybrid), Organization Size (Large Enterprises, and Small and Medium-Sized Enterprises), End-User Industry (Banking, Financial Services, and Insurance [BFSI], IT and Telecommunication, Healthcare and Life Sciences, Industrial Manufacturing, Retail and E-Commerce, Energy and Utilities, Aerospace and Defense, and Other End-User Industries), and Geography (North America, South America, Europe, Asia-Pacific, Middle East, and Africa). The Market Forecasts are Provided in Terms of Value (USD).
| Software |
| Services |
| Cloud |
| On-Premises |
| Hybrid |
| Large Enterprises |
| Small and Medium-Sized Enterprises |
| Banking, Financial Services, and Insurance (BFSI) |
| IT and Telecommunication |
| Healthcare and Life Sciences |
| Industrial Manufacturing |
| Retail and E-Commerce |
| Energy and Utilities |
| Aerospace and Defense |
| Other End User Industries |
| North America | United States |
| Canada | |
| South America | Brazil |
| Argentina | |
| Mexico | |
| Rest of South America | |
| Europe | United Kingdom |
| Germany | |
| France | |
| Italy | |
| Spain | |
| Rest of Europe | |
| Asia-Pacific | China |
| Japan | |
| India | |
| South Korea | |
| Australia | |
| Singapore | |
| Rest of Asia-Pacific | |
| Middle East | United Arab Emirates |
| Saudi Arabia | |
| Turkey | |
| Israel | |
| Rest of Middle East | |
| Africa | South Africa |
| Nigeria | |
| Egypt | |
| Rest of Africa |
| By Component | Software | |
| Services | ||
| By Deployment | Cloud | |
| On-Premises | ||
| Hybrid | ||
| By Organization Size | Large Enterprises | |
| Small and Medium-Sized Enterprises | ||
| By End-User Industry | Banking, Financial Services, and Insurance (BFSI) | |
| IT and Telecommunication | ||
| Healthcare and Life Sciences | ||
| Industrial Manufacturing | ||
| Retail and E-Commerce | ||
| Energy and Utilities | ||
| Aerospace and Defense | ||
| Other End User Industries | ||
| By Geography | North America | United States |
| Canada | ||
| South America | Brazil | |
| Argentina | ||
| Mexico | ||
| Rest of South America | ||
| Europe | United Kingdom | |
| Germany | ||
| France | ||
| Italy | ||
| Spain | ||
| Rest of Europe | ||
| Asia-Pacific | China | |
| Japan | ||
| India | ||
| South Korea | ||
| Australia | ||
| Singapore | ||
| Rest of Asia-Pacific | ||
| Middle East | United Arab Emirates | |
| Saudi Arabia | ||
| Turkey | ||
| Israel | ||
| Rest of Middle East | ||
| Africa | South Africa | |
| Nigeria | ||
| Egypt | ||
| Rest of Africa | ||
Key Questions Answered in the Report
What is the size of the Continuous Compliance Automation Market?
The market was valued at USD 0.62 billion in 2025 and is estimated at USD 0.80 billion in 2026. It is forecast to reach USD 3.10 billion by 2031 at a 31.20% CAGR.
What is driving demand for continuous compliance automation?
Overlapping requirements such as DORA, PCI DSS v4.0, cybersecurity disclosure rules, and customer assurance requests are driving demand for ongoing evidence collection and control monitoring.
Which component led revenue in 2025?
Software led with a 68.29% share in 2025 because it provides integration connectors, control libraries, automated testing, and dashboard capabilities.
Which deployment model is growing fastest?
Hybrid deployment is projected to grow at a 32.28% CAGR through 2031 as regulated organizations operate across cloud, on-premises, and legacy environments.
Which end-user sector offers the fastest future growth?
Healthcare and life sciences are projected to grow at a 31.66% CAGR through 2031 as AI governance, clinical technology, privacy, and audit-trail requirements converge.
Which region is expected to grow fastest?
Asia-Pacific is projected to grow at a 31.90% CAGR through 2031, supported by financial-services digitization, cloud adoption, and country-specific regulatory requirements.