
Compressed Natural Gas Market Size and Share
Market Overview
| Study Period | 2022 - 2032 |
|---|---|
| Market Size (2027) | USD 252.75 Billion |
| Market Size (2032) | USD 431.34 Billion |
| Growth Rate (2027 - 2032) | 11.28 % |
| Fastest Growing Market | Asia-Pacific |
| Largest Market | North America |
| Market Concentration | Medium |
Major Players *Disclaimer: Major Players sorted in no particular order Image © Mordor Intelligence. Reuse requires attribution under CC BY 4.0. | |
Compressed Natural Gas Market Analysis by Mordor Intelligence
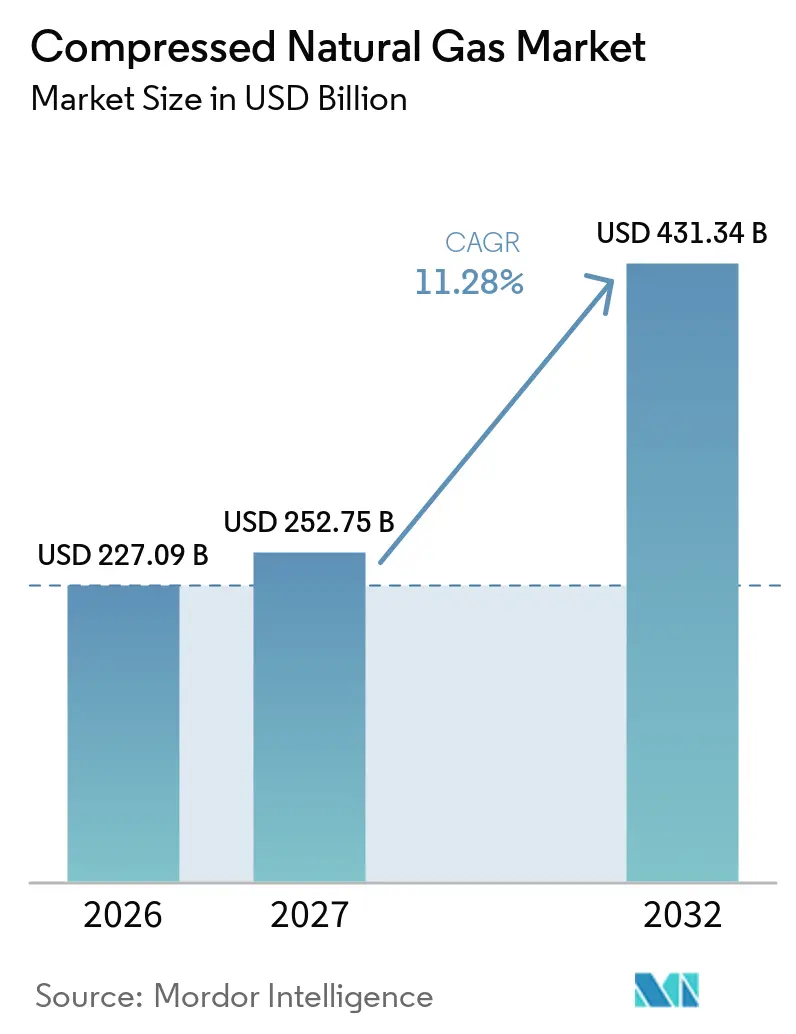
The Compressed Natural Gas Market size is expected to increase from USD 227.09 billion in 2026 to USD 252.75 billion in 2027 and reach USD 431.34 billion by 2032, growing at a CAGR of 11.28% over 2027-2032. Growth is supported by transport-emission rules, lower fuel costs than diesel for high-mileage fleets, and wider gas distribution networks in emerging economies. Associated gas remains important because oil-producing regions can use existing field infrastructure to supply competitively priced vehicle fuel. Renewable natural gas is widening the role of existing CNG assets because it can move through the same distribution and refueling equipment. The compressed natural gas market also faces pressure from battery-electric trucks, especially in urban freight, while long-haul and heavy-load operations retain operational reasons to use CNG.
Key Report Takeaways
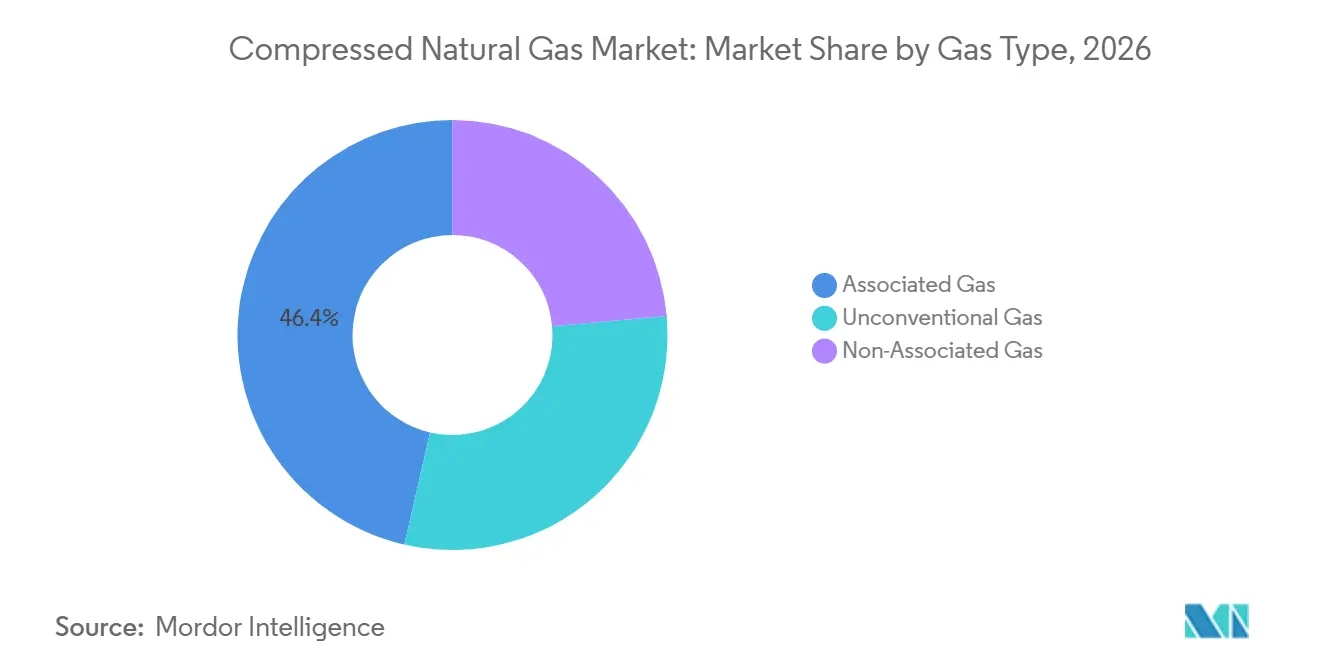
- By gas type, associated gas held 46.4% of the compressed natural gas market share in 2026, while unconventional gas is forecast to expand at an 11.7% CAGR through 2032.
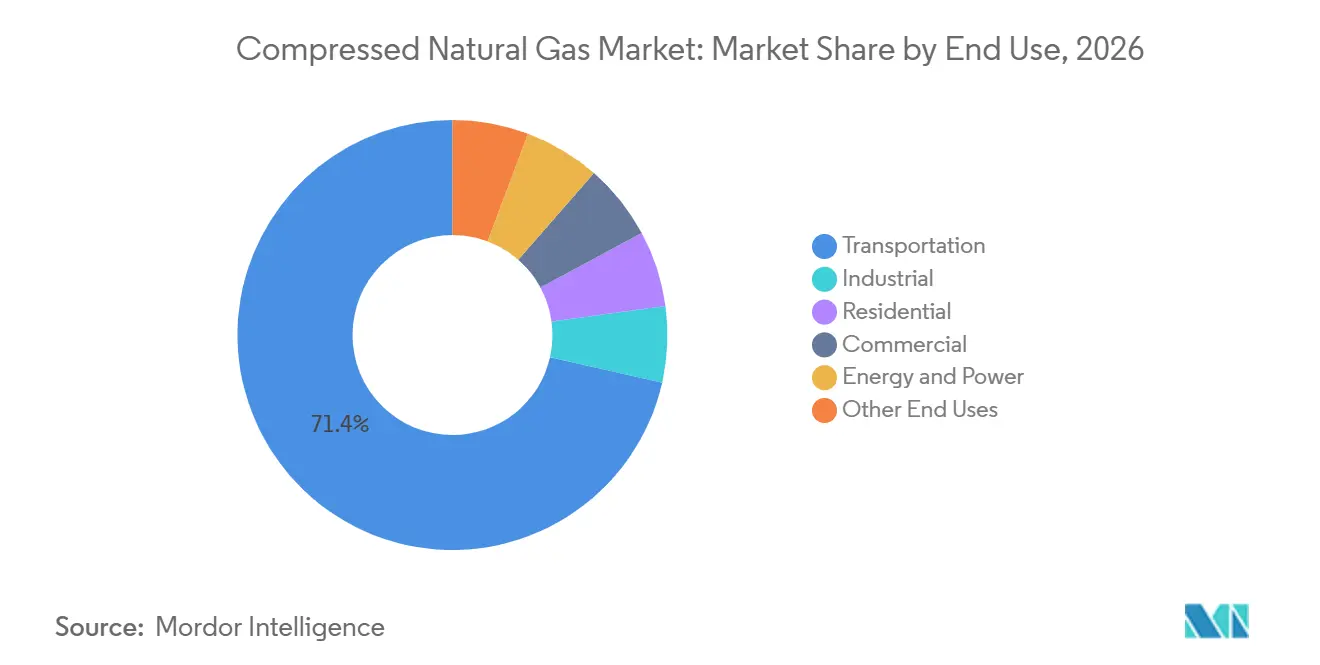
- By end use, transportation accounted for 71.3% of the compressed natural gas market share in 2026, while energy and power recorded the highest projected CAGR at 11.9% through 2032.
- By geography, North America held 28.5% revenue share in 2026, while Asia-Pacific is forecast to expand at an 11.6% CAGR through 2032.
Note: Market numbers in this report are based on Mordor Intelligence's proprietary estimation framework, which combines nine months of actuals with Q4 projections for base year 2026.
Market Trends and Insights
Drivers Impact Analysis of Compressed Natural Gas Market*
| Driver | (~) % Impact on CAGR Forecast | Geographic Relevance | Impact Timeline |
|---|---|---|---|
| Fleet Decarbonization and Air-Quality Requirements | +2.2% | Global, with concentration in North America and Europe, and spillover to India and Southeast Asia | Short term (≤ 2 years) |
| CNG Cost Advantage Against Diesel and Gasoline | +2.0% | Asia-Pacific, South America, and Middle East and Africa | Medium term (2-4 years) |
| City-Gas Networks and Refueling Corridor Expansion | +1.8% | India, China, Nigeria, Asia-Pacific, and Middle East and Africa | Medium term (2-4 years) |
| Bio-CNG and Renewable Natural Gas Asset Compatibility | +1.5% | North America and Europe, with early progress in Australia and Japan | Long term (≥ 4 years) |
| Digital, Modular, and Mobile Refueling for Off-Grid Fleets | +0.9% | North America, Sub-Saharan Africa, and remote Asia-Pacific | Medium term (2-4 years) |
| Natural Gas Vehicle OEM Availability and Engine Efficiency | +1.2% | North America, Asia-Pacific, and Europe | Medium term (2-4 years) |
| Source: Mordor Intelligence | |||
Fleet Decarbonization and Urban Air-Quality Mandates
Transport-emission rules are accelerating fleet interest in the compressed natural gas market where electric alternatives still have limits on range or charging access. California commercial fleets using bio-CNG reported an average carbon intensity of -194.13 gCO2e/MJ under the Low Carbon Fuel Standard. India directed the expansion of city-gas distribution across mainland geographical areas and set a target of 18,336 CNG stations by 2034.[1] The program had commissioned 8,067 stations by March 2025, against a pro-rata target of 4,877 stations. The Massachusetts Bay Transportation Authority (MBTA) joined the U.S. Renewable Fuel Standard program in September 2025, pairing 175 CNG buses with renewable natural gas under a 5-year contract that generates USD 800,000 annually.[2] Such programs turn fleet fuel choices from voluntary purchasing decisions into compliance-related capital decisions.
CNG Fuel-Cost Advantage Versus Diesel and Gasoline
The fuel-cost difference between CNG and diesel remains a primary source of demand in the compressed natural gas market, although the size of that difference varies by region. India introduced a tariff reform effective in January 2026 that reduced CNG retail prices by up to INR 4 per kg in several geographies through a uniform Zone-1 tariff of INR 54 per million British thermal units (MMBtu). China reported LNG vehicle fuel consumption of 20.27 million tons in January through September 2025, up 22% year on year as logistics operators responded to the diesel-to-gas spread. Argentina’s CNG price advantage over premium gasoline narrowed after fuel deregulation, which makes conversion less attractive for private-car owners but leaves the commercial case more durable. Global gas consumption is projected to reach a new high in 2026, with demand growth accelerating to 2% as additional LNG supply eases price pressure.[3] Import-dependent markets in South and Southeast Asia will remain exposed to LNG pricing because retail CNG prices are more closely linked to spot supply than domestic field costs.
Expansion of City-Gas Distribution and Refueling Corridors
Physical refueling coverage is a central requirement for the compressed natural gas market, particularly where new fleet demand has outpaced station availability. India had reached 165% of its pro-rata station target by March 2025, and Indraprastha Gas Limited (IGL) operated 954 stations after adding 72 in fiscal year 2024-25. Those stations served more than 2.1 million CNG vehicles in the Delhi-NCR area. Adani Total Gas completed fiscal year 2026 with 705 CNG stations and gas volumes of 1,133 Million Metric Standard Cubic Meters (MMSCM), an increase of 14% from the preceding year. Nigeria’s MDGIF and Endurance Group agreed in November 2025 to develop 500 integrated CNG refueling stations by 2028, along with a virtual pipeline. Distributors that obtain geographic licenses and build dense local networks can make later entry harder, especially where concessions are granted to authorized operators.
Bio-CNG and Renewable Natural Gas Compatibility with Existing Assets
Biomethane can enter CNG supply chains without changes to vehicles, compressors, or conventional refueling equipment. This enables the compressed natural gas market to use landfill gas, dairy waste, and agricultural residues while maintaining installed assets. The European Investment Bank and Snam signed a EUR 264 million financing agreement in July 2025 for 240 km of dedicated biomethane pipelines in Italy, including an initial EUR 140 million tranche.[4] The project supports annual biomethane transport capacity of up to 12,000 GWh and Italy’s 2030 production target of 5 billion cubic meters (bcm). Clean Energy Fuels sold 61.3 million gallons of Renewable Natural Gas (RNG) in the third quarter of 2025 and began work on 3 dairy-based production facilities with Maas Energy Works that are expected to produce 3 million gallons annually. For carriers with access to organic-waste feedstock, this compatibility can support lower lifecycle emissions without retiring operating vehicles or refueling systems.
Restraints Impact Analysis of Compressed Natural Gas Market*
| Restraint | (~) % Impact on CAGR Forecast | Geographic Relevance | Impact Timeline |
|---|---|---|---|
| High Vehicle, Station, and Storage Costs | -1.5% | Global, with higher pressure in emerging markets and off-grid regions | Long term (≥ 4 years) |
| Competition From Battery-Electric and Hydrogen Powertrains | -1.8% | North America, Europe, and China | Long term (≥ 4 years) |
| Sparse Refueling Coverage and Uneven Maintenance Ecosystems | -0.9% | Middle East and Africa, South America, and emerging Asia-Pacific | Medium term (2-4 years) |
| Methane Leakage and Lifecycle-Emissions Scrutiny | -0.8% | Global, with regulatory focus in Europe and North America | Medium term (2-4 years) |
| Source: Mordor Intelligence | |||
High Upfront Cost of Vehicles, Stations, and High-Pressure Storage
The capital intensity of the compressed natural gas market presents a barrier for small and medium fleet operators in price-sensitive markets. Purpose-built CNG trucks carry a purchase premium over diesel models, while Type III and Type IV high-pressure cylinders add cost and weight. High-throughput stations also require compressors, storage, and dispensing equipment before a fleet can reliably refuel. These combined costs weaken the case for operators with short vehicle ownership periods or limited financing access. Clean Energy Fuels invested in Pioneer Clean Fleet Solutions during 2025 to provide leasing options for fleets adopting the Cummins X15N, separating part of the capital burden from day-to-day operating benefits. In markets where subsidies fund stations but not vehicle purchases, independent owner-operators remain less able to convert their fleets.
Competition from Battery-Electric and Hydrogen Powertrains
Battery-electric trucks are creating a material substitution risk for CNG in urban and regional freight operations. The compressed natural gas market therefore faces its greatest electric substitution risk in duty cycles with predictable routes and accessible charging. Hydrogen remains a less immediate competitor in current heavy-duty vehicle deployment. Research published in 2025 indicates that battery-electric trucks could reach total-cost-of-ownership parity with diesel in Europe and the United States before 2030. CNG retains a stronger operating position in long-haul, heavy-load duty cycles because the Cummins X15N offers more than 1,000 km of range, 1,850 lb-ft of torque, and 10% better fuel efficiency than its predecessor. The compressed natural gas market must therefore defend applications where quick refueling and high payload requirements remain important.
*Our forecasts treat driver/restraint impacts as directional, not additive. The impact forecasts reflect baseline growth, mix effects, and variable interactions.
Compressed Natural Gas Market Segment Analysis
By Gas Type:
Associated Gas Leads While Unconventional Supply ExpandsAssociated gas held 46.4% of global revenue in 2026, reflecting the presence of low-cost gas and field compression infrastructure in oil-producing regions. Associated gas supports the compressed natural gas market in the Gulf Cooperation Council, Russia, and Latin America because it can be captured alongside crude oil production. Its use can lower incremental feedstock costs where collection and processing systems are already available. Non-associated gas from dedicated reservoirs supports city-gas systems in Europe, North America, and mature Asian economies. These systems need consistent gas quality and reliable supply for vehicle-grade fuel.
Unconventional gas is projected to grow at an 11.7% CAGR through 2032, making it the fastest-growing supply type in the compressed natural gas market. Shale gas, coalbed methane, and tight gas are opening new feedstock routes in the United States, China, and Argentina as drilling and fracturing costs decline. Global gas demand is expected to increase by 9% by 2030, with Asia-Pacific accounting for nearly half of the net gain. TotalEnergies, YPFB, and Matrix Energia completed the first pipeline export of Vaca Muerta shale gas from Argentina to Brazil in April 2025, creating a regional supply corridor with implications for vehicle-fuel availability.

By End Use:
Transportation Leads While Energy and Power Grow FasterTransportation accounted for 71.3% of the compressed natural gas market share in 2026, supported by fleet use in transit buses, refuse hauling, and heavy-duty freight. The segment has a large installed base because these applications can refuel at centralized depots and follow regular routes. Daimler Truck North America began production of the Freightliner Cascadia equipped with the Cummins X15N in summer 2025, adding a purpose-built 15-liter natural gas engine to the heavy-truck offer. Hexagon Agility received an order for 100 CNG fuel systems from Trayecto in Mexico, with a stated range above 1,000 km per fill.
Energy and power is forecast to expand at an 11.9% CAGR through 2032 as data centers, off-grid industrial sites, and grid-peaking operations seek portable gas supply within the compressed natural gas market. Certarus received a September 2025 contract to provide CNG for 50 MW of on-site power at a U.S. hyperscale data center, using portable compression and decompression equipment. This model allows customers to access fuel before permanent pipeline connections are completed. The power sector is expected to contribute more than one-third of global natural gas demand growth through 2030, with Asia-Pacific providing more than half of that increase. Residential, commercial, and industrial uses continue to provide stable demand within existing city-gas networks, particularly where natural gas remains competitive with liquefied petroleum gas (LPG) and electricity.
Geography Analysis
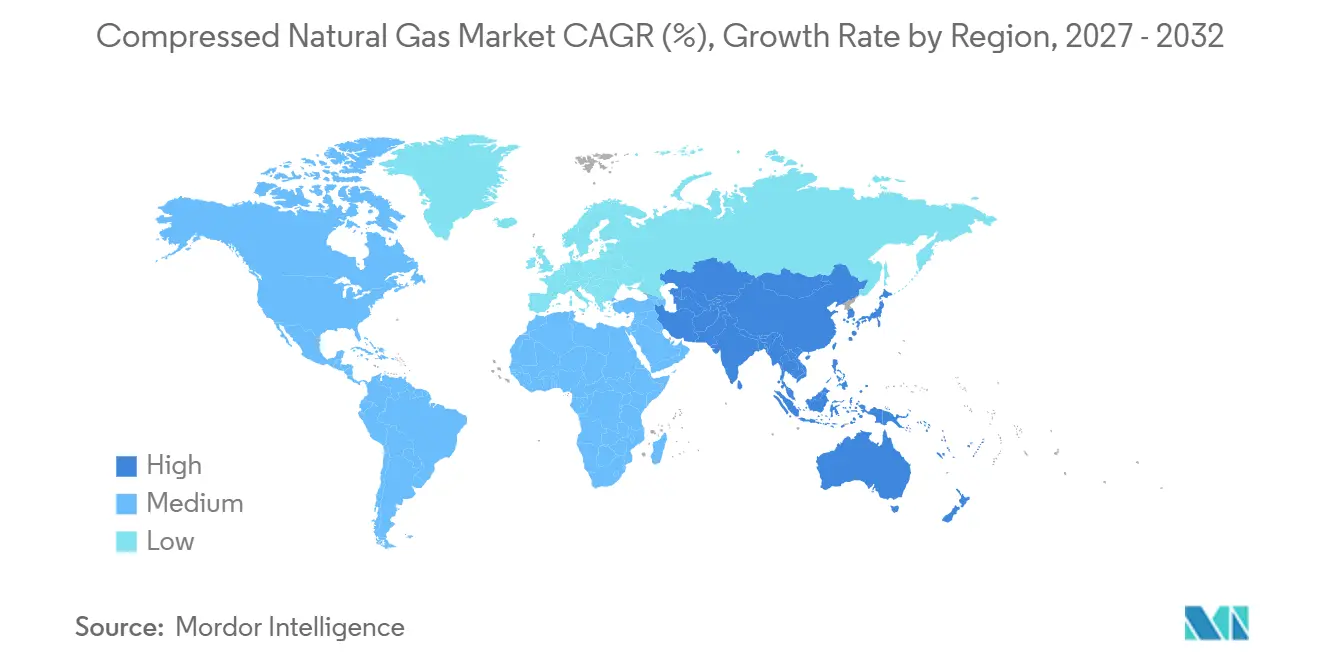
North America Compressed Natural Gas Market
North America held 28.5% of global revenue in 2026, supported by established refueling networks, renewable gas supply, and state-level low-carbon fuel policies. Clean Energy Fuels reported revenue of USD 312.5 million for the first 9 months of 2025 and sold 219.5 million gasoline gallon equivalents, including 173.2 million gallons of RNG. The scale of RNG sales shows that the compressed natural gas market in the region is moving toward renewable feedstock.
APAC Compressed Natural Gas Market
Asia-Pacific is projected to record an 11.6% CAGR through 2032, the fastest regional rate in the compressed natural gas market. India’s station rollout exceeded the pro-rata target by 65% as of March 2025, while Adani Total Gas expanded to 705 stations by the end of fiscal year 2026. IGL reported fiscal year 2025 profit after tax of INR 1,468 crore after expanding its local infrastructure. Vietnam, Thailand, and Indonesia have greenfield potential as city-gas networks mature, although subsidies favoring LPG can limit short-term CNG adoption.
EMEA and South America Compressed Natural Gas Market
Europe is focused more on bio-CNG conversion than on new fossil-CNG volumes, led by Italy’s biomethane network investment. European gas demand increased by nearly 5% year on year in the first 3 quarters of 2025 as low wind generation and cold weather increased power-sector consumption. South America remains anchored by Brazil’s CNG vehicle base of more than 2 million vehicles and growing gas supply from the Santos Basin. Argentina’s Vaca Muerta output rose 5% in January through August 2025, and cross-border exports to Brazil could improve feedstock availability in major logistics corridors. Saudi oil-to-gas switching is expected to add more than 50 bcm of annual gas demand between 2024 and 2030. Nigeria’s plan for 500 stations by 2028 is a major infrastructure commitment for Sub-Saharan Africa and addresses refueling gaps with a virtual pipeline.
Competitive Landscape
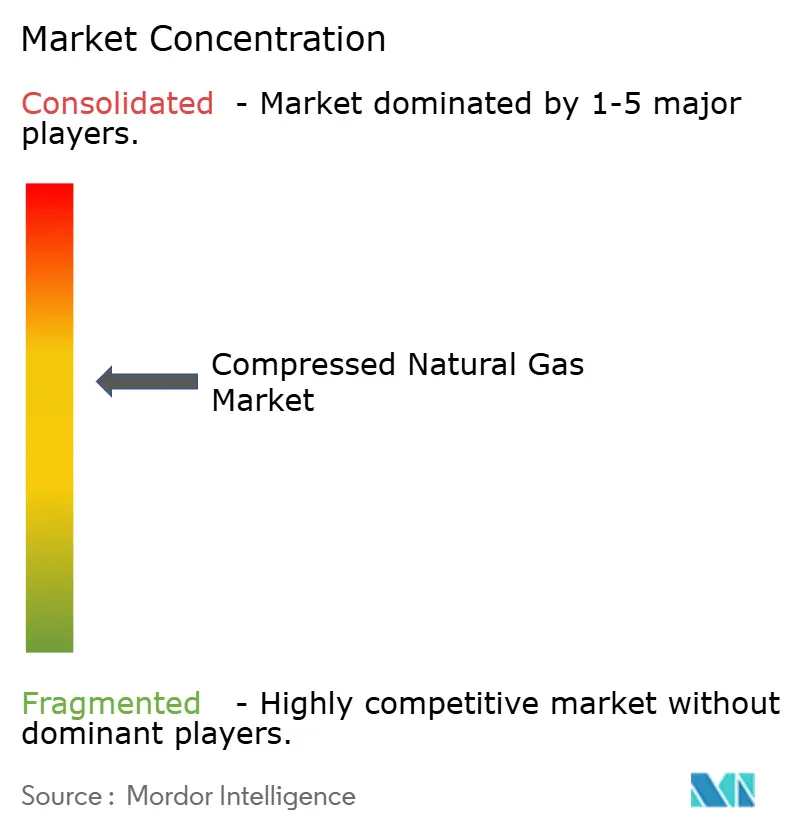
The compressed natural gas market is moderately consolidated across upstream supply, midstream equipment, and downstream retail. Shell, BP, Chevron, TotalEnergies, Eni, and China National Petroleum Corporation (CNPC) have important upstream positions but participate less directly in retail fueling. In India, licensed distributors can build dense regional networks that support customer retention and margin protection. IGL reported fiscal year 2025 profit after tax of INR 1,468 crore, demonstrating the economics possible in mature urban corridors.
Clean Energy Fuels, TotalEnergies, and BP have a joint development agreement for dairy-based RNG supply into Clean Energy’s retail network. The arrangement gives upstream companies a route to downstream demand without requiring a direct retail build-out. Equipment suppliers such as Hexagon Composites and Chart Industries remain relevant across both fossil CNG and renewable gas because their cylinders and compression systems serve either feedstock. Daimler Truck North America’s launch of a Freightliner Cascadia with the Cummins X15N shows that OEMs continue to support natural-gas powertrains in selected applications.
Virtual-pipeline providers are competing with fixed infrastructure suppliers and conventional fuel retailers in the compressed natural gas market. Certarus’s 50 MW data-center supply contract shows that portable CNG can serve industrial customers at a larger scale. Chinese companies are increasing patent activity in high-pressure storage safety, energy-use optimization, and exhaust-treatment systems. The strongest strategic opening remains with providers that can combine RNG supply, infrastructure ownership, and fleet financing. Few firms provide all 3 elements at scale, despite their relevance to the upfront-cost challenge.
Compressed Natural Gas Industry Leaders
-
China National Petroleum Corporation (CNPC)
-
PJSC Gazprom
-
Shell plc
-
TotalEnergies SE
-
Exxon Mobil Corporation
- *Disclaimer: Major Players sorted in no particular order
Compressed Natural Gas Market Companies Covered in this Report
- Adani Total Gas Limited
- Bharat Petroleum Corporation Limited (BPCL)
- BP plc
- Chart Industries, Inc.
- Chevron Corporation
- China National Petroleum Corporation (CNPC)
- Clean Energy Fuels Corp.
- ConocoPhillips
- ENGIE SA
- Eni S.p.A.
- Exxon Mobil Corporation
- Gujarat Gas Limited
- Hexagon Composites ASA
- Indraprastha Gas Limited (IGL)
- J-W Power Company
- Mahanagar Gas Limited (MGL)
- PJSC Gazprom
- Shell plc
- TotalEnergies SE
- Trillium Energy Partners LLC
Recent Industry Developments in Compressed Natural Gas Market
- October 2026: Adani Total Gas reported Q1 FY27 results with revenue rising 27% year-on-year, CNG network reaching 707 stations, and PNG connections surpassing 11.41 lakh after adding 38,000+ households in the quarter. Input cost pressures compressed profit by 18%, underscoring the near-term margin sensitivity of city gas distributors to gas procurement price movements.
- April 2026: Adani Total Gas concluded FY26 with 14% volume growth year-on-year to 1,133 MMSCM and EBITDA of INR 1,225 crore, expanding its CNG network to 705 stations and scaling EV charging points to 5,100. The company commissioned 9 additional city gate stations and 1 Liquefied Compressed Natural Gas (LCNG) plant across new geographical areas, reinforcing infrastructure in 11th bidding round licensed territories.
- January 2026: Adani Total Gas reduced CNG and piped gas prices by up to INR 4 per kg across multiple geographies following Petroleum and Natural Gas Regulatory Board’s (PNGRB’s) tariff reform, which unified 3 gas transportation zones into 2 under a Zone-1 tariff of INR 54/MMBtu. The move translates directly into improved CNG affordability for transport operators and strengthens the fuel's cost position versus petrol and diesel.
- November 2025: Nigeria's MDGIF partnered with Endurance Group (China) to build 500 integrated CNG refueling stations across Nigeria by 2028 through a government-backed Special Purpose Vehicle (SPV) involving the Bank of Industry and Séquor Investment Partners. The project encompasses LCNG gas supply infrastructure and a nationwide virtual pipeline, targeting a complete CNG value chain build-out.
Global Compressed Natural Gas Market Report Scope
Compressed Natural Gas (CNG) is a clean-burning fossil fuel produced by compressing natural gas, primarily methane (CH₄), to less than 1% of its volume at standard atmospheric pressure. It is stored in high-pressure cylinders at 200–250 bar (2,900–3,600 psi) and is widely used as an environmentally friendly alternative to petrol, diesel, and LPG in vehicles.
The global compressed natural gas (CNG) market is segmented by gas type, end use, and geography. By gas type, the market is segmented into associated gas, non-associated gas, and unconventional gas. By end use, the market is segmented into transportation, industrial, residential, commercial, energy and power, and other end uses. The report also covers the market size and forecasts for the global compressed natural gas market across 26 countries in key regions. For each segment, the market sizing and forecasts have been provided on the basis of value (USD).
Segmentation Overview
| Associated Gas |
| Non-Associated Gas |
| Unconventional Gas |
| Transportation |
| Industrial |
| Residential |
| Commercial |
| Energy and Power |
| Other End Uses |
| North America | United States |
| Canada | |
| Mexico | |
| Europe | Germany |
| France | |
| Italy | |
| Spain | |
| United Kingdom | |
| Poland | |
| Russia | |
| Rest of Europe | |
| Asia-Pacific | China |
| India | |
| Japan | |
| South Korea | |
| Australia | |
| Indonesia | |
| Vietnam | |
| Thailand | |
| Rest of Asia-Pacific | |
| South America | Brazil |
| Argentina | |
| Chile | |
| Rest of South America | |
| Middle East and Africa | Saudi Arabia |
| United Arab Emirates | |
| Egypt | |
| South Africa | |
| Morocco | |
| Rest of Middle East and Africa |
| By Gas Type | Associated Gas | |
| Non-Associated Gas | ||
| Unconventional Gas | ||
| By End Use | Transportation | |
| Industrial | ||
| Residential | ||
| Commercial | ||
| Energy and Power | ||
| Other End Uses | ||
| By Geography | North America | United States |
| Canada | ||
| Mexico | ||
| Europe | Germany | |
| France | ||
| Italy | ||
| Spain | ||
| United Kingdom | ||
| Poland | ||
| Russia | ||
| Rest of Europe | ||
| Asia-Pacific | China | |
| India | ||
| Japan | ||
| South Korea | ||
| Australia | ||
| Indonesia | ||
| Vietnam | ||
| Thailand | ||
| Rest of Asia-Pacific | ||
| South America | Brazil | |
| Argentina | ||
| Chile | ||
| Rest of South America | ||
| Middle East and Africa | Saudi Arabia | |
| United Arab Emirates | ||
| Egypt | ||
| South Africa | ||
| Morocco | ||
| Rest of Middle East and Africa | ||
Key Questions Answered in the Report
What is the projected value of compressed natural gas by 2032?
The category is forecast to reach USD 431.34 billion by 2032, from USD 227.09 billion in 2026, at an 11.28% CAGR.
Which CNG end use has the largest revenue base?
Transportation leads with 71.3% share in 2026, supported by buses, refuse trucks, and heavy-duty freight fleets.
What is driving CNG adoption in fleet operations?
Fuel-cost savings, emission rules, growing refueling networks, and RNG compatibility support the compressed natural gas market in fleet applications that suit the fuel.
Which region is growing fastest for CNG?
Asia-Pacific is forecast to grow at an 11.6% CAGR through 2032, supported by infrastructure growth in India and demand across Asian logistics fleets.
Why is renewable natural gas important to fleet operators?
RNG can use existing CNG vehicles and refueling equipment, allowing the compressed natural gas market to pursue lower lifecycle emissions from waste-derived fuel sources.
What is the main competitive risk to CNG trucks?
Battery-electric trucks are the main substitution risk in urban and regional freight, while the compressed natural gas market remains more suited to selected long-haul and heavy-load operations.