
Commerce Media Services Market Size and Share
Market Overview
| Study Period | 2020 - 2031 |
|---|---|
| Market Size (2026) | USD 12.34 Billion |
| Market Size (2031) | USD 19.81 Billion |
| Growth Rate (2026 - 2031) | 9.92 % |
| Fastest Growing Market | Middle East |
| Largest Market | North America |
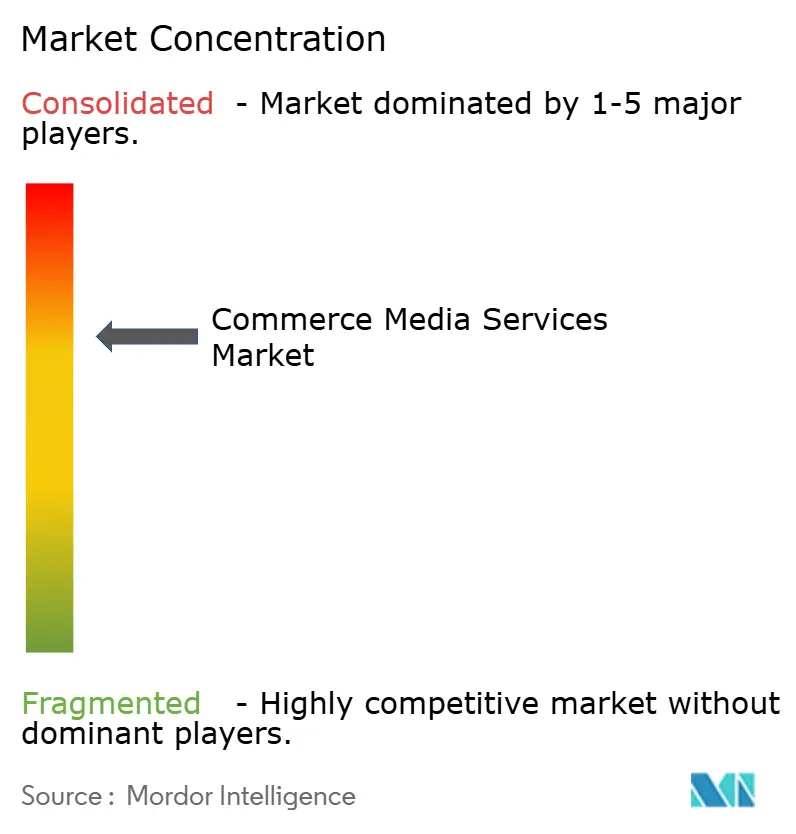
| Market Concentration | Medium |
Major Players *Disclaimer: Major Players sorted in no particular order Image © Mordor Intelligence. Reuse requires attribution under CC BY 4.0. | |
Commerce Media Services Market Analysis by Mordor Intelligence
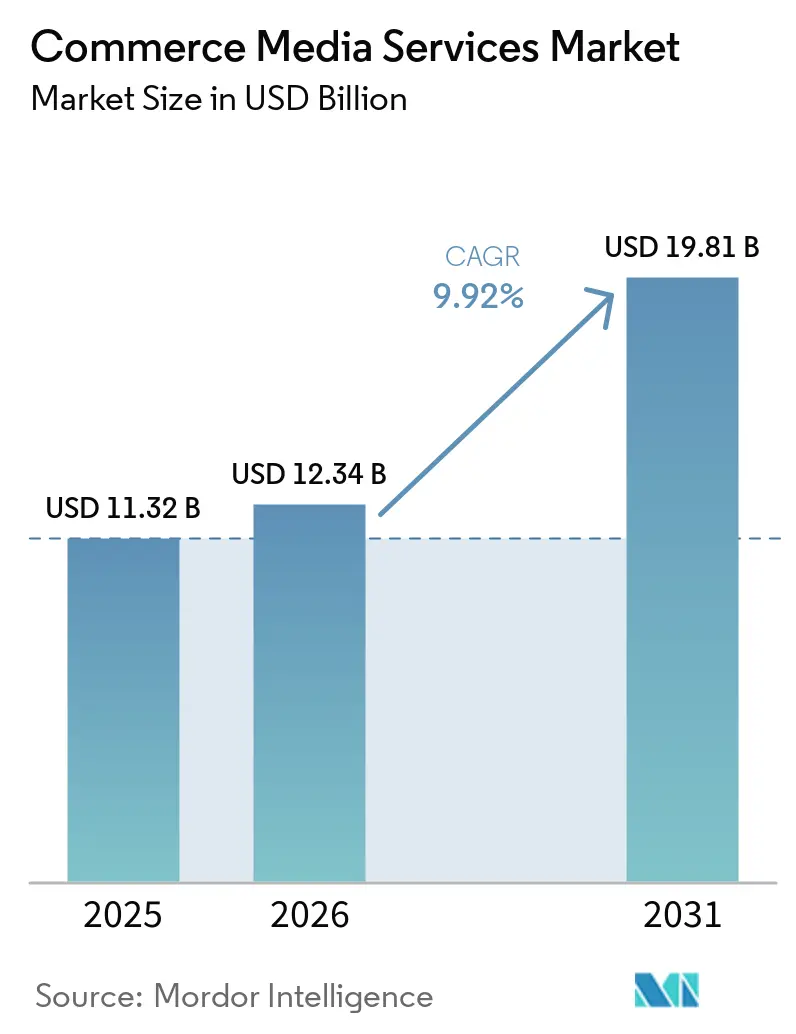
The commerce media services market size is projected to expand from USD 11.32 billion in 2025 and USD 12.34 billion in 2026 to USD 19.81 billion by 2031, registering a CAGR of 9.92% between 2026 to 2031. The loss of third-party identifiers has increased the value of consented purchase and loyalty data, which gives retailers a more direct basis for audience targeting and campaign measurement. This change supports demand for retail and commerce environments that can connect advertising activity with sales outcomes. The commerce media services market is also benefiting from retailer efforts to develop media revenue streams that can support investment in digital stores, loyalty programs, and advertising technology. Advertisers are placing greater weight on incrementality testing because attribution reporting alone does not always show whether advertising generated additional sales. Competitive advantage is therefore shifting toward platforms that combine first-party data, cross-channel inventory, and credible measurement methods.
Key Report Takeaways
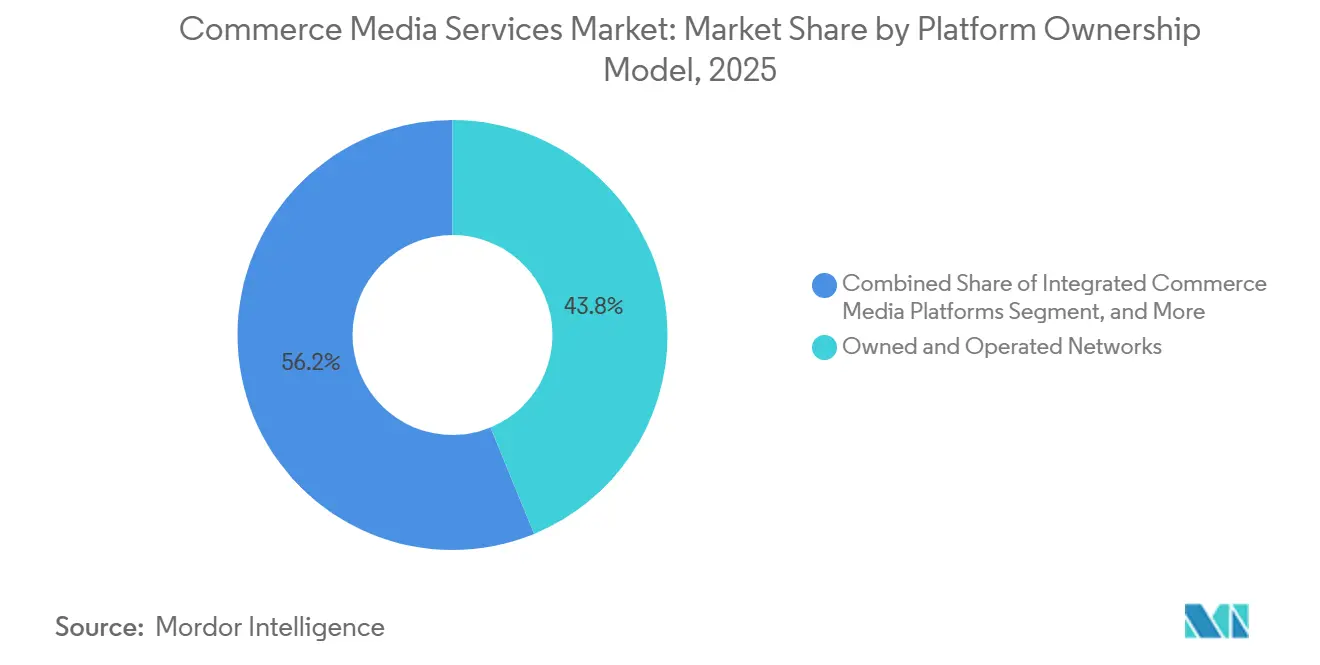
- By platform ownership model, Owned and Operated Networks held 43.80% of the commerce media services market revenue in 2025, while Integrated Commerce Media Platforms are projected to expand at a CAGR of 10.89% through 2031.
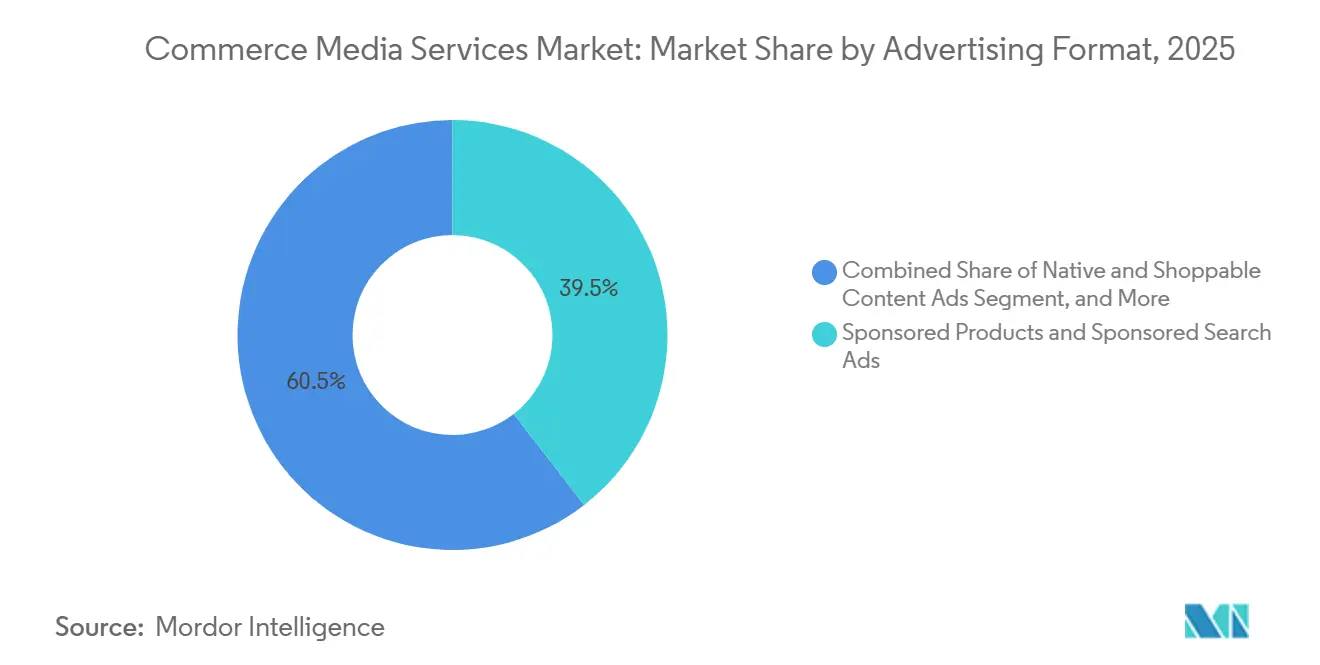
- By advertising format, Sponsored Products and Sponsored Search Ads accounted for 39.50% of the commerce media services market revenue in 2025, while Video Ads, including Connected TV, are projected to expand at a CAGR of 10.94% through 2031.
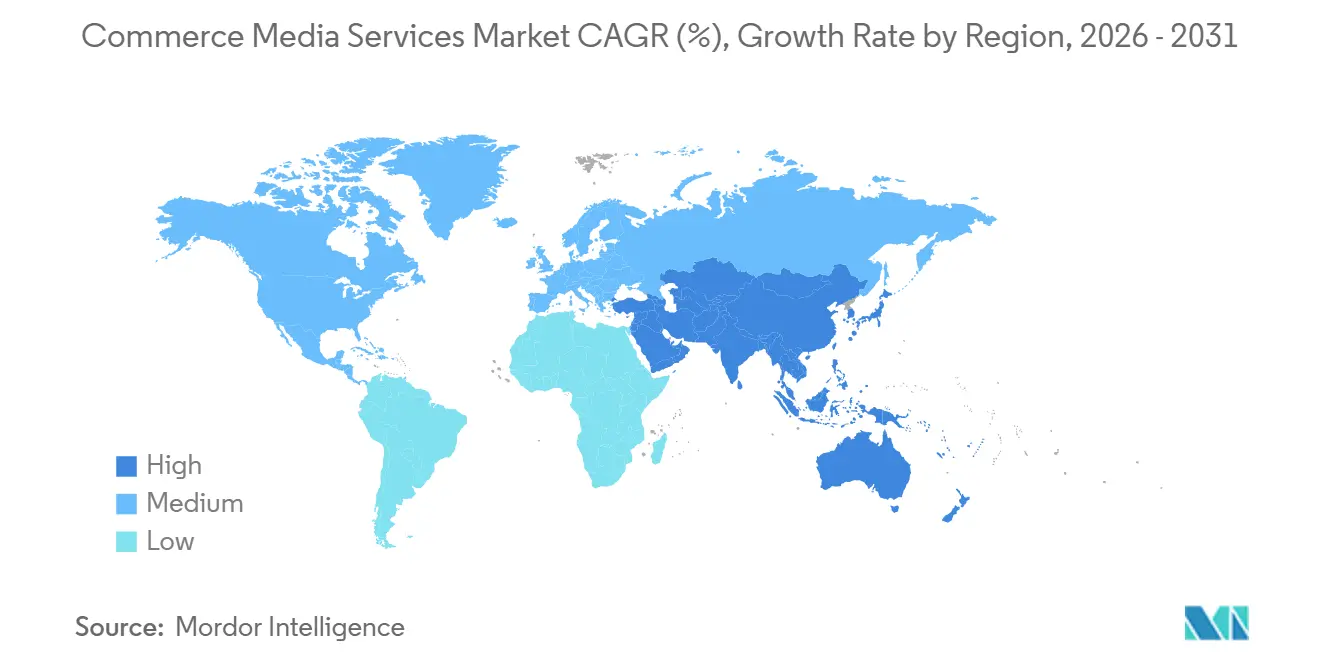
- By geography, North America held 39.00% of global revenue in 2025, while the Middle East is projected to expand at a CAGR of 10.81% through 2031.
Note: Market size and forecast figures in this report are generated using Mordor Intelligence’s proprietary estimation framework, updated with the latest available data and insights as of January 2026.
Market Trends and Insights
Drivers Impact Analysis of Commerce Media Services Market*
| Driver | (~) % Impact on CAGR Forecast | Geographic Relevance | Impact Timeline |
|---|---|---|---|
| First-Party Data Monetization After Third-Party Cookie Loss | +2.8% | Global, with peak intensity in North America and Europe | Short term (≤ 2 years) |
| Margin Expansion From High-Gross-Margin Media Revenue | +2.1% | Global, concentrated in North America and Asia-Pacific | Medium term (2-4 years) |
| Closed-Loop Measurement and Incrementality Proof | +1.7% | North America and Europe, spreading to Asia-Pacific and MENA | Medium term (2-4 years) |
| Offsite and Full-Funnel Expansion Into CTV and Social | +1.4% | North America, Europe, and Asia-Pacific | Medium term (2-4 years) |
| Travel and Hospitality Booking Platforms Entering Commerce Media | +0.8% | North America, Europe, and the Middle East | Long term (≥ 4 years) |
| Clean-Room Collaboration Unlocking Non-Endemic Spend | +0.6% | North America and Europe core, with spillover to Asia-Pacific | Long term (≥ 4 years) |
| Source: Mordor Intelligence | |||
First-Party Data Monetization After Third-Party Cookie Loss
The decline of third-party identifiers has made first-party purchase and loyalty data more important to the commerce media services market. Retailers can use consented transaction signals to support targeting and measurement within their own digital properties. IAB projected 12.1% commerce media growth in 2026 and linked the outlook to the continued development of first-party data ecosystems and repeat purchases.[1] This position gives retailers a data asset that open-web publishers cannot replicate without direct transactional relationships. Smaller retailers can also use category-specific loyalty data in areas such as pharmacy and specialty food, where relevance may matter more than audience scale. The commerce media services market can therefore support narrower networks that offer advertisers a defined customer context and measurable purchase outcomes.
Margin Expansion From High-Gross-Margin Media Revenue
Media income has become a strategic revenue stream for retailers as their core operations face profitability pressure. Walmart reported strong growth in global advertising revenue, while Walmart Connect U.S. revenue also grew significantly. This performance has encouraged retailers to use advertising to fund store digitization, loyalty program development, and data infrastructure. Grocery retailers, which typically operate with lower net margins, have a strong incentive to develop media businesses that leverage customer data and existing digital traffic. This model can strengthen the commerce media services market, as investments in advertising tools also enhance retailers’ ability to sell and measure campaigns. It may also widen the gap between retailers with meaningful digital customer relationships and those that have not yet developed them.
Closed-Loop Measurement and Incrementality Proof
Advertisers increasingly require evidence that campaigns caused sales rather than merely received credit for transactions that would have occurred anyway. IAB and IAB Europe issued guidance for incremental measurement in commerce media in November 2025, covering controlled experiments, synthetic control approaches, and proxy models. The guidance provides a shared reference point for retailers, agencies, and advertisers that need to compare measurement practices. IAB also stated that improved AI-supported measurement could unlock substantial media investment over the near term. Networks that validate incremental sales can better defend their pricing and retain annual advertiser commitments. This trend makes independent testing and transparent reporting central to the commerce media services market, rather than optional reporting features.
Offsite and Full-Funnel Expansion Into CTV and Social
The commerce media services market is extending beyond retailer websites and applications into connected TV, social platforms, display, and audio. IAB projected continued growth in U.S. digital video advertising spending, supported by rising year-over-year demand. The expansion allows retailers to apply their purchase data to media channels where brand campaigns have historically relied on demographic targeting. Offsite retail media spending is expected to increase significantly as advertisers seek inventory beyond crowded onsite search results. This shift broadens the reachable audience while keeping transaction signals available for campaign measurement. The commerce media services market is consequently moving toward a fuller campaign model that combines product discovery, brand awareness, and conversion activity.
Restraints Impact Analysis of Commerce Media Services Market*
| Restraint | (~) % Impact on CAGR Forecast | Geographic Relevance | Impact Timeline |
|---|---|---|---|
| Fragmented Measurement and Reporting Standards | -1.8% | Global, most acute in Europe and across cross-retailer buys | Medium term (2-4 years) |
| Ad Load Saturation and Shopper Experience Erosion | -1.4% | North America and Asia-Pacific, the highest ad-density regions | Short term (≤ 2 years) |
| Sponsored Ranking Transparency and Antitrust Scrutiny | -0.9% | North America and Europe | Long term (≥ 4 years) |
| Catalog and Identity Interoperability Gaps Across Verticals | -0.7% | Global, with acute effects in cross-vertical non-endemic campaigns | Long term (≥ 4 years) |
| Source: Mordor Intelligence | |||
Fragmented Measurement and Reporting Standards
The absence of a common reporting standard remains a material constraint for the commerce media services market. IAB Europe found that many respondents identified a lack of standardization and network fragmentation as significant barriers to retail media growth.[2] Platforms use different return-on-ad-spend definitions, attribution windows, and treatments of view-through activity. These differences make cross-retailer budget decisions more difficult and can increase manual work for advertisers and agencies. IAB Europe’s Commerce Media Measurement Standards and IAB’s Project Eidos offer frameworks for more consistent reporting. Adoption is still uneven, particularly among smaller networks that have limited engineering capacity and operate across multiple jurisdictions.
Ad Load Saturation and Shopper Experience Erosion
Rising sponsored placement density can reduce the usefulness of search and browsing experiences for shoppers. More paid listings can make it harder for shoppers to distinguish advertising from organic product results. As placements become more prominent, relevance and transparent ranking practices become more important to consumer confidence. Retailers face a tradeoff between selling more advertising inventory and preserving confidence in their recommendations. Offsite extensions and loyalty-based placements can provide alternative inventory, but these approaches still need appropriate controls at high-intent purchase moments. Sustainable growth in the commerce media services market depends on managing advertising density as part of the customer experience rather than treating it only as a revenue variable.
*Our forecasts treat driver/restraint impacts as directional, not additive. The impact forecasts reflect baseline growth, mix effects, and variable interactions.
Commerce Media Services Market Segment Analysis
By Platform Ownership Model:
First-Party Scale Anchors Network EconomicsOwned and Operated Networks held 43.80% of commerce media services market share in 2025, supported by their exclusive access to purchase, loyalty, browsing, and in-store behavior data. Their direct relationship with the shopper supports closed-loop measurement that third-party providers cannot reproduce in the same way. This feature helps advertisers connect campaign activity with sales outcomes and evaluate the value of placements. Amazon also stated that Sponsored Products remained its largest advertising offering. Its Ads Agent reduced cost per impression and cost per acquisition compared with an unassisted setup, according to the company. Regulatory scrutiny of sponsored ranking practices in the United States and Europe may limit how far the largest networks can increase monetization. This gives mid-tier operators an opening to compete on transparency, brand safety, and customer experience.
Integrated Commerce Media Platforms are projected to record the fastest growth at a CAGR of 10.89% from 2026 to 2031. Their model brings onsite, offsite, and in-store inventory into one buying and measurement environment. Brands can use these platforms to plan campaigns across several stages of the commerce journey without relying on separate tools for each channel. This approach can reduce the operational complexity created by isolated owned networks and fragmented third-party supply. Third-Party Networks are also gaining relevance because they aggregate mid-market retailer inventory and provide access through a single demand-side platform connection. That structure can help consumer packaged goods advertisers reach grocery, pharmacy, and convenience retail audiences while managing duplication. White-Label Enablement Platforms remain smaller by direct revenue, but they provide the technical foundation for retailers that lack internal advertising technology teams. Their presence can widen participation in the commerce media services market across the Middle East, Southeast Asia, and Africa.

By Advertising Format:
Search Performance Leads, CTV Reshapes the Upper FunnelSponsored Products and Sponsored Search Ads accounted for 39.50% of the commerce media services market size in 2025. Their scale reflects broad adoption by brands that use retail search to reach customers already considering a purchase. Search queries inside a transaction environment provide a direct indication of product interest. This makes sponsored search a common entry point for advertisers who are moving performance budgets toward commerce channels. Amazon stated that shoppers using Sponsored Prompts converted more often and spent more on average in a recent quarter. Display Ads continue to serve endemic consumer packaged goods advertisers that need wider brand visibility. Audio Ads and Digital Out-of-Home and In-Transit Ads remain at an earlier stage of adoption in delivery and mobility platforms. IAB Europe’s Flexi Ad Sizes Guidelines are intended to reduce creative production barriers for display campaigns operating across several networks.
Video Ads, including Connected TV, are projected to expand at a CAGR of 10.94% through 2031, the highest rate among advertising formats. IAB expects digital video to account for most total U.S. TV and video advertising spending for the first time in the near term. Connected TV gives retailers a means to use purchase data in a channel that has traditionally supported television-style brand campaigns. Walmart Connect has linked its retail media network with VIZIO’s connected TV platform, allowing viewers to purchase featured products in the same session.[3] This design shortens the distance between brand exposure and a purchase action. Native and Shoppable Content Ads are following a related path by placing commercial messages within social and editorial settings. These formats help the commerce media services market reach audiences outside retail search while retaining a connection to transaction data. Their use also places more importance on transparent disclosures and relevant ad placement.
Geography Analysis
North America Commerce Media Services Market
North America held 39.00% of the commerce media services market share in 2025. U.S. retail media advertising spending has grown significantly and is expected to continue expanding. Offsite activation represents a meaningful share of this total. Walmart is aligning Walmart Connect U.S., Walmart Connect International, and Sam’s Club through shared technology and platforms.
APAC and Europe Commerce Media Services Market
Asia-Pacific is the second-largest regional cluster within the commerce media services market. Alibaba’s Alimama platform and JD.com’s Jingzhuntong system anchor a large ecosystem in China, where a coalition including Alibaba and JD.com committed substantial instant retail subsidies. Japan’s domestic retail media sector expanded significantly year over year. Google Japan and BCG estimated that in-store retail media could grow substantially over the long term. Europe is expanding as retailers build consent management and clean-room capabilities, while Carrefour Links is built on a large base of transactions and global customers.
MEA and South America Commerce Media Services Market
The Middle East is projected to be the fastest-expanding geography at 10.81% CAGR during the forecast period. IAB MENA documented several active retail media networks across the Gulf Cooperation Council. In South America, MercadoLibre reported strong year-over-year advertising revenue growth in U.S. dollars. Africa remains at an earlier stage, where Criteo and Massmart introduced Sponsored Product Ads and Onsite Display Ads in South Africa. These developments extend the commerce media services market into retail systems where mobile performance advertising is becoming more important.
Competitive Landscape
The commerce media services market has a concentrated group of large owned-and-operated networks and a wider field of retailers, delivery platforms, travel operators, and technology providers. Walmart’s strategy brought Walmart Connect U.S., Walmart Connect International, and Sam’s Club under shared technology and platforms. Criteo connects a broad network of retailer platforms and reported higher media spend at constant currency. Its integration with Google Search Ads 360 created an additional route for cross-network buying.
Travel and hospitality platforms are entering the commerce media services market with large loyalty datasets and high-value travel intent signals. Marriott launched MARRIOTT MEDIA using data from a large Bonvoy loyalty member base. Expedia Group Advertising partnered with Magnite to extend its programmatic offering across channels outside Expedia-owned properties. The leading competitive openings remain clean-room interoperability, standard incrementality reporting, and in-store digital media. IAB Europe’s Retail Media Certification Programme gives advertisers a compliance reference point when assessing newer networks under data-sharing constraints.
The competitive set covers retailers with owned networks, delivery and mobility platforms, travel operators, and technology providers. Retailers include Amazon, Alibaba, JD.com, Walmart, Target, Kroger, Albertsons, Ahold Delhaize, Carrefour, Tesco, MercadoLibre, and eBay. Instacart introduced Data Hub, a clean-room product for audience planning, activation, and omnichannel measurement. DoorDash expanded its advertising offering after acquiring Symbiosys, supporting off-site activity and delivery-focused first-party data access. The commerce media services industry remains competitive because technology providers such as Criteo and Publicis Groupe can help smaller retailers establish networks without building every capability internally.
Commerce Media Services Industry Leaders
-
Amazon.com, Inc.
-
Alibaba Group Holding Limited
-
JD.com, Inc.
-
Walmart Inc.
-
Target Corporation
- *Disclaimer: Major Players sorted in no particular order
Commerce Media Services Market Companies Covered in this Report
- Amazon.com, Inc.
- Alibaba Group Holding Limited
- JD.com, Inc.
- Walmart Inc.
- Target Corporation
- The Kroger Co.
- Maplebear Inc.
- DoorDash, Inc.
- Uber Technologies, Inc.
- Criteo S.A.
- Publicis Groupe S.A.
- Albertsons Companies, Inc.
- Koninklijke Ahold Delhaize N.V.
- Carrefour SA
- Tesco PLC
- MercadoLibre, Inc.
- eBay Inc.
- Booking Holdings Inc.
- Expedia Group, Inc.
- Marriott International, Inc.
Recent Industry Developments in Commerce Media Services Market
- July 2026: Criteo and Massmart, a Walmart subsidiary and one of Africa's largest consumer goods retailers, announced a retail media collaboration introducing Sponsored Product Ads and Onsite Display Ads across Massmart's South African digital properties, marking one of the first deployments of a global ad-tech platform's full product suite across sub-Saharan Africa's retail media infrastructure.
- June 2026: Walmart announced a comprehensive global commerce media strategy at Cannes Lions, aligning Walmart Connect US, Walmart Connect International (Mexico, Canada, Chile), and Sam's Club under shared technology and platforms, formally positioning Walmart as a global commerce media platform reaching over 150 million weekly customers.
- May 2026: Criteo and dentsu France launched the first fully orchestrated campaign using Criteo's Model Context Protocol, enabling agency teams to manage campaigns in natural language via a large language model interface, the first production instance of agentic AI orchestration in a commerce media buying workflow by a major holding company.
- April 2026: Expedia Group Advertising announced a partnership with Magnite to expand its programmatic offsite offering, connecting Expedia's 200 petabytes of first-party traveler intent data to brand advertisers across streaming TV, display, audio, and online video outside Expedia-owned properties.
Global Commerce Media Services Market Report Scope
Commerce Media Services Market refers to agencies, platforms, and technology providers that help brands, retailers, marketplaces, and transaction-based businesses plan, activate, and measure commerce-driven advertising. It uses first-party purchase, browsing, and customer data to deliver targeted promotions across retailer websites, apps, marketplaces, social platforms, search engines, and the open web.
The Commerce Media Services Market Report is Segmented by Platform Ownership Model (Owned and Operated, Third-Party Networks, Integrated Commerce Media Platforms, White-Label Enablement Platforms), Advertising Format (Sponsored Products and Search Ads, Display Ads, Video Ads, Native and Shoppable, Audio Ads, DOOH and In-Transit Ads), and Geography (North America, South America, Europe, Asia-Pacific, Middle East, and Africa). The Market Forecasts are Provided in Terms of Value (USD).
Segmentation Overview
| Owned and Operated Networks |
| Third-Party Networks |
| Integrated Commerce Media Platforms |
| White-Label Enablement Platforms |
| Sponsored Products and Sponsored Search Ads |
| Display Ads |
| Video Ads (including Connected TV) |
| Native and Shoppable Content Ads |
| Audio Ads |
| Digital Out-of-Home (DOOH) and In-Transit Ads |
| North America | United States |
| Canada | |
| Mexico | |
| South America | Brazil |
| Argentina | |
| Chile | |
| Rest of South America | |
| Europe | Germany |
| United Kingdom | |
| France | |
| Italy | |
| Spain | |
| Russia | |
| Netherlands | |
| Nordics | |
| Rest of Europe | |
| Asia-Pacific | China |
| Japan | |
| India | |
| South Korea | |
| Australia | |
| Southeast Asia | |
| Rest of Asia-Pacific | |
| Middle East | Saudi Arabia |
| United Arab Emirates | |
| Turkey | |
| Israel | |
| Rest of Middle East | |
| Africa | South Africa |
| Egypt | |
| Nigeria | |
| Kenya | |
| Rest of Africa |
| By Platform Ownership Model | Owned and Operated Networks | |
| Third-Party Networks | ||
| Integrated Commerce Media Platforms | ||
| White-Label Enablement Platforms | ||
| By Advertising Format | Sponsored Products and Sponsored Search Ads | |
| Display Ads | ||
| Video Ads (including Connected TV) | ||
| Native and Shoppable Content Ads | ||
| Audio Ads | ||
| Digital Out-of-Home (DOOH) and In-Transit Ads | ||
| By Geography | North America | United States |
| Canada | ||
| Mexico | ||
| South America | Brazil | |
| Argentina | ||
| Chile | ||
| Rest of South America | ||
| Europe | Germany | |
| United Kingdom | ||
| France | ||
| Italy | ||
| Spain | ||
| Russia | ||
| Netherlands | ||
| Nordics | ||
| Rest of Europe | ||
| Asia-Pacific | China | |
| Japan | ||
| India | ||
| South Korea | ||
| Australia | ||
| Southeast Asia | ||
| Rest of Asia-Pacific | ||
| Middle East | Saudi Arabia | |
| United Arab Emirates | ||
| Turkey | ||
| Israel | ||
| Rest of Middle East | ||
| Africa | South Africa | |
| Egypt | ||
| Nigeria | ||
| Kenya | ||
| Rest of Africa | ||
Key Questions Answered in the Report
What is the size of the commerce media services market?
The commerce media services market is projected to increase from USD 12.34 billion in 2026 to USD 19.81 billion by 2031, at a CAGR of 9.92%.
What is driving demand for commerce media services?
The shift toward consented first-party purchase data, retailer demand for media revenue, and advertiser interest in closed-loop measurement are supporting demand.
Which platform ownership model leads commerce media services?
Owned and Operated Networks led with 43.80% of revenue in 2025 because they control direct purchase and loyalty data.
Which advertising format is expanding fastest?
Video Ads including Connected TV are projected to expand at a CAGR of 10.94% through 2031 as retailers use purchase data in full-funnel video campaigns.
Which region is growing fastest in commerce media services?
The Middle East is projected to expand at a CAGR of 10.81% through 2031, supported by mobile-first buying behavior and growing retail media infrastructure.
What limits broader adoption of commerce media services?
Inconsistent reporting standards, heavy ad loads, sponsored ranking scrutiny, and interoperability gaps can limit advertiser confidence and shopper trust.