
Coffee Shop Market Size and Share
Market Overview
| Study Period | 2022 - 2032 |
|---|---|
| Market Size (2027) | USD 105.98 Billion |
| Market Size (2032) | USD 142.36 Billion |
| Growth Rate (2027 - 2032) | 6.08 % |
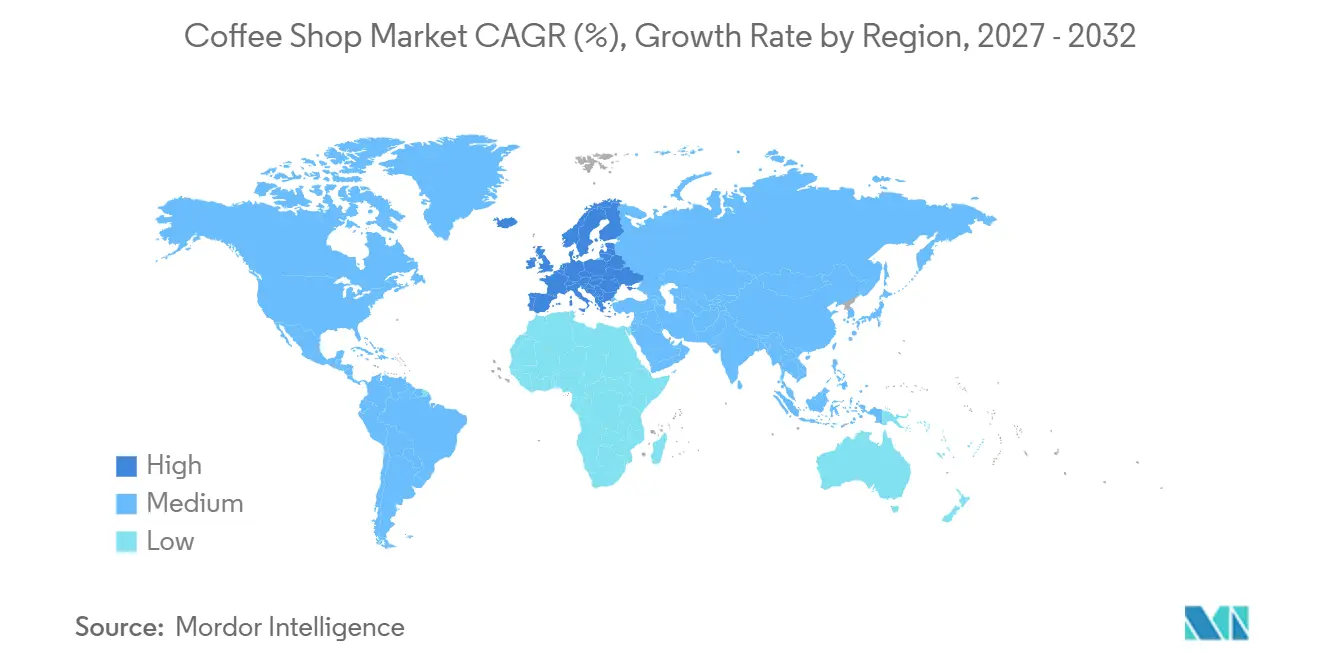
| Fastest Growing Market | Middle East and Africa |
| Largest Market | Europe |
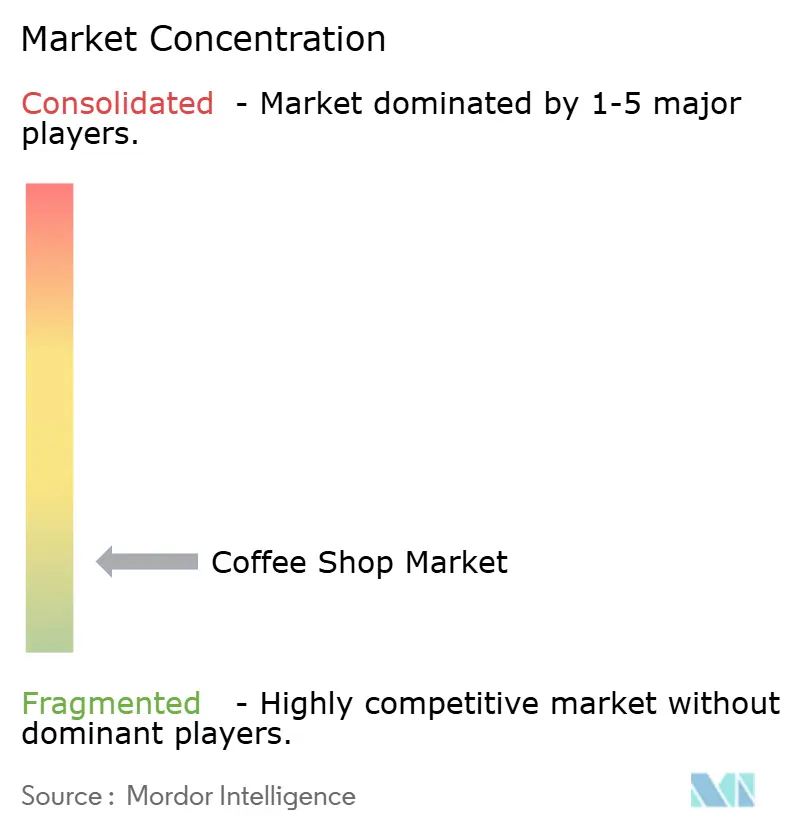
| Market Concentration | Low |
Major Players *Disclaimer: Major Players sorted in no particular order Image © Mordor Intelligence. Reuse requires attribution under CC BY 4.0. | |
Coffee Shop Market Analysis by Mordor Intelligence
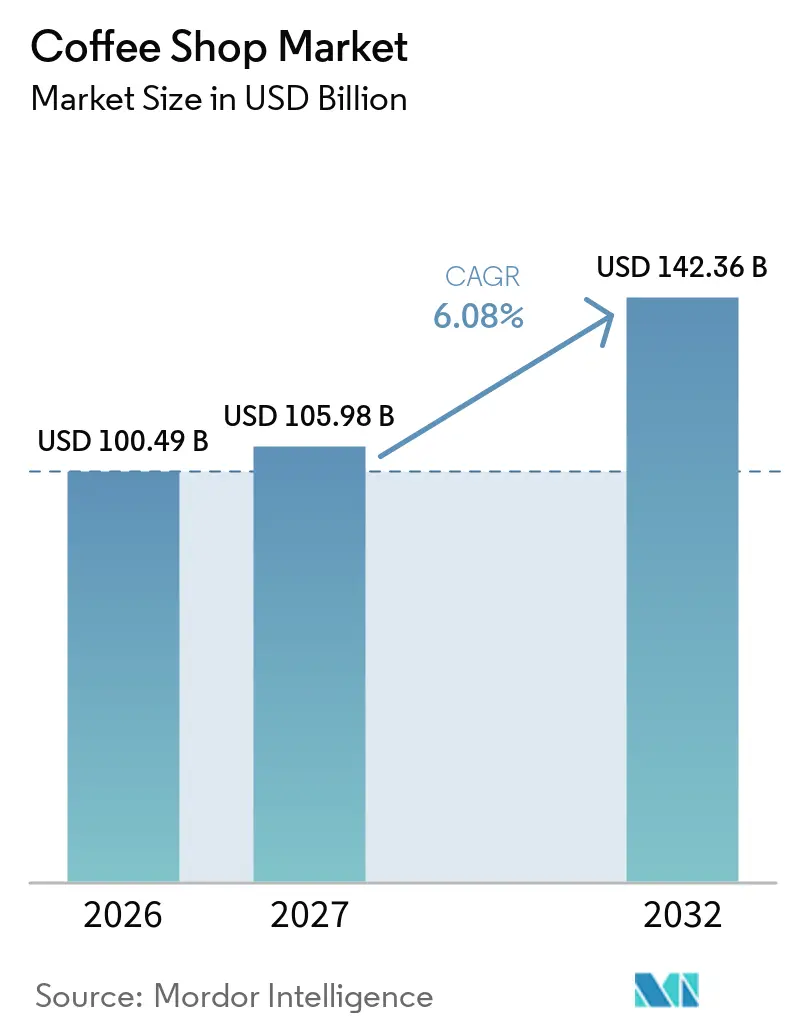
The coffee shop market size is projected to be USD 100.49 billion in 2026, USD 105.98 billion in 2027, and reach USD 142.36 billion by 2032, growing at a CAGR of 6.08% from 2027 to 2032. Rising coffee consumption continues to support market growth. According to the USDA Foreign Agricultural Service, global coffee consumption is estimated at 173.5 million 60-kilogram bags in 2025/26[1]. Out-of-home consumption remains a key demand driver, as cafés cater to social, work, and leisure occasions that home brewing cannot fully replicate. Operators are enhancing dine-in experiences while expanding delivery and digital ordering capabilities, enabling them to generate sales across multiple consumption occasions rather than merely shift purchases away from in-store counters. Competition is also intensifying, as well-funded chains leverage loyalty data, faster order fulfillment, and supply chain scale to expand their reach. At the same time, rising green coffee prices are increasing cost pressures on smaller operators.
Key Report Takeaways
- By service type, dine-in held 62.34% of the coffee shop market share in 2026, while delivery is forecast to grow at a 6.81% CAGR through 2032.
- By outlet type, independent outlets held 67.27% of the coffee shop market share in 2026, while chained outlets are forecast to grow at a 6.69% CAGR through 2032.
- By location, standalone sites held 76.45% share in 2026, while travel-linked locations are forecast to grow at a 6.56% CAGR through 2032.
- By geography, Europe held 34.71% share in 2026, while the Middle East and Africa is forecast to grow at a 6.75% CAGR through 2032.
Note: Market numbers in this report are based on Mordor Intelligence's proprietary estimation framework, which combines nine months of actuals with Q4 projections for base year 2026.
Market Trends and Insights
Drivers Impact Analysis of Coffee Shop Market*
| Driver | (~) % Impact on CAGR Forecast | Geographic Relevance | Impact Timeline |
|---|---|---|---|
| Growing Global Coffee Culture and Consumption | +1.5% | Global | Long term (≥ 4 years) |
| Rising Demand for Specialty Coffee Experiences | +1.2% | North America, Europe, and the Asia-Pacific | Medium term (2-4 years) |
| Expanding International and Regional Coffee Shop Chains | +1.0% | The Asia-Pacific, Middle East and Africa, and South America | Medium term (2-4 years) |
| Rising Popularity of Café-Based Social Experiences | +0.8% | The Middle East and Africa, Asia-Pacific, and Europe | Long term (≥ 4 years) |
| Increasing Adoption of Digital Ordering Platforms | +0.7% | North America, the Asia-Pacific, and Europe | Short term (≤ 2 years) |
| Expanding Demand for Innovative Coffee Beverages | +0.6% | North America and the Asia-Pacific | Medium term (2-4 years) |
| Source: Mordor Intelligence | |||
Growing Global Coffee Culture and Consumption
Global coffee demand has entered a phase that many structural analysts did not anticipate. The USDA projects continued growth in global coffee consumption, extending an uninterrupted decade-long growth trend. China’s coffee consumption more than doubled over the previous decade, reaching 5.6 million bags in 2024/25 and making the country the world’s sixth-largest coffee consumer. For café operators, the geographic source of new demand holds strategic importance. In historically tea-drinking markets such as India, Indonesia, and Vietnam, consumers increasingly discover coffee through affordable chain café formats rather than home brewing. As a result, the out-of-home channel serves as both the market-creation mechanism and the primary point of revenue capture. This dynamic creates a structural advantage for chain operators that enter these markets early, as initial out-of-home consumption habits often persist even as per capita incomes rise and home-brewing options become more accessible. Germany registered its highest-ever out-of-home coffee consumption at 125,500 tonnes in 2025, indicating that even mature markets continue to expand their café channel share, according to the Deutscher Kaffeeverband (April 2026).
Rising Demand for Specialty Coffee Experiences
The specialty coffee segment has transitioned from a niche category to a mainstream offering across several major markets, creating direct revenue opportunities for café operators. In the United States, 46% of adults consumed specialty coffee in the past day as of June 2025, representing a 14-year high[2]. For the first time, past-day specialty coffee consumption exceeded traditional coffee consumption, at 46% versus 42%, according to the National Coffee Association’s Specialty Coffee Report (June 2025). Past-day specialty coffee drinkers are 1.75 times more likely than traditional coffee drinkers to purchase coffee outside the home, at 35% compared with 20%. This trend expands the addressable revenue base for physical café operators. The FDA’s recent classification of plain coffee as “healthy” is likely to support continued specialty coffee demand rather than cause growth to plateau, as health awareness strongly correlates with specialty coffee preferences. In Europe, the expanding specialty coffee segments in France, Germany, and the Iberian Peninsula are creating premium-positioning opportunities that remain relatively insulated from the value-for-money competition affecting mid-tier chains, according to World Coffee Portal (April 2025). In France, specialty coffee accounts for 8% of café sales and is growing at an annual rate of 15%, with one new coffee shop opening each week, according to Collectif Café (2025).
Increasing Adoption of Digital Ordering Platforms
Digital ordering infrastructure has become a structural competitive determinant rather than an add-on feature. In April 2025, Starbucks licensed proprietary order-sequencing software from Empower Delivery and appointed the company’s founder as its chief store development officer. The initiative targets beverage fulfillment in under four minutes and reflects the company’s recognition that mobile order management is now critical to same-store sales recovery, according to the National Association of Convenience Stores (April 2025)[3]. In the same month, Bluestone Lane deployed Square’s integrated platform across all 65 US locations. The company reported a 50% increase in order-processing speed and real-time data integration across payroll, delivery, and analytics. Digital ordering also enables operators to collect behavioral data at scale, including loyalty preferences, order frequency, and daypart patterns. Operators that effectively aggregate and use this data can generate compounding unit economics advantages. In Spain, coffee delivery orders through Glovo increased by 15% year over year during the six months ending October 2025. Weekend brunch periods (09:00–12:00) accounted for 50% of café delivery volume, indicating that digital-channel growth is incremental to, rather than cannibalistic of, dine-in demand.
Expanding International and Regional Coffee Shop Chains
The global café expansion landscape has shifted structurally, with the most aggressive international growth now originating from Asia, Latin America, and the Middle East. Cotti Coffee, founded in October 2022 by former Luckin Coffee executives, operates more than 18,000 outlets across 28 countries. The company plans to enter the UK market in February 2026 with locations on Middlesex Street and Camden High Street in London, following its expansion into France, Germany, and Spain. Brazil-based The Coffee, which operates 275 units globally, is raising approximately USD 10 million in private equity to support expansion into the United States, Africa, and Oceania, with 90 openings planned over a four-month period. Colombia’s Juan Valdez has announced a partnership with Grupo Trinity to open 140 new cafés in Spain over the next seven years. These emerging multinational operators benefit from lower cost structures, strong unit economics in their home markets, and digital-first operating models, substantially broadening the competitive landscape for local incumbents in both developed and high-growth markets.
Restraints Impact Analysis of Coffee Shop Market*
| Restraint | (~) % Impact on CAGR Forecast | Geographic Relevance | Impact Timeline |
|---|---|---|---|
| Volatile Coffee Bean Prices and Supply | -1.2% | Global | Short term (≤ 2 years) |
| High Rental and Operational Costs | -0.9% | North America and Europe | Medium term (2-4 years) |
| Intensifying Competition from Alternative Beverage Retailers | -0.6% | North America and the Asia-Pacific | Medium term (2-4 years) |
| Growing Consumer Preference for Home-Brewed Coffee | -0.5% | North America and Europe | Long term (≥ 4 years) |
| Source: Mordor Intelligence | |||
Volatile Coffee Bean Prices and Supply
Input cost pressure represents the most acute near-term constraint across the global coffee shop market. Arabica coffee futures are expected to reach an all-time high of USD 4.38 per pound on October 23, 2026, extending a sustained rally driven by adverse weather in Brazil, depletion of global certified stocks, and uncertainty surrounding US tariff policy. The International Coffee Organization's 2024/25 Annual Review indicates that the composite indicator price averaged 306.6 US cents per pound, 118.3% above the 10-year average, compressing margins across the café supply chain. Independent operators bear a disproportionate share of this cost volatility because they lack the long-term procurement contracts and hedging capabilities available to major chains. This disadvantage is a key driver of market consolidation. Retail menu prices are also increasing in response: Europe's average cappuccino price rose by 7.6% to EUR 3.69. However, the United Nations Food and Agriculture Organization estimates that upstream price shocks require approximately 12 months to fully pass through to consumer menu prices, creating a sustained period of margin compression through 2027. Regulatory developments under World Trade Organization agricultural trade rules and country-specific import tariff frameworks also require close monitoring. In particular, US executive authority over Brazilian green coffee imports represents a material compliance consideration for procurement teams across the industry.
High Rental and Operational Costs
High rental and operational costs constrain the profitability and expansion of coffee-focused shops, particularly independent operators relying on beverage sales alone. Prime locations near offices, transport hubs, and high-footfall commercial districts command substantial occupancy costs, while wages, electricity, equipment maintenance, and coffee procurement further increase operating expenses. According to the National Restaurant Association's September 2025 report, occupancy costs accounted for a median 6% of sales among limited-service restaurants in urban areas in 2024. Furthermore, its July 2026 analysis estimated that total restaurant expenses increased 36% between 2019 and 2026. These cost pressures can force coffee-only outlets to increase beverage prices, potentially weakening affordability and customer retention, or absorb expenses through lower margins, restricting investment and expansion.
*Our forecasts treat driver/restraint impacts as directional, not additive. The impact forecasts reflect baseline growth, mix effects, and variable interactions.
Coffee Shop Market Segment Analysis
By Service Type:
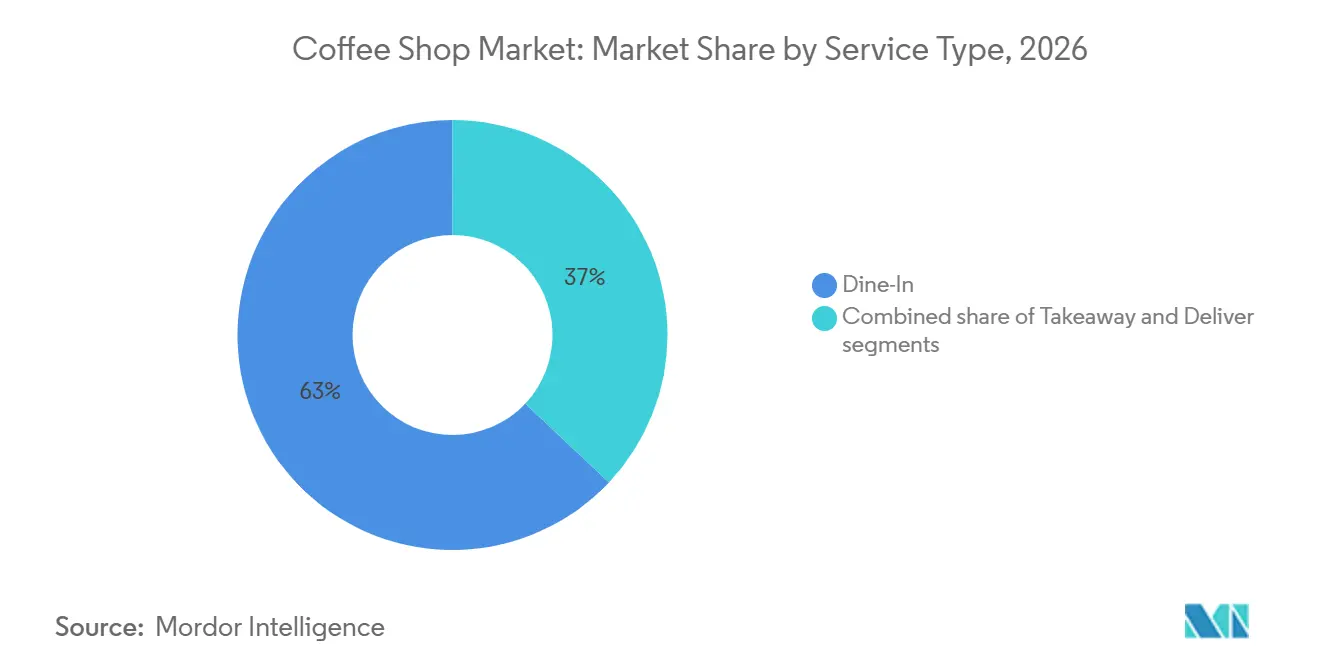
Delivery Leads Growth as Dine-In Anchors Market RevenueDine-in held 62.34% of revenue in 2026, making it the largest service format in the coffee shop market. The position reflects the café’s role as a place to meet, work, and spend leisure time. These uses are difficult for delivery to replicate because the customer values the setting as well as the drink. A comfortable store environment can therefore remain a meaningful part of customer retention. It can also support larger orders when customers stay longer, meet others, or pair coffee with food. Delivery is forecast to grow at a 6.81% CAGR through 2032, the fastest pace among service formats. This expansion is supported by broader acceptance of food and beverage delivery and by systems that coordinate orders from more than one channel.
Delivery can add sales during occasions when a café visit is less convenient, including home, office, and weekend orders. Starbucks’ 2025 investment in faster mobile order handling reflects the importance of clear handoff and order sequencing as digital volume grows. Bluestone Lane’s reported 50% improvement in order throughput after deploying an integrated platform also illustrates the operating value of connected systems. Takeaway occupies the middle ground between these formats because it emphasizes speed and access rather than an extended visit. It is particularly relevant in dense urban areas and morning commuting periods. The coffee shop industry benefits when operators protect the dine-in experience while making delivery and takeaway simple to use.

By Outlet Type:
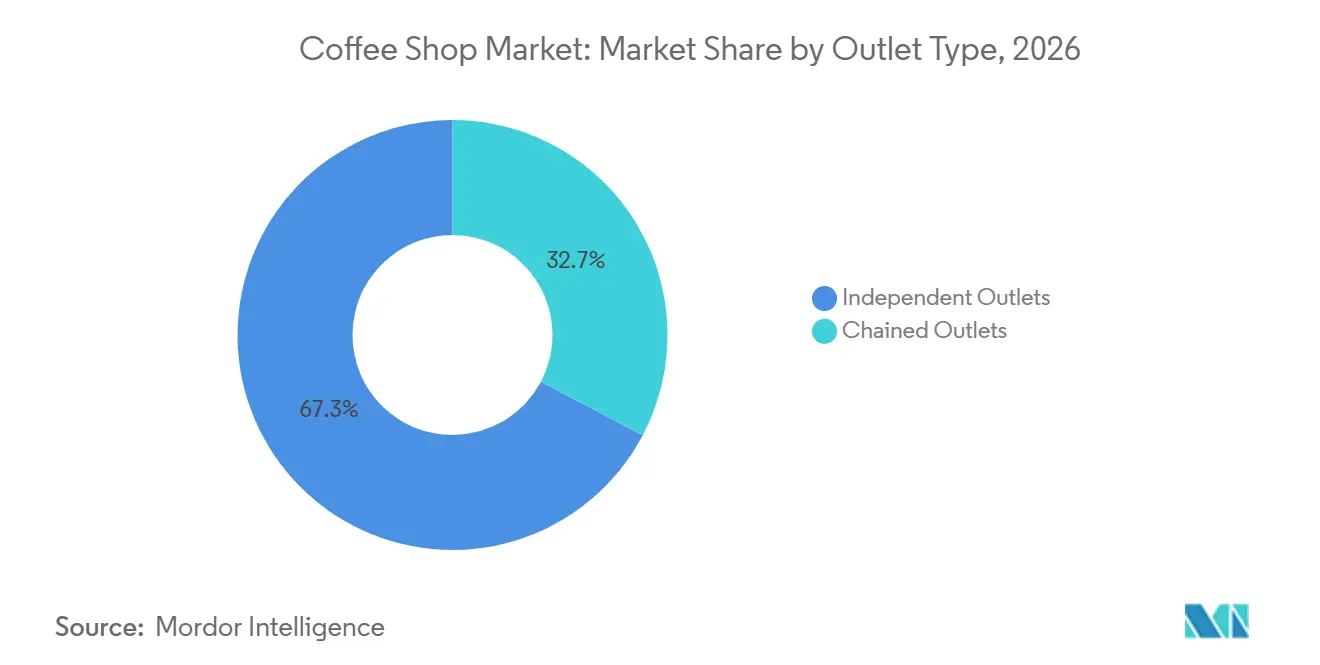
Chained Formats Draw Capital as Independent Scale Remains DominantIndependent outlets held 67.27% of revenue in 2026, preserving the largest position by outlet type in the coffee shop market. This position reflects the wide base of local cafés in developing economies and specialty locations in mature markets. Independents can build loyalty through local knowledge, distinctive menus, and personal service. Their smaller size can also help them adapt store design and product selection to neighborhood needs. Local relationships may also help them respond quickly when customers favor a new drink, a different daypart, or a more personal service style. However, their financial flexibility may be limited when coffee, labor, and occupancy costs rise at the same time. The International Coffee Organization's (ICO) 2024/25 price data shows why procurement volatility is an important operating issue for cafés without scale.
Chained outlets are forecast to expand at a 6.69% CAGR through 2032, the fastest rate in this segmentation. Chain operators can spread investments in loyalty, supply planning, digital ordering, and staff processes across a larger network. These tools can improve order accuracy and help operators understand which products and dayparts generate repeat demand. Square’s work with Bluestone Lane shows how a shared platform can connect operational data across multiple locations. Chained growth does not remove the need for a clear local offer because customers still compare quality, convenience, and price. The coffee shop market is likely to reward independents that maintain a differentiated proposition and chains that pair scale with consistent execution.
By Location:
Standalone Sites Anchor Revenue While Travel Formats Post the Fastest GrowthStandalone sites held 76.45% of revenue in 2026, which makes them the leading location format in the coffee shop market. The format covers the broad range of street-level and neighborhood cafés used by urban and suburban customers. Its scale reflects the importance of accessible daily locations for routine purchases and informal meetings. Germany’s out-of-home coffee consumption reached 125,500 tonnes in 2025, supporting the continuing relevance of cafés, restaurants, and office-adjacent points of sale, according to DEUTSCHER KAFFEEVERBAND. Standalone cafés can also serve as visible local brand touchpoints. They give operators more control over opening hours, menu presentation, seating, and the customer journey than many concession locations. Their exposure to ordinary retail rents means that store productivity and customer frequency remain central to viability.
Travel-linked locations are forecast to grow at a 6.56% CAGR through 2032, the highest rate among location types. Airports, rail stations, and other transit hubs provide concentrated demand from customers with limited time and fewer alternatives. These sites can justify higher concession costs when traffic volumes and operational reliability are strong. Leisure locations can benefit when cafés are included within cultural, entertainment, and event settings. Retail-embedded formats also offer a way for retailers to add a foodservice visit to a routine shopping trip. This part of the coffee shop market depends on reliable service because customers often make purchases under time pressure. Lodging-linked formats face a more selective opportunity, although hotel cafés can attract local traffic when they operate as welcoming neighborhood spaces.
Geography Analysis
Europe
Europe held 34.71% of global revenue in 2026, giving the coffee shop market its largest regional base. The region benefits from established café habits and a wide range of formats, from daily neighborhood stores to premium specialty concepts. Germany recorded 125,500 tonnes of out-of-home coffee consumption in 2025, a record level that confirms continuing demand beyond the home, according to DEUTSCHER KAFFEEVERBAND. The same source reported that whole-bean volume had more than doubled over 10 years, which points to a durable interest in quality and preparation. This can favor operators that communicate product quality clearly and provide a reliable in-store experience. Customers can also use cafés as flexible places for meetings and individual work, which helps sustain the role of the physical store. At the same time, higher bean prices, energy expenses, and rents test mid-tier operators that cannot compete solely on price. Food-safety requirements and local employment rules remain relevant compliance factors when operators expand across European markets.
Middle East and Africa
The Middle East and Africa is forecast to grow at a 6.75% CAGR from 2027 to 2032, making it the fastest-growing geography in the coffee shop market. A young population and rising interest in branded café experiences support the region’s expansion. The opportunity is strongest where urban development, retail investment, and social café use are developing together. International chains can use franchise partnerships to enter the region while adapting menus and store formats to local demand. New locations can also become part of shopping, social, and work routines where formal café formats are still developing. Consistent food-safety processes and franchise disclosure practices are important compliance factors for new operators. Growing customer expectations for specialty products and comfortable social spaces also give regional brands room to develop. Operators that balance premium positioning with accessible pricing are better placed to reach a wide base of customers.
North America, Asia-Pacific, and South America
North America remains a large coffee market where digital convenience, drive-through access, and specialty products shape customer choices. U.S. specialty coffee consumption reached a 14-year high in June 2025, with 46% of adults reporting past-day consumption, according to the National Coffee Association. Asia-Pacific offers stronger outlet expansion potential because coffee consumption is still developing in several populous countries. China’s consumption reached 5.6 million bags in 2024/25 after more than doubling over the preceding decade, according to the USDA FAS. India, Indonesia, and Vietnam are important because affordable café formats can establish out-of-home habits among new customers. South America combines an established coffee culture with café brands seeking to expand beyond their home countries. Consumer preferences are not identical across these regions, so formats that work in one country may require changes in menu, price, and store design elsewhere. Across these mixed geographies, digital ordering, loyalty tools, and clear store formats can help operators adjust to local customer behavior.
Competitive Landscape
The coffee shop market is highly fragmented, with no single operator holding dominant power across borders. This structure leaves room for local operators, regional chains, and global brands to compete in the same cities. It also means that store execution can matter more than broad brand recognition in many local markets. Larger chains are investing in order management, customer data, and supply systems to make their networks more efficient. This can improve repeat ordering, reduce service errors, and help stores handle busy periods with more consistency. Starbucks’ April 2025 order-management agreement shows how technology has become part of the response to store-level service needs. Luckin Coffee reported 31,048 stores and RMB 49,288.1 million in revenue in fiscal 2025, while its cumulative transacting customer base exceeded 450 million.
Technology-led operators can use order histories, loyalty activity, and daypart patterns to improve promotions and staffing. This capability creates a different competitive pressure from traditional location-led expansion. Bluestone Lane’s deployment of Square across 65 U.S. stores linked ordering, delivery, loyalty, payroll, and analytics in a single operating system. The reported 50% improvement in throughput illustrates why such systems can affect the economics of busy stores. Better visibility can also help managers adjust staff deployment and menu availability as demand changes during the day. Large operators still need beverage quality, convenient locations, and credible value because data tools alone do not create repeat visits. Smaller cafés can remain competitive when they have a clear specialty position, strong neighborhood relevance, or better service in a focused area.
Competition also extends into sourcing and packaged coffee platforms, which can influence what café operators pay for supply and how they structure partnerships. Keurig Dr. Pepper’s February 2026 financing announcement for the JDE Peet’s acquisition indicated plans to form a Global Coffee Co and a Beverage Co. The transaction shows continued interest in vertical scale within coffee. New entrants need to comply with local food-safety, labeling, franchise, and employment requirements as they add stores. A well-defined compliance process can prevent launch delays and support more consistent operations across a growing network. In India, the Food Safety and Standards Authority of India is a key regulatory body for food businesses. In other markets, franchise disclosure rules and local municipal permissions can shape the speed and cost of rollout. The competitive field, therefore, favors operators who combine disciplined compliance with a financially sustainable store model.
Coffee Shop Industry Leaders
-
Starbucks Corporation
-
Luckin Coffee Inc.
-
Costa Coffee Limited
-
JDE Peet’s N.V.
-
Dutch Bros Inc.
- *Disclaimer: Major Players sorted in no particular order
Coffee Shop Market Companies Covered in this Report
- Starbucks Corporation
- Luckin Coffee Inc.
- Costa Coffee Limited
- JDE Peet’s N.V.
- Luigi Lavazza S.p.A. / Lavazza
- Dutch Bros Inc.
- Caffè Nero Group Ltd
- Blue Bottle Coffee, Inc.
- Caribou Coffee Operating Company, Inc.
- Tully’s Coffee
- Doutor Coffee Co., Ltd.
- Ediya Coffee Co., Ltd.
- Coffee Day Global Limited / Café Coffee Day
- Barista Coffee Company Limited
- Gloria Jean’s Coffees
- The Coffee Bean & Tea Leaf
- Intelligentsia Coffee, Inc.
- Stumptown Coffee Roasters, Inc.
- % Arabica
- Scooter’s Coffee
Recent Industry Developments in Coffee Shop Market
- September 2026: Starbucks opened its first coffeehouse in Tegucigalpa, Honduras, marking its arrival in the country's capital and the 1,900th coffeehouse across Latin America and the Caribbean. Operated by Premium Restaurants of America, the outlet strengthened the brand's regional presence and extended access to its coffee offerings.
- August 2025: Greek coffeehouse chain Coffee Island opened its second Indian outlet in Hyderabad, following its initial entry through Gurugram. The opening expanded its Indian footprint through a franchise partnership and supported its strategy of introducing specialty coffee offerings to new international markets.
- July 2025: Luckin Coffee began soft-opening its first two US pickup stores in Manhattan, New York, marking its entry into the American market. The locations targeted high-traffic areas near Washington Square Park and Midtown, supporting the company's international expansion strategy.
Global Coffee Shop Market Report Scope
A coffee shop is a small, informal establishment that primarily serves coffee. The global coffee shop market is segmented by service type, outlet, location, and geography. By service type, the market is segmented into dine-in, takeaway, and delivery. By outlet, the market is segmented into chained outlets and independent outlets. By location, the market is segmented into standalone, retail, travel, leisure, and lodging. By geography, the market is segmented into North America, Europe, Asia-Pacific, South America, and the Middle East and Africa. The market forecasts are provided in terms of value (USD).
Segmentation Overview
| Dine-In |
| Takeaway |
| Delivery |
| Chained Outlets |
| Independent Outlets |
| Standalone |
| Retail |
| Travel |
| Leisure |
| Lodging |
| North America | United States |
| Canada | |
| Mexico | |
| Rest of North America | |
| Europe | United Kingdom |
| Germany | |
| France | |
| Italy | |
| Spain | |
| Sweden | |
| Belgium | |
| Poland | |
| Netherlands | |
| Rest of Europe | |
| Asia-Pacific | China |
| Japan | |
| India | |
| Thailand | |
| Singapore | |
| Indonesia | |
| South Korea | |
| Australia | |
| Rest of Asia-Pacific | |
| South America | Brazil |
| Argentina | |
| Colombia | |
| Peru | |
| Chile | |
| Rest of South America | |
| Middle East and Africa | United Arab Emirates |
| South Africa | |
| Saudi Arabia | |
| Nigeria | |
| Egypt | |
| Morocco | |
| Turkey | |
| Rest of Middle East and Africa |
| By Service Type | Dine-In | |
| Takeaway | ||
| Delivery | ||
| By Outlet | Chained Outlets | |
| Independent Outlets | ||
| By Location | Standalone | |
| Retail | ||
| Travel | ||
| Leisure | ||
| Lodging | ||
| By Geography | North America | United States |
| Canada | ||
| Mexico | ||
| Rest of North America | ||
| Europe | United Kingdom | |
| Germany | ||
| France | ||
| Italy | ||
| Spain | ||
| Sweden | ||
| Belgium | ||
| Poland | ||
| Netherlands | ||
| Rest of Europe | ||
| Asia-Pacific | China | |
| Japan | ||
| India | ||
| Thailand | ||
| Singapore | ||
| Indonesia | ||
| South Korea | ||
| Australia | ||
| Rest of Asia-Pacific | ||
| South America | Brazil | |
| Argentina | ||
| Colombia | ||
| Peru | ||
| Chile | ||
| Rest of South America | ||
| Middle East and Africa | United Arab Emirates | |
| South Africa | ||
| Saudi Arabia | ||
| Nigeria | ||
| Egypt | ||
| Morocco | ||
| Turkey | ||
| Rest of Middle East and Africa | ||
Key Questions Answered in the Report
What is the projected size of the coffee shop sector by 2032?
The coffee shop market is projected to reach USD 142.36 billion by 2032, rising from USD 105.98 billion in 2027 at a 6.08% CAGR.
Which service format is growing fastest for coffee shops?
Delivery is forecast to grow at a 6.81% CAGR through 2032, while dine-in remains the largest format with 62.34% revenue share in 2026.
Why do independent coffee shops still hold a large position?
Independent outlets held 67.27% of revenue in 2026 because local cafés and specialty stores remain widely used across both mature and developing economies.
Which location format has the strongest growth outlook?
Travel-linked sites are forecast to grow at a 6.56% CAGR through 2032, supported by demand at airports, rail stations, and other transit points.