
Co-Working Spaces Furniture Market Size and Share
Market Overview
| Study Period | 2021 - 2031 |
|---|---|
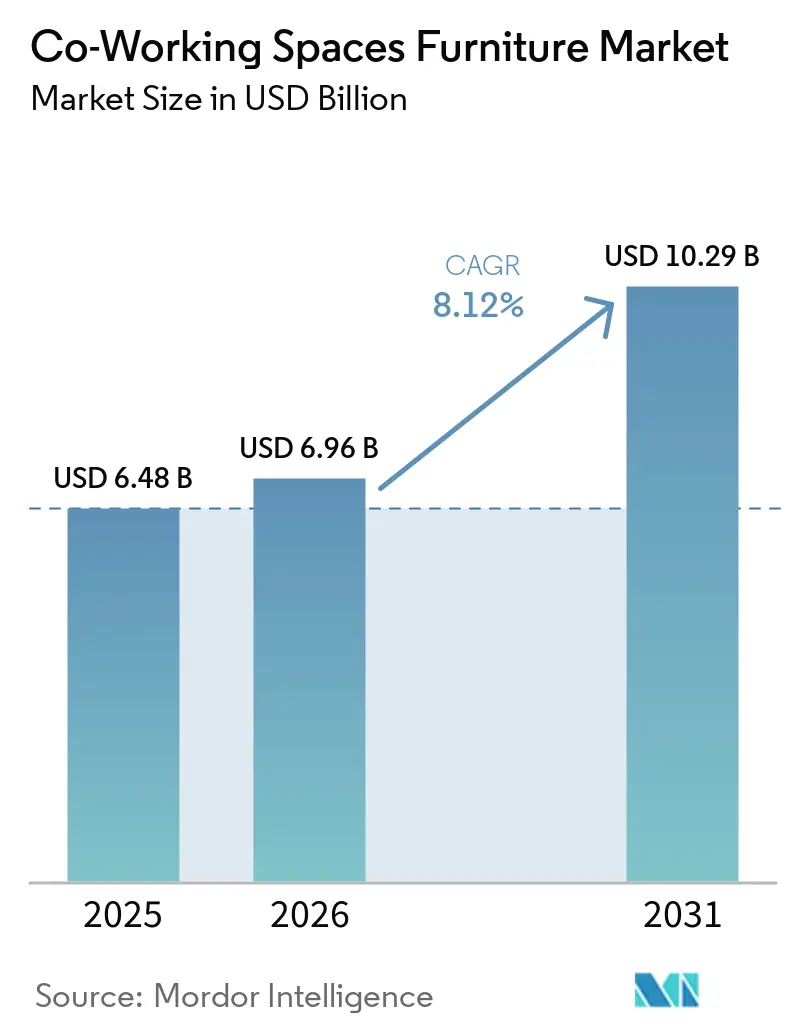
| Market Size (2026) | USD 6.96 Billion |
| Market Size (2031) | USD 10.29 Billion |
| Growth Rate (2026 - 2031) | 8.12 % |
| Fastest Growing Market | Asia-Pacific |
| Largest Market | Asia-Pacific |
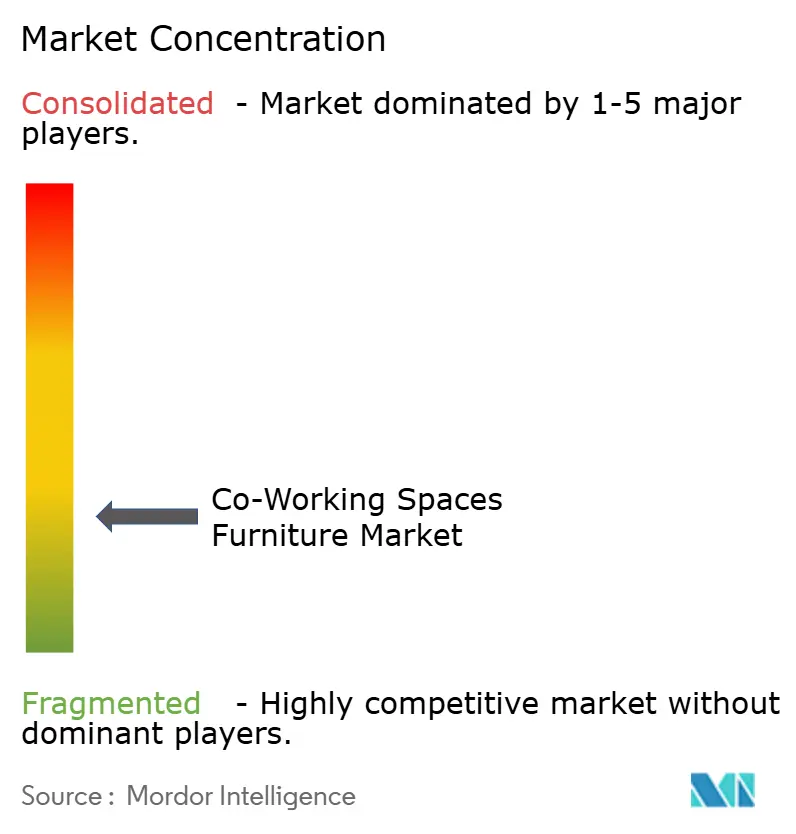
| Market Concentration | Low |
Major Players *Disclaimer: Major Players sorted in no particular order Image © Mordor Intelligence. Reuse requires attribution under CC BY 4.0. | |
Co-Working Spaces Furniture Market Analysis by Mordor Intelligence
The co-working spaces furniture market size is projected to expand from USD 6.48 billion in 2025 and USD 6.96 billion in 2026 to USD 10.29 billion by 2031, registering a CAGR of 8.1% between 2026 and 2031. Demand in the co-working spaces furniture market is tied to operator fit-outs, enterprise hub investments, and the wider use of managed flexible workspaces. Hybrid work supports repeat furniture purchases because operators need layouts that can accommodate recurring changes in attendance and team use. Shared offices also place more strain on seating, desks, storage, and partitions than conventional offices, which can shorten replacement cycles. Suppliers are responding with modular systems, acoustic products, and service models that allow operators to change layouts without replacing a full installation. The co-working spaces furniture market, therefore, depends on both new workspace openings and the need to refresh existing locations.
Key Report Takeaways
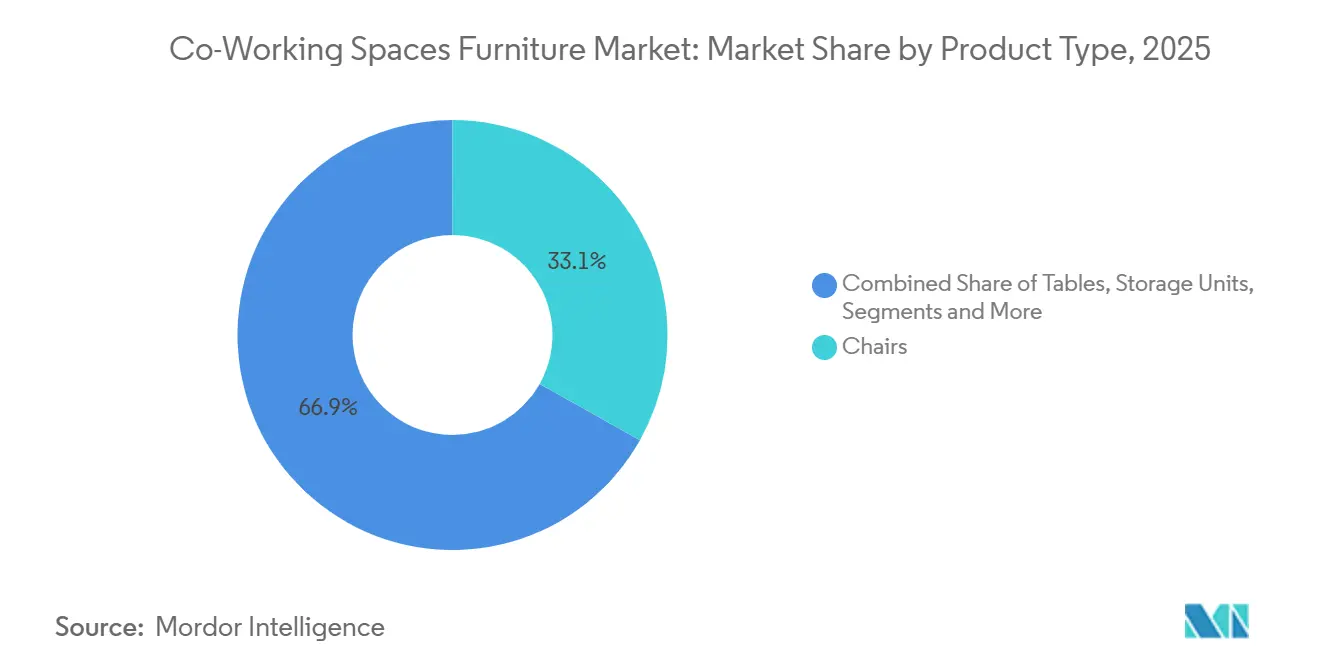
- By product type, Chairs held 33.1% of the co-working spaces furniture market share in 2025, while Booths and Office Dividers are forecast to expand at a 9.4% CAGR through 2031.
- By material, Metal held 38.1% of the co-working spaces furniture market share in 2025, while Plastic is projected to expand at a 9.1% CAGR through 2031.
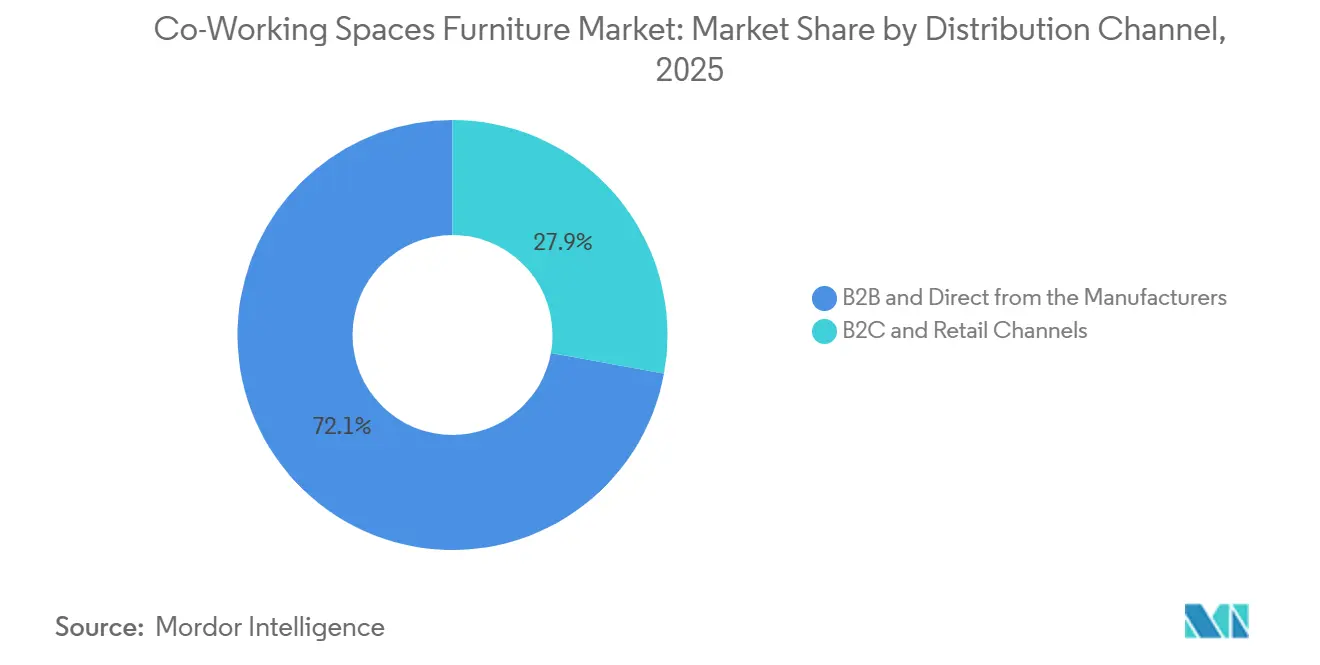
- By distribution channel, B2B and Direct accounted for 72.1% of revenue in 2025, while B2C and Retail Channels are forecast to expand at a 9.6% CAGR through 2031.
- By mobility and configuration, Modular and Reconfigurable Furniture accounted for 43.1% of revenue in 2025 and is forecast to expand at a 9.0% CAGR through 2031.
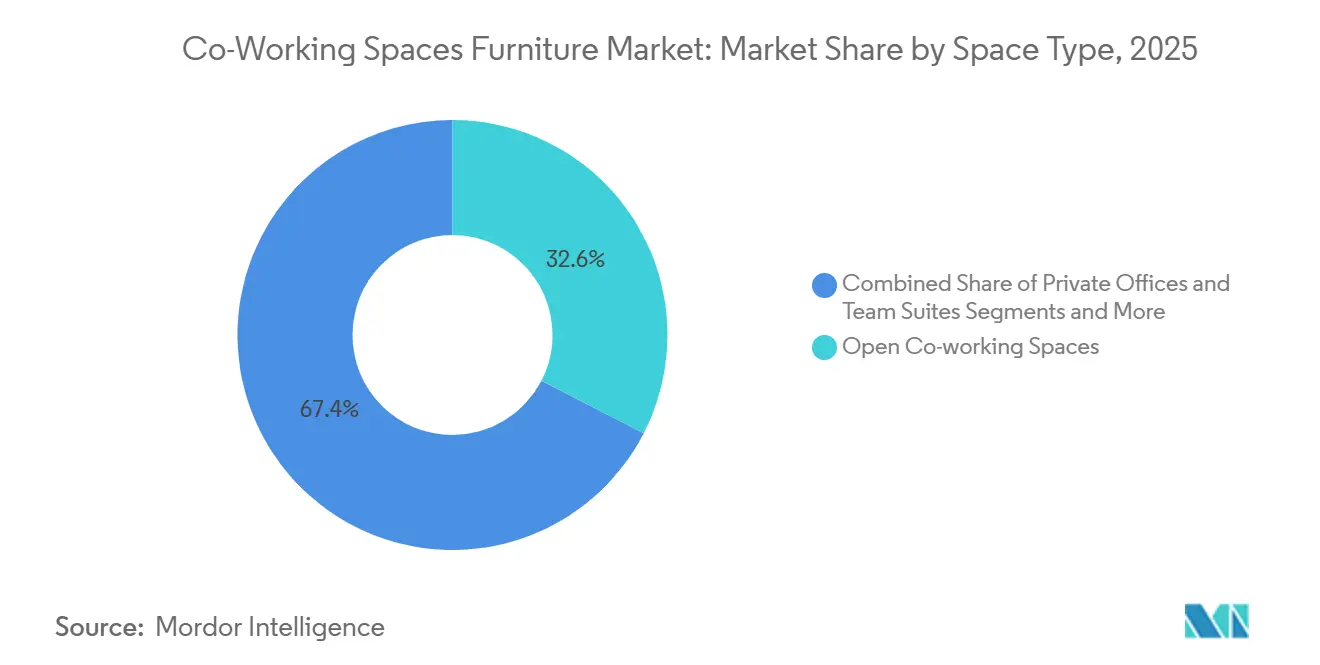
- By space type, Open Co-working Spaces held 32.6% of revenue in 2025, while Hybrid and Satellite Work Hubs are forecast to expand at a 9.6% CAGR through 2031.
- By capacity and use zone, Individual Work Zones held 44.6% of revenue in 2025, while Small Collaboration Zones are forecast to grow at a 9.3% CAGR through 2031.
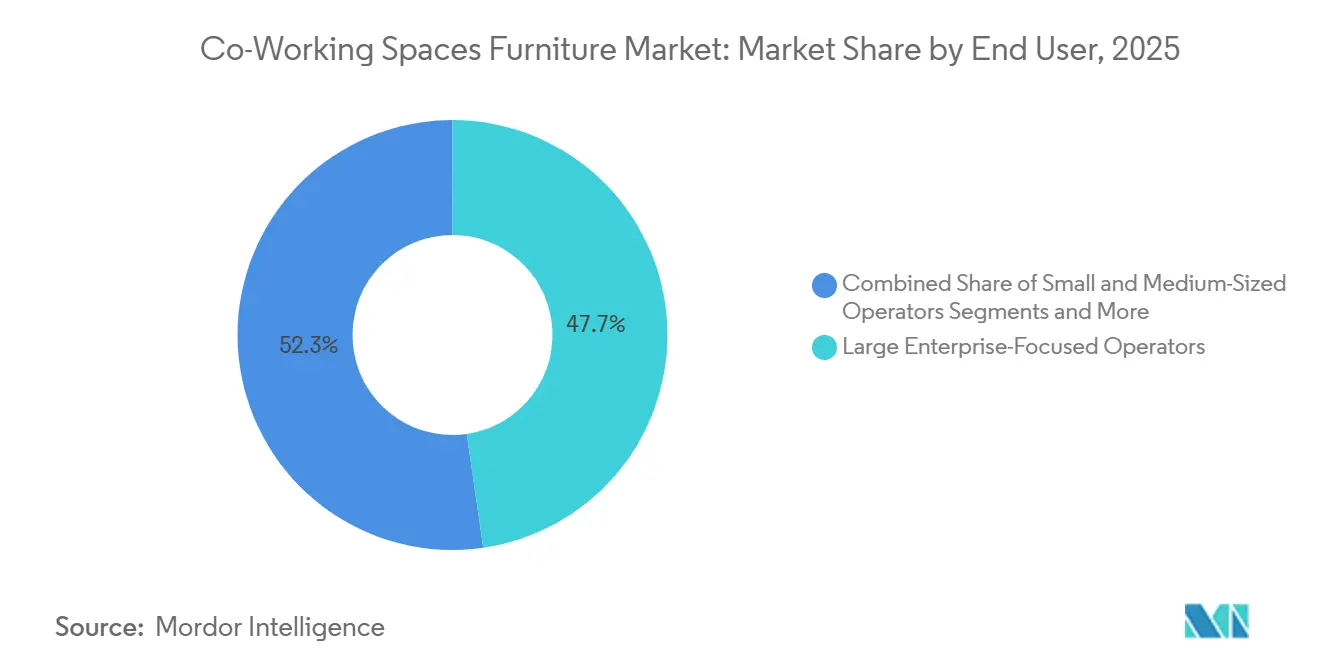
- By end user, Large Enterprise-Focused Operators held 47.7% of revenue in 2025, while Small and Medium-Sized Operators are forecast to grow at an 8.8% CAGR through 2031.
- By geography, Asia-Pacific held 36.8% of revenue in 2025 and is forecast to grow at a 9.6% CAGR through 2031.
Note: Market size and forecast figures in this report are generated using Mordor Intelligence’s proprietary estimation framework, updated with the latest available data and insights as of January 2026.
Global Co-Working Spaces Furniture Market Trends and Insights
Drivers Impact Analysis*
| Driver | (~) % Impact on CAGR Forecast | Geographic Relevance | Impact Timeline |
|---|---|---|---|
| Hybrid Work and Flexible-Desk Adoption | +2.5% | Global | Short term (≤ 2 years) |
| Real Estate Cost Optimization Through Desk Sharing | +1.8% | North America, Europe, Asia-Pacific core | Medium term (2-4 years) |
| Demand for Acoustic Privacy and Focus Zones | +1.2% | North America and Europe, spillover to the Asia-Pacific | Medium term (2-4 years) |
| Rapid Reconfiguration and Shorter Fit-Out Cycles | +1.0% | Global | Short term (≤ 2 years) |
| Ergonomics, Wellbeing, and Premium Member Experience | +0.8% | North America, Europe, Australia, and Japan | Medium term (2-4 years) |
| Furniture-as-a-Service and Cost-Per-Usage Procurement | +0.7% | North America and Europe, with early gains in India and South Korea | Long term (≥ 4 years) |
| Source: Mordor Intelligence | |||
Hybrid Work Formalization Creates Stable, Repeatable Furniture Procurement
Hybrid work has become a more defined part of workplace planning, rather than a temporary response to changing work patterns. The organizations now set a required number of office days, which gives operators clearer attendance patterns for planning space. That predictability supports investment in durable seating, desks, storage, and meeting settings across the co-working spaces furniture market. It also creates a reason to refresh layouts when prior installations no longer suit the way members use a location. Framery stated that replacement sales could represent close to half of unit volume in core office-pod markets by 2030, which supports the importance of recurring demand for acoustic products [1]. Operators in the co-working spaces furniture market that can update work zones without closing large parts of a site can protect occupancy and member experience.
Real Estate Cost Optimization Channels Capital Into Furniture Upgrades
Desk sharing allows occupiers to use less dedicated space while keeping access to work settings that suit individual and group tasks. Retained space must serve more purposes, which increases the value of flexible tables, movable seating, integrated storage, and privacy products. This creates a practical link between real estate optimization and furniture spending in the co-working spaces furniture market. Large operators can standardize specifications across several sites and use volume commitments to reduce procurement costs. Echelon Workplaces stated that its supply program for WeWork covered more than 700,000 desk-chair-pedestal sets across 700 buildings in 30 countries and delivered savings above USD 100 million [2]. Smaller operators in the co-working spaces furniture market may use the same logic on a limited scale by selecting adaptable systems instead of fixed layouts.
Acoustic Privacy Spending Shifts From Optional to Operational Necessity
Shared workplaces need places for private calls, focused work, and small meetings, especially where open-plan seating remains common. Gensler reported that noise and meeting-space availability remained unresolved workplace issues, and 1 in 4 surveyed employees used their own ergonomic or visual privacy fixes [3]. This supports demand for booths, dividers, screens, and enclosed meeting products in the co-working spaces furniture market. Framery reported EUR 222.1 million in FY2025 revenue, a 37% year-on-year increase, with its Asia-Pacific entity revenue rising 91.8%. Operators can use acoustic products to improve privacy without giving up the density benefits of shared space. Ergonomic and environmental certifications can also influence co-working spaces' furniture market product selection when enterprise tenants include health, safety, and sustainability requirements in their space agreements.
Shorter Fit-Out Cycles Reward Modular, Pre-Assembled Configurations
A delayed opening can postpone membership revenue, so co-working operators value products that can be installed and reconfigured quickly. Modular workstations, shared storage, collaboration elements, and soft boundaries allow a site to change its use without a full redesign. This makes rapid-assembly products relevant to the co-working spaces furniture market, even when the initial purchase cost is higher than basic fixed furniture. Standardized product ranges also make multi-location rollouts easier to manage. Echelon Workplaces described its WeWork program as a direct supply model that supported consistent procurement across a large global portfolio. The same operational need helps explain why portable desks, dividers, and storage products are increasingly specified together rather than as separate purchases.
Restraints Impact Analysis*
| Restraint | (~) % Impact on CAGR Forecast | Geographic Relevance | Impact Timeline |
|---|---|---|---|
| High Upfront Capital Cost for Premium Systems | -1.5% | Global, with greater exposure in SME-led Asia-Pacific and Africa | Short term (≤ 2 years) |
| Supply-Chain, Installation, and After-Sales Complexity | -0.8% | Global, with greater exposure in South America and Africa | Medium term (2-4 years) |
| High-Intensity Shared Use Accelerates Wear and Warranty Claims | -0.5% | Global | Medium term (2-4 years) |
| Fire, Accessibility, Egress, and Acoustic-Code Constraints Limit Layout Flexibility | -0.4% | Developed markets, including North America, the EU, and Australia | Long term (≥ 4 years) |
| Source: Mordor Intelligence | |||
High Upfront Capital Constrains Premium System Adoption Among Smaller Operators
Premium seating, sit-stand desks, acoustic panels, and storage systems can require a material upfront commitment from an operator. The fully specified contract-grade station at USD 3,000 to USD 5,000 per position. This can limit adoption among smaller operators, even though that group is forecast to grow faster than the wider co-working spaces furniture market. Furniture-as-a-service can move part of the cost from capital spending to operating spending, but access to providers remains uneven across regions. The result is often a difference between flagship locations and smaller centers in the furniture specification they can support. Suppliers that offer durable entry-level systems and flexible payment terms may be better placed to serve secondary cities and emerging markets.
Supply-Chain and Installation Complexity Extends Lead Times and Raises Delivery Risk
Operators begin earning revenue when members can use a site, so delays in delivery or installation carry direct commercial risk. Cross-border projects can require coordinated logistics, local compliance checks, installation labor, replacement parts, and service support. NARBUTAS reported that rising United States tariffs and weaker conditions in Germany and France complicated fulfillment and pricing in key export markets. These conditions can make a low purchase price less valuable if products are difficult to install, repair, or replace. Fragmented warranties and service contracts add further work for operators with several furniture suppliers. This is particularly challenging for smaller firms that do not have dedicated procurement teams.
*Our forecasts treat driver/restraint impacts as directional, not additive. The impact forecasts reflect baseline growth, mix effects, and variable interactions.
Segment Analysis
By Product Type: Acoustic Enclosures Reshape Seating-Dominant Spending
Chairs held a 33.1% revenue share in 2025, reflecting the basic need for a seat at every individual workstation and meeting setting. Employee chairs, meeting chairs, and guest chairs remain the largest recurring product group because they are used throughout the workspace. Tables follow as a core requirement for desks, conference rooms, and collaboration settings. Storage units help operators manage dense floor plans and give members practical space for documents and personal items. Sofas and soft seating support informal settings that are used for short meetings, breaks, and community activity. Other furniture, including reception products, stools, and accessories, helps operators create a consistent arrival and hospitality experience. These items can be less visible in procurement totals, but they shape how a member or visitor perceives a location. A reception setting, waiting area, and informal lounge also need to work with the surrounding desks and meeting rooms. Operators therefore select these products for service quality, visual consistency, and the need to maintain them under regular public use.
Booths and Office Dividers are projected to grow at a 9.4% CAGR through 2031, making them the fastest-growing product type in the co-working spaces furniture market. The category combines phone booths, meeting pods, and fabric-wrapped dividers that address privacy needs in shared offices. Framery reported that more than 27 million meetings were held in its smart pod spaces during FY2025. That use supports the shift from decorative screening toward products with a defined functional role. Framery also stated that all its products have GREENGUARD Gold certification, which shows how indoor-air and materials standards can enter procurement decisions. Providers that combine acoustic performance with quick installation are positioned to benefit as operators seek privacy without dedicating more floor area to enclosed rooms.

By Material: Metal Durability Anchors Structural Spend While Plastic Gains on Sustainability
Metal captured a 38.1% revenue share in 2025 because it supports the structural requirements of desks, seating frames, storage, and dividers. Shared workplaces place repeated demands on furniture, which favors materials that resist deformation and surface damage. Powder-coated steel is widely used where corrosion resistance and a durable finish are needed. Wood remained relevant in community areas and hospitality-led settings, where visual warmth and finish options can matter as much as structural performance. Glass, fabric, bamboo, and composite blends serve more specialized specifications and can support privacy, visual identity, or premium finish requirements. Material selection, therefore, reflects both the intensity of use and the type of space an operator is trying to create.
Plastic is forecast to grow at a 9.1% CAGR through 2031, supported by lightweight products, stackable formats, and a wider range of recycled-content and antimicrobial surfaces. Recycled PET felt can also be used in acoustic screens and privacy panels, which links material choices to the growing need for focused work settings. The 2026 workspace materials guide identified powder-coated steel, E1-grade wood, and recycled PET felt as widely used commercial workstation materials [4]. Operators also consider formaldehyde, volatile organic compounds, and sustainability criteria when serving multinational enterprise tenants. Plastic can help reduce the effort needed to move or store furniture, particularly in event spaces and small collaboration rooms. The material is therefore gaining share without removing the central role of metal in high-use structures. This balance gives the co-working spaces furniture market room for both durable frames and lighter movable products. The practical choice often differs by zone. A high-use desk bank may require metal support, while a meeting room or event setting may benefit from pieces that can be stacked or moved by staff. Suppliers that make these materials work together can offer more complete solutions to operators.
By Distribution Channel: B2B Dominance Masks a Fast-Rising Retail Layer
B2B and Direct accounted for 72.1% of revenue in 2025, giving this channel the largest share of the co-working spaces furniture market. Large contracts support standardized specifications, volume pricing, dedicated account management, and scheduled delivery across several sites. Enterprise operators and multi-location chains use these agreements to maintain a consistent member experience. Direct supply is especially useful when an operator needs the same desk, chair, storage, and meeting products across a growing estate. Echelon Workplaces described a large-scale co-working supply program that operated across 30 countries, which illustrates why direct procurement can suit standardized portfolios. The channel will remain important where operators need product continuity and dependable after-sales support. This preserves the role of long-term supplier relationships in the co-working spaces furniture market.
B2C and Retail Channels are forecast to grow at a 9.6% CAGR through 2031 as boutique operators, sub-lease providers, and hybrid workers make more purchases outside institutional supply chains. Online platforms can give smaller buyers access to a broader selection of contract-grade furniture without a large procurement department. Multi-brand stores, home centers, and specialty retailers serve lower-volume purchases, while local furniture and carpentry shops remain important where customization and proximity are valued. This channel is relevant to studios, satellite hubs, and new operators that have not yet built long-term supplier relationships. It also allows operators to make incremental purchases as membership changes rather than committing to a full estate-level order. The growing retail layer broadens access to the co-working spaces furniture market, but does not replace the scale advantages of direct contracts.
By Mobility and Configuration: Modular Systems Lead as Fixed Layouts Lose Ground
Modular and Reconfigurable Furniture held 43.1% of revenue in 2025 and is forecast to grow at a 9.0% CAGR through 2031. This dual position indicates that operators value systems that can adapt to changing attendance, group sizes, and room functions. Fixed furniture still has a role in private suites and team rooms where stable layouts support confidentiality and a consistent setting. Mobile furniture gives operators a lower-cost way to adjust activity zones for events, training, and informal work. Flat-Pack and Rapid-Assembly Furniture complements these systems where local installation capacity is limited, or launch timing is important. The co-working spaces furniture industry is therefore moving toward configurations that protect the useful life of a site as member requirements change.
Connected modular systems can bring desks, storage, collaboration elements, and soft boundaries into a common layout plan. This reduces the need to replace furniture when an open area must become a team zone or a focus area. The co-working spaces furniture market size for modular systems is supported by the operational cost of delayed fit-outs and the limited time available to complete a rollout. Gensler found that the ability to rearrange meeting-room furniture was among the design factors associated with effective workplaces for learning and collaboration. Quick changes can also help a location respond to short-term booking patterns without major building work. Suppliers that offer compatible additions across a product range can create more value than suppliers selling isolated items.
By Space Type: Satellite Hubs Emerge as the Growth-Stage Investment Category
Open Co-working Spaces held 32.6% of revenue in 2025, reflecting the continued use of hot desks, shared tables, and open-plan floors. Professional and Corporate Flexible Offices serve enterprise occupants who want a managed environment aligned with their own workplace standards. Private Offices and Team Suites need more defined furniture settings because users require continuity and confidentiality. Industry-Specific Co-working Spaces need customized layouts for the work of technology, creative, legal, or other specialist tenants. Community, Event, and Creative Spaces require movable products that can support programming as well as daily workspace use. Together, these settings create demand for a mix of high-density, private, and flexible furniture solutions.
Hybrid and Satellite Work Hubs are forecast to grow at a 9.6% CAGR through 2031, which makes them the fastest-growing space type. These locations support hub-and-spoke real estate strategies that bring workspace closer to residential areas. They require enterprise-grade ergonomic, acoustic, and technology-ready furniture, but are often in smaller spaces than a central office. This can lead to shorter refresh cycles because the furniture must support several activities in a limited floorplate. Suppliers with scalable product ranges and direct delivery capabilities can serve these smaller locations more efficiently. The growth of satellite hubs gives the co-working spaces furniture market another source of recurring demand beyond central business district sites.
By Capacity and Use Zone: Individual Zones Anchor Revenue While Small Collaboration Formats Drive Growth
Individual Work Zones held 44.6% of revenue in 2025 because focused desk work accounts for a large share of activity in co-working settings. These zones need task chairs, desks, lighting support, power access, storage, and visual separation. Quiet, Conversational, and Social Zones add value by providing informal areas for networking and breaks. Medium Collaboration Zones for 5 to 8 people and Large Collaboration Zones for more than 8 people serve project teams and formal meetings. These larger formats can produce higher booking value but are used less often than individual work settings. Operators must balance the income from high-density seating with the need to provide enough collaborative space for members.
Small Collaboration Zones for 2 to 4 people are projected to grow at a 9.3% CAGR through 2031. These formats fit small team discussions, pair work, quick client conversations, and short video calls. The average deal size in India’s flexible workspace sector reached 53 seats in 2025, supporting a greater need for small bookable group settings. Furniture for these spaces must often shift between private calls and face-to-face work on the same day. That requirement supports adaptable seating, integrated power, acoustic treatment, and simple-to-reset tables. It also favors modular systems over fixed conference furniture that cannot easily accommodate different activities.
By End User: Enterprise Scale Anchors Revenue as Mid-Market Operators Take Share
Large Enterprise-Focused Operators held 47.7% of revenue in 2025, making them the leading end-user group in the co-working spaces furniture market. These operators purchase at an estate scale, maintain enterprise-grade fit-out standards, and serve anchor tenants that expect consistent quality. Their order volumes influence the production planning of major furniture manufacturers. They also create replacement demand when a large portfolio is refreshed or expanded. Startup and Incubator Operators address early-stage companies with furniture choices that emphasize durability, cost control, and high turnover. The contrast between these buyer groups helps explain why suppliers offer both premium systems and simpler standardized products.
Small and Medium-Sized Operators are forecast to grow at an 8.8% CAGR through 2031. Boutique co-working brands, managed-office providers, and sub-lease operators are extending flexible workspaces into secondary cities and narrower customer groups. Their purchases may begin with lower volumes but can grow as brands add sites and seek consistent settings across locations. These operators are also more likely to need payment flexibility, faster delivery, and systems that can be moved to a new site. Direct manufacturer arrangements can become more attractive as their procurement needs become more standardized. This buyer group broadens the customer base for suppliers that can provide contract-grade products without the complexity of a large enterprise agreement. The purchasing process is often more practical than formal, with operators looking for clear specifications, reliable lead times, and products that can be added later. This places value on simple product planning and local service. It also makes durable, adaptable furniture relevant where a new location may change size or purpose soon after opening.
Geography Analysis
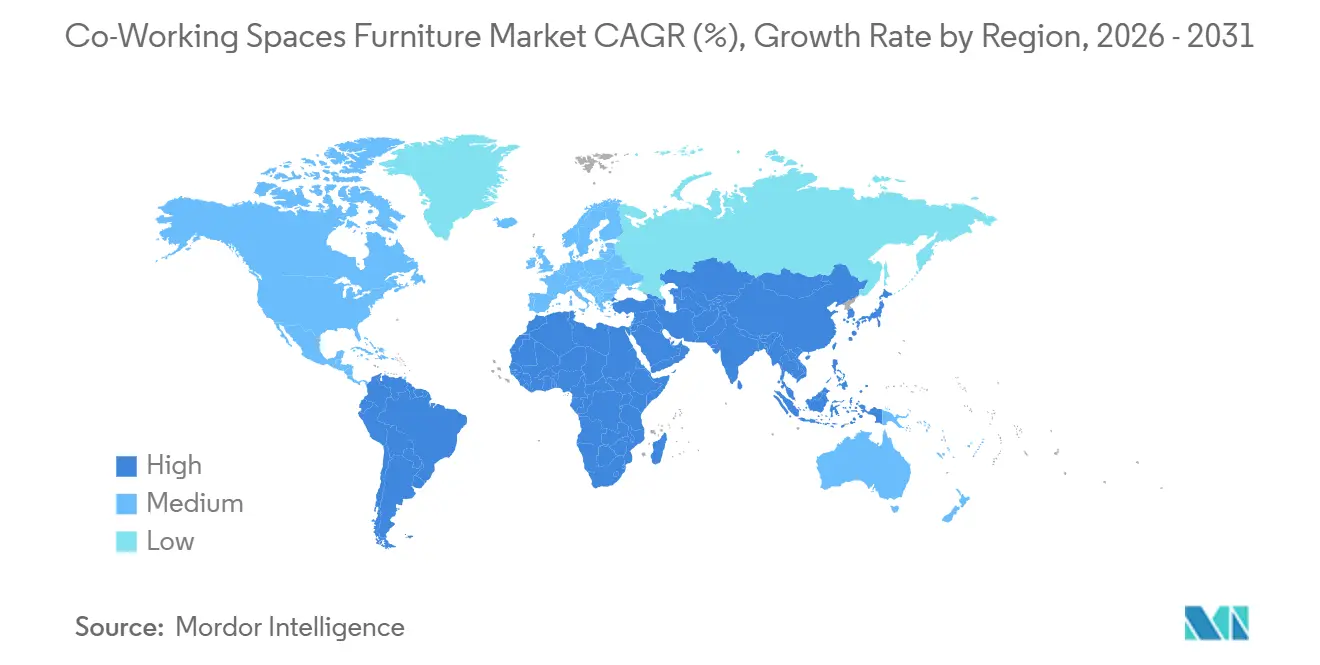
Asia-Pacific held a 36.8% revenue share in 2025 and is forecast to grow at a 9.6% CAGR through 2031. India is a major source of regional demand as flexible workspace capacity has expanded and operators have added new sites. India’s flexible workspace sector crossed 100 million square feet in 2025. It also notes that larger enterprise requirements have increased average deal sizes, which can increase demand for multi-unit furniture orders. China supports the regional base through innovation clusters and suburban science-park development. Japan, Australia, South Korea, Singapore, Vietnam, and other Southeast Asian markets add a mix of mature and developing demand.
Fursys identified Vietnam as a priority production and sales location during 2025, which indicates the importance of Southeast Asia to regional furniture suppliers. The company also opened a B2B showroom in Seoul in 2026 to let corporate buyers experience full-scale workplace layouts before ordering. North America remains important for enterprise contracts and workplace reconfiguration projects, while Europe has a substantial flexible-workspace base. European suppliers are expanding their presence and product portfolios to address demand for ergonomics, acoustic products, and sustainable materials. Nowy Styl opened its first Scandinavian showroom in Oslo in 2025, expanding its direct presence in the Nordic region. Its planned ORGATEC 2026 launches include acoustic solutions, swivel chairs, soft seating, and new material options.
South America, the Middle East and Africa, and Western Asia offer growth opportunities from a smaller revenue base. The demand in these areas is expanding urban co-working activity, free-zone frameworks, infrastructure investment, and the adoption of more flexible office strategies. Delivery, installation, and after-sales coverage can be harder to manage in some of these markets, which favors suppliers with local partners and service capability. Russia has a lower growth classification because of macroeconomic and geopolitical constraints on new openings and furniture investment. Oceania provides a steadier base that is centered on Australia’s established flexible workspace ecosystem. Across the co-working spaces furniture market, local manufacturing and dealer networks remain important because operators need products that meet local requirements and can be supported after installation. Local supply can reduce the difficulties created by shipping, installation scheduling, and access to replacement parts. It can also support specifications that match local climate, building practices, and workplace preferences. These factors matter when an operator is opening in several cities with different service conditions. The opportunity is not limited to selling furniture at launch, because ongoing maintenance and later layout changes can provide further supplier work.
Competitive Landscape
The co-working spaces furniture market includes global contract furniture brands, regional manufacturers, acoustic-product specialists, and providers of furniture-as-a-service. Competition centers on design range, dealer coverage, material credentials, lead time, and the ability to support large and small operators. MillerKnoll launched Knoll Dividends Skyline in January 2026 as a workplace system that combines workstations, screens, lounge elements, and cubbies. In May 2026, the company introduced the Konzert private-office system through certified dealers. Herman Miller also updated the Aeron chair in June 2026 with new colors, expanded sizing, and sustainability changes. These moves show how leading suppliers are adapting core products for more flexible and inclusive workplace settings. They also show how product development is increasingly aimed at several types of space within the same property. An open desk area, an enclosed room, a quiet work setting, and a social lounge can require different products, but buyers often prefer a coordinated range. A broad portfolio can therefore help a supplier take a larger role in a project while allowing the operator to maintain a consistent visual standard.
HNI announced the acquisition of Steelcase for USD 2.2 billion in August 2025. The deal increases the scale of the combined company’s product range and dealer network for enterprise procurement. Haworth has also built a premium offer through its Haworth Lifestyle portfolio, which includes Italian design brands and serves hospitality-led workplace projects. Framery competes through acoustic enclosures, a category that has become more important as operators address noise and privacy. Framery’s FY2025 revenue growth and Asia-Pacific expansion point to strong demand for focused work and meeting products. No single supplier has established a clear position in standardized fit-out kits for smaller satellite hubs, leaving room for specialist providers. This area requires a careful balance between cost, quality, speed, and the ability to add products later. Operators in smaller cities may want the same level of performance as a flagship site, but cannot always pay for a fully customized solution. Suppliers that can provide a clear package for desks, chairs, storage, acoustic products, and collaboration zones may have an advantage in this part of the co-working spaces furniture market.
Regional firms compete through local manufacturing, pricing, and a closer understanding of domestic buyer requirements. Godrej Interio reported INR 4,000 crore, equivalent to USD 480 million, in FY2026 revenue and targets 25% growth in FY2027, alongside investment in digital infrastructure, omnichannel sales, and ergonomic products. NARBUTAS plans new collections in 2026 and has an investment agreement for a second factory in Lithuania, with preliminary construction expected in Q1 2027. Fursys launched an office subscription service in 2026 that combines rental, operation, maintenance, retrieval, and recycling. These strategies show that service delivery, local capacity, and recurring revenue models are becoming as relevant as product design in the co-working spaces furniture market.
Co-Working Spaces Furniture Industry Leaders
-
Steelcase Inc.
-
MillerKnoll, Inc.
-
Haworth Inc.
-
HNI Corporation
-
Okamura Corporation
- *Disclaimer: Major Players sorted in no particular order
Recent Industry Developments
- September 2026: Nowy Styl and Kusch+Co confirm 20 product premieres at ORGATEC 2026, including acoustic solutions, swivel chairs, soft seating, and new fabric ranges.
- June 2026: Herman Miller launched an updated Aeron Chair with new colorways, sustainability advancements, and expanded sizing options.
- May 2026: Knoll debuted the Konzert private office system at Clerkenwell Design Week in London.
- May 2026: Fursys announced an office subscription service that integrates rental, operation, maintenance, retrieval, and recycling.
Global Co-Working Spaces Furniture Market Report Scope
| Chairs | Employee Chairs |
| Meeting Chairs | |
| Guest Chairs | |
| Tables | Conference Tables |
| Desks | |
| Other Tables | |
| Storage Units | Filing Cabinets |
| Bookcases and Shelving | |
| Sofas and Soft Seating | |
| Booths and Office Dividers | |
| Other Office Furniture (Stools, Reception Area Furniture, and Accessories) |
| Wood |
| Metal |
| Plastic |
| Other Materials (Glass, Fabric, Bamboo, and Others) |
| B2B and Direct from the Manufacturers | |
| B2C and Retail Channels | Multi-Brand Stores |
| Home Centers | |
| Hypermarkets and Supermarkets | |
| Specialty Furniture Stores | |
| Online | |
| Other Distribution Channels (Department Stores, Warehouse Clubs and Independent Local Furniture and Carpentry Shops or Studios) |
| Fixed Furniture |
| Mobile Furniture |
| Modular and Reconfigurable Furniture |
| Flat-Pack and Rapid-Assembly Furniture |
| Open Co-working Spaces |
| Professional and Corporate Flexible Offices |
| Private Offices and Team Suites |
| Industry-Specific Co-working Spaces |
| Hybrid and Satellite Work Hubs |
| Community, Event and Creative Spaces |
| Individual Work Zones |
| Small Collaboration Zones, 2-4 People |
| Medium Collaboration Zones, 5-8 People |
| Large Collaboration Zones, More Than 8 People |
| Quiet, Conversational and Social Zones |
| Large Enterprise-Focused Operators |
| Small and Medium-Sized Operators |
| Startup and Incubator Operators |
| North America | Canada |
| United States | |
| Mexico | |
| South America | Brazil |
| Peru | |
| Chile | |
| Argentina | |
| Rest of South America | |
| Europe | United Kingdom |
| Germany | |
| France | |
| Spain | |
| Italy | |
| BENELUX (Belgium, Netherlands, and Luxembourg) | |
| NORDICS (Denmark, Finland, Iceland, Norway, and Sweden) | |
| Rest of Europe | |
| Asia-Pacific | India |
| China | |
| Japan | |
| Australia | |
| South Korea | |
| South East Asia (Singapore, Malaysia, Thailand, Indonesia, Vietnam, and the Philippines) | |
| Rest of Asia-Pacific | |
| Middle East and Africa | United Arab Emirates |
| Saudi Arabia | |
| South Africa | |
| Nigeria | |
| Rest of the Middle East and Africa |
| By Product Type | Chairs | Employee Chairs |
| Meeting Chairs | ||
| Guest Chairs | ||
| Tables | Conference Tables | |
| Desks | ||
| Other Tables | ||
| Storage Units | Filing Cabinets | |
| Bookcases and Shelving | ||
| Sofas and Soft Seating | ||
| Booths and Office Dividers | ||
| Other Office Furniture (Stools, Reception Area Furniture, and Accessories) | ||
| By Material | Wood | |
| Metal | ||
| Plastic | ||
| Other Materials (Glass, Fabric, Bamboo, and Others) | ||
| By Distribution Channel | B2B and Direct from the Manufacturers | |
| B2C and Retail Channels | Multi-Brand Stores | |
| Home Centers | ||
| Hypermarkets and Supermarkets | ||
| Specialty Furniture Stores | ||
| Online | ||
| Other Distribution Channels (Department Stores, Warehouse Clubs and Independent Local Furniture and Carpentry Shops or Studios) | ||
| By Mobility and Configuration | Fixed Furniture | |
| Mobile Furniture | ||
| Modular and Reconfigurable Furniture | ||
| Flat-Pack and Rapid-Assembly Furniture | ||
| By Space Type | Open Co-working Spaces | |
| Professional and Corporate Flexible Offices | ||
| Private Offices and Team Suites | ||
| Industry-Specific Co-working Spaces | ||
| Hybrid and Satellite Work Hubs | ||
| Community, Event and Creative Spaces | ||
| By Capacity and Use Zone | Individual Work Zones | |
| Small Collaboration Zones, 2-4 People | ||
| Medium Collaboration Zones, 5-8 People | ||
| Large Collaboration Zones, More Than 8 People | ||
| Quiet, Conversational and Social Zones | ||
| By End User | Large Enterprise-Focused Operators | |
| Small and Medium-Sized Operators | ||
| Startup and Incubator Operators | ||
| By Geography | North America | Canada |
| United States | ||
| Mexico | ||
| South America | Brazil | |
| Peru | ||
| Chile | ||
| Argentina | ||
| Rest of South America | ||
| Europe | United Kingdom | |
| Germany | ||
| France | ||
| Spain | ||
| Italy | ||
| BENELUX (Belgium, Netherlands, and Luxembourg) | ||
| NORDICS (Denmark, Finland, Iceland, Norway, and Sweden) | ||
| Rest of Europe | ||
| Asia-Pacific | India | |
| China | ||
| Japan | ||
| Australia | ||
| South Korea | ||
| South East Asia (Singapore, Malaysia, Thailand, Indonesia, Vietnam, and the Philippines) | ||
| Rest of Asia-Pacific | ||
| Middle East and Africa | United Arab Emirates | |
| Saudi Arabia | ||
| South Africa | ||
| Nigeria | ||
| Rest of the Middle East and Africa | ||
Key Questions Answered in the Report
What is driving demand for co-working spaces furniture?
Hybrid work, flexible workspace openings, regular fit-out refreshes, and demand for acoustic privacy products are supporting demand.
What is the forecast growth rate through 2031?
The sector is forecast to grow at an 8.1% CAGR from 2026 to 2031, reaching USD 10.3 billion.
Which product category is growing fastest?
Booths and Office Dividers are forecast to grow at a 9.4% CAGR through 2031 as operators add more settings for focused work and private calls.
Why is modular furniture important to co-working operators?
Modular and Reconfigurable Furniture held 43.1% of revenue in 2025 and allows operators to adapt layouts as attendance and room use change.
Which region leads global demand?
Asia-Pacific held 36.8% of revenue in 2025 and is forecast to expand at a 9.6% CAGR through 2031.
How do smaller operators affect supplier opportunities?
Small and Medium-Sized Operators are forecast to grow at an 8.8% CAGR through 2031, increasing demand for scalable products, faster delivery, and flexible procurement.