
Cloud Music Services Market Size and Share
Market Overview
| Study Period | 2020 - 2031 |
|---|---|
| Market Size (2026) | USD 18.18 Billion |
| Market Size (2031) | USD 30.24 Billion |
| Growth Rate (2026 - 2031) | 10.71 % |
| Fastest Growing Market | Asia-Pacific |
| Largest Market | North America |
| Market Concentration | Medium |
Major Players *Disclaimer: Major Players sorted in no particular order Image © Mordor Intelligence. Reuse requires attribution under CC BY 4.0. | |
Cloud Music Services Market Analysis by Mordor Intelligence
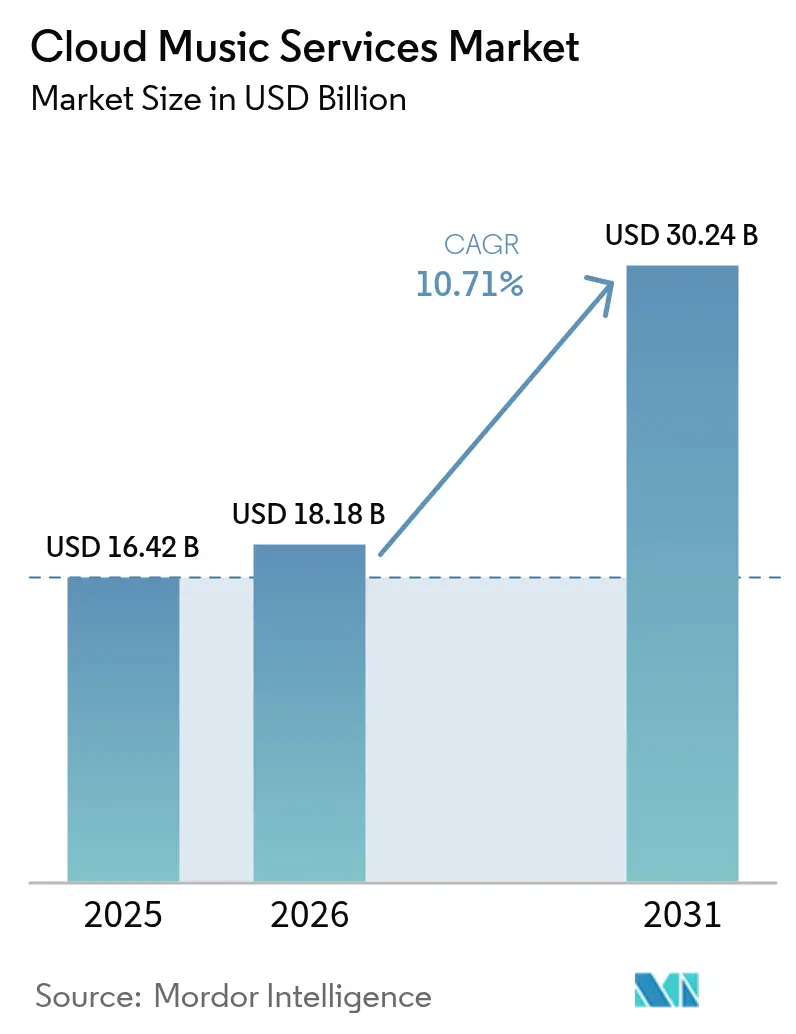
The cloud music services market size is expected to grow from USD 16.42 billion in 2025 to USD 18.18 billion in 2026 and is forecast to reach USD 30.24 billion by 2031 at 10.71% CAGR over 2026-2031. Continuous smartphone adoption, lower data tariffs, and artificial-intelligence personalization keep listening sessions longer, reduce churn, and draw new users into premium tiers. Superfan monetization and telco bundles are widening the revenue base beyond advertising and basic subscriptions, while live event streaming and podcast expansion diversify engagement touchpoints. In parallel, regulatory mandates in North America and Europe increase compliance costs that favor scale leaders; yet, the same rules also amplify catalog transparency, which benefits artists. Profitability remains squeezed because rights holders capture about 70% of platform revenue, forcing operators to pursue price increases, margin-rich premium tiers, and B2B licensing for commercial locations.
Key Report Takeaways
- By service type, on-demand streaming led with 83.01% revenue share in 2025, while live streaming is forecast to expand at a 12.96% CAGR through 2031.
- By revenue model, subscription tiers held 78.05% share in 2025, whereas freemium models are projected to grow at a 12.21% CAGR to 2031.
- By platform, smartphones accounted for 68.82% of 2025 revenue; however, automotive infotainment systems are projected to post the fastest growth rate of 14.62% CAGR through 2031.
- By end user, individual accounts captured an 88.05% share in 2025, while commercial premises are expected to advance at an 11.54% CAGR.
- By content type, audio-only music accounted for a 61.75% share in 2025, and podcasts are projected to grow at a 16.78% CAGR through 2031.
- By geography, North America held a 41.92% share in 2025, and the Asia Pacific is anticipated to grow at an 11.52% CAGR through 2031.
Note: Market size and forecast figures in this report are generated using Mordor Intelligence’s proprietary estimation framework, updated with the latest available data and insights as of 2026.
Market Trends and Insights
Drivers Impact Analysis of Cloud Music Services Market*
| Driver | (~) % Impact on CAGR Forecast | Geographic Relevance | Impact Timeline |
|---|---|---|---|
| Rising smartphone penetration and affordable data | +2.8% | Asia Pacific, Middle East and Africa, Latin America | Medium term (2-4 years) |
| Paid streaming price increases are boosting ARPU | +1.9% | North America and Europe | Short term (≤ 2 years) |
| Emergence of superfan monetization tiers | +1.5% | North America and Europe | Medium term (2-4 years) |
| AI-driven personalization enhances engagement | +2.2% | Global with early lead in North America, Europe, Asia Pacific | Long term (≥ 4 years) |
| Cloud-native creator tools expanding supply | +1.4% | Global | Long term (≥ 4 years) |
| Regional telco-bundle partnerships | +2.1% | Asia Pacific, Latin America, the Middle East, and Africa | Medium term (2-4 years) |
| Source: Mordor Intelligence | |||
Rising Smartphone Penetration and Affordable Data
India added approximately 50 million smartphone users in 2024, and sub-Saharan Africa recorded double-digit growth in mobile broadband lines. Meanwhile, data tariffs fell by 15% to 20% in India, Indonesia, and Nigeria.[1]Goldman Sachs Research, “Music in the Air Stairway to the Metaverse,” goldmansachs.com Ubiquitous connectivity has shifted millions from radio or sideloaded files to cloud catalogs, accelerating the adoption of the cloud music services market. Telcos, from Reliance Jio to Claro, embed streaming into prepaid bundles and reduce acquisition costs for platforms. Lower data pricing creates a virtuous circle where streaming usage justifies further network upgrades, which in turn support richer audio and video formats. Platforms that secure carrier partnerships win shelf space on devices, simplify billing, and unlock the next billion listeners.
Paid Streaming Price Increases Boosting ARPU
Spotify increased its US individual plan from USD 9.99 to USD 10.99 in 2024, and Apple Music followed a similar move across Europe.[2]Reuters Staff, “Spotify Raises Prices Again as Streaming Wars Intensify,” reuters.com A one-dollar rise across Spotify’s 226 million premium base equates to roughly USD 2.7 billion in extra annual revenue. Early churn only ticked up one to two points because playlists, social features, and device integration create switching costs. Nonetheless, consumer surveys flag resistance at monthly prices above USD 15, so platforms are layering premium “superfan” tiers rather than pushing the headline rate too quickly. The price-led ARPU lift shores margins in the cloud music services market, even as royalty costs climb.
Emergence of Superfan Monetization Tiers
Universal Music Group sized the superfan opportunity at USD 4.5 billion, covering early ticket access, merchandise drops, and virtual meet-and-greets.[3]Financial Times Reporters, “Superfan Economy How Music Platforms Are Monetizing Engagement,” ft.com Spotify introduced Supremium in 2024, priced roughly 40% above standard plans, and Apple Music Artist Edition followed in 2025 at USD 16.99. Data shows that the most engaged 10% of users can drive up to 40% of total artist revenue when merch and events are bundled. Premium tiers expand margin without alienating price-sensitive listeners who stay on free or basic plans. Careful tier design is vital, since too many options can confuse customers and erode brand clarity in the cloud music services market.
AI-Driven Personalization Enhancing Engagement
Spotify’s AI DJ, launched globally in 2024, narrates track transitions and adapts in real time to user feedback. Deezer’s text-to-playlist tool lets subscribers request mood-based mixes via natural language. A Journal of Marketing Research study found that personalized recommendations increase engagement by 25% to 30% compared to generic playlists.[4]AMA Journal Editors, “The Impact of Personalized Recommendations on User Engagement in Music Streaming,” journals.ama.org Longer sessions increase ad inventory for freemium users and reinforce retention for paying members, directly supporting revenue growth in the cloud music services market. Yet algorithmic echo chambers can narrow discovery, so platforms now balance machine suggestions with editorial curation to widen genre exposure.
Restraints Impact Analysis of Cloud Music Services Market*
| Restraint | (~) % Impact on CAGR Forecast | Geographic Relevance | Impact Timeline |
|---|---|---|---|
| Royalty cost pressure on profitability | -1.8% | Global with higher weight in mature markets | Short term (≤ 2 years) |
| Intense competition and subscription churn | -1.3% | North America and Europe | Medium term (2-4 years) |
| Piracy and stream-ripping services | -0.9% | Emerging markets | Long term (≥ 4 years) |
| Streaming fraud and fake-stream manipulation | -0.7% | Markets with weak enforcement | Medium term (2-4 years) |
| Source: Mordor Intelligence | |||
Royalty Cost Pressure on Platform Profitability
Music licenses absorb 65% to 75% of streaming revenue. Spotify’s 2024 filings showed royalties accounting for nearly 70% of revenue, resulting in single-digit operating margins. Mid-tier players such as Deezer remain loss-making despite surpassing 10 million subscribers. Since labels can withdraw catalogs, platforms have little leverage to lower rates, pushing them to diversify into owned podcasts or direct artist deals. High payout ratios limit capital for product innovation and slow profitability improvement in the cloud music services market.
Intense Competition and Subscription Churn
Monthly churn rates typically range from 3% to 5%, necessitating ongoing user acquisition to maintain momentum. Apple, Amazon, and Google can subsidize music through hardware or commerce profits, putting volume pressure on independent platforms. Amazon bundles Music Unlimited into Prime, and Google pairs YouTube Music with ad-free video, eroding the differentiation between the two services. Without cross-subsidy economics, challengers focus on niche content or a regional scale; yet, even those gains are vulnerable to larger rivals entering with aggressive pricing. Sustained head-to-head rivalry caps pricing power and compresses margins across the cloud music services market.
*Our forecasts treat driver/restraint impacts as directional, not additive. The impact forecasts reflect baseline growth, mix effects, and variable interactions.
Cloud Music Services Market Segment Analysis
By Service Type - Live Streaming Bridges Digital and Physical Experiences
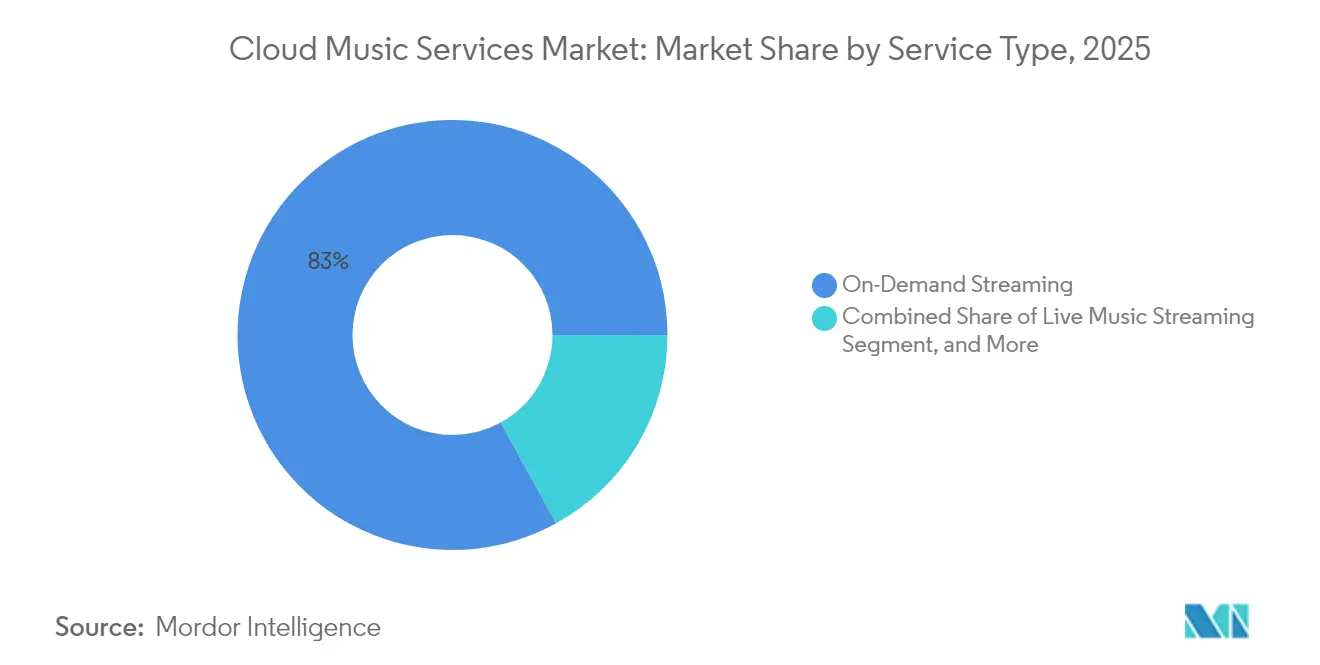
On-demand streaming accounted for 83.01% of revenue in 2025, underscoring its dominance in the cloud music services market. Live music streaming is forecast to grow at a 12.96% CAGR as concert broadcasts, backstage Q&As, and virtual festivals become staples on major platforms. Amazon Music Live taps prime-time audiences during Thursday Night Football, while Apple Music streams intimate shows that spark social buzz.
Live content introduces scarcity and appointment viewing, deepening fan loyalty and driving incremental monetization such as virtual tickets. Locker-style cloud storage remains relevant in bandwidth-constrained areas and among audiophiles storing lossless files, but falling storage costs and the advent of 5G are reducing its mass appeal. The segment mix reflects a broader shift in the cloud music services market, where experiential features complement catalog access to sustain engagement and raise switching costs.



By Revenue Model - Freemium Funnels Drive Conversion at Scale
Subscription plans accounted for 78.05% of 2025 revenue, solidifying their role as the economic engine of the cloud music services market. Freemium tiers are projected to expand at a rate of 12.21% as platforms fine-tune ad loads, skip limits, and trial offers to transition free listeners into paid tiers. Spotify’s free base of 348 million monthly users feeds a steady upgrade pipeline.
Ad-supported users deliver USD 5 to USD 7 per year, compared with about USD 120 for premium subscribers, yet they lower acquisition costs and widen global reach. Conversion efficiency relies on predictive analytics that identify high-propensity cohorts for discounted trials. Pure ad-only models struggle as on-demand access becomes a table-stakes requirement. Blended revenue streams, therefore, remain central to sustaining growth in the cloud music services market.
By Platform - Automotive Integration Redefines In-Car Listening
Smartphones contributed 68.82% of 2025 revenue thanks to ubiquitous ownership and seamless device handoff. Automotive infotainment systems are poised for a 14.62% CAGR as General Motors phases out CarPlay in favor of embedded Android Automotive, featuring native Spotify and YouTube Music clients.
In-car streaming gives automakers revenue participation and data control, but fragmentation complicates developer support. Smart speakers and wearables are expanding listening contexts in homes and gyms, while PCs are declining as mobile sessions become increasingly dominant. Platform diversification enhances stickiness for the cloud music services market, as users value uninterrupted access across all screens and scenarios.
By End User - Commercial Premises Unlock B2B Revenue Streams
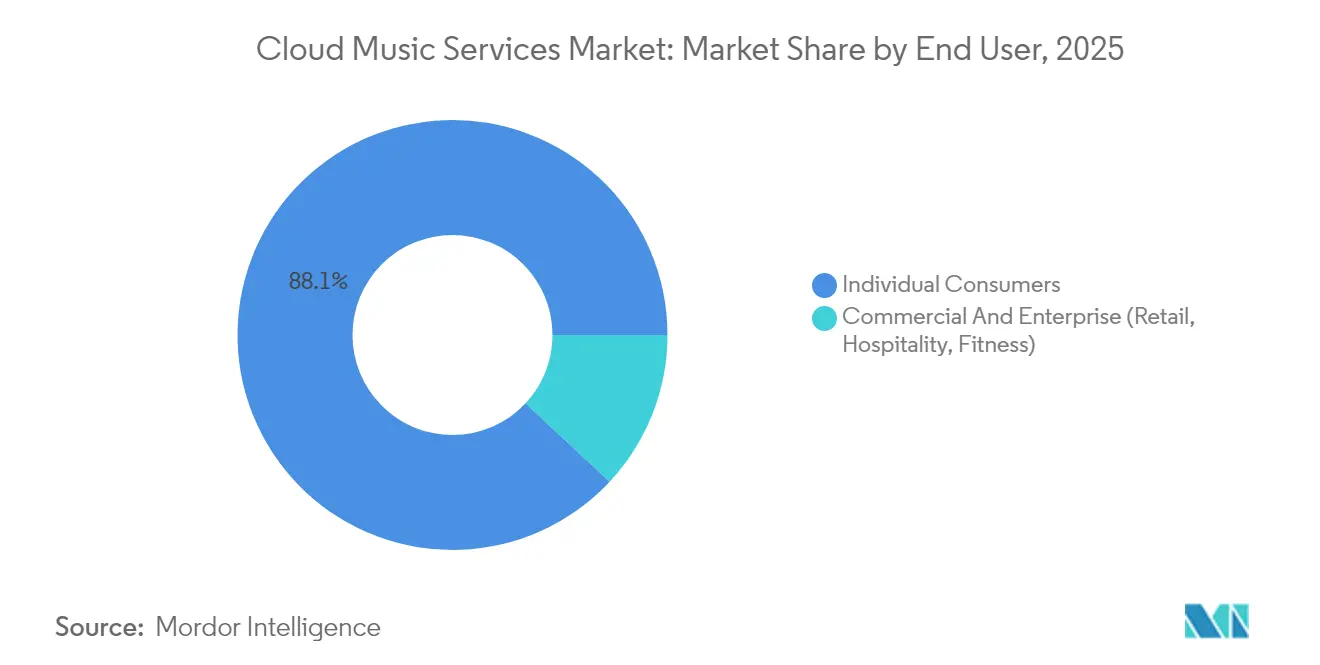
Individual accounts captured 88.05% of 2025 revenue; however, commercial locations, such as retail stores, hotels, and gyms, are forecast to expand at a 11.54% CAGR. Soundtrack Your Brand’s deal with Accor covers 5,700 hotels, replacing static playlists with dynamic mood-based curation.
Commercial subscriptions cost USD 30 to USD 50 per location per month, reflecting legal certainty and business-grade features. Higher unit pricing and low churn give platforms diversification beyond consumer cycles, supporting overall revenue resilience in the cloud music services industry.
By Content Type - Podcasts and Video Broaden Engagement Horizons
Audio-only music retained a 61.75% share in 2025; however, podcasts are projected to rise by 16.78% annually, leading to longer listening sessions and lower content costs. Spotify reported a 39% jump in video podcast hours in 2024, challenging YouTube’s dominance in long-form audio-visual content.
Podcasts carry direct or owned rights, easing royalty burden and attracting advertisers targeting niche audiences. Video layers visual storytelling and incremental ad slots. The growing mix of spoken word and video enriches the cloud music services market, moving platforms beyond pure music toward holistic audio entertainment hubs.
Geography Analysis
North America Cloud Music Services Market
North America controlled 41.92% of 2025 revenue, reflecting high ARPU and near-saturation subscription levels in the cloud music services market. Growth now hinges on selective price increases, account sharing crackdowns, and the uptake of superfan tiers. The region also serves as a test bed for new features, including AI DJs and high-resolution audio, before they are rolled out globally. State privacy laws and pending federal algorithm transparency proposals increase compliance costs that smaller challengers struggle to absorb, thereby reinforcing the incumbent's advantage.
APAC Cloud Music Services Market
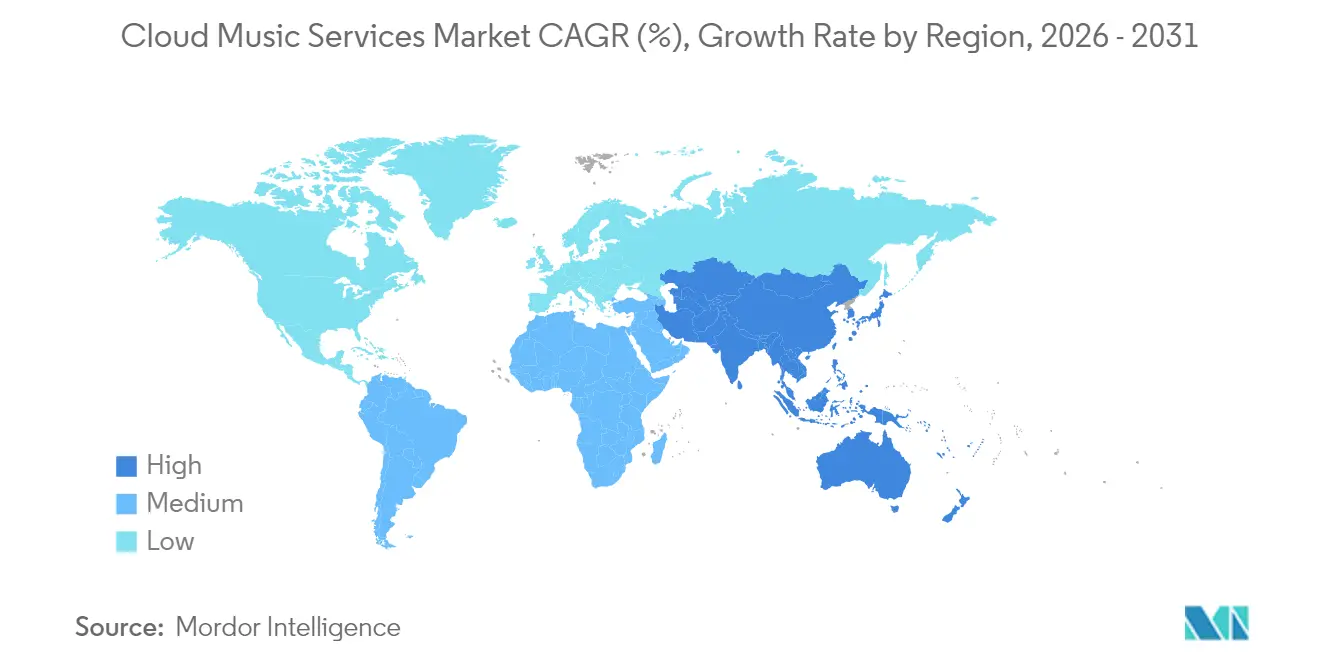
Asia Pacific is projected to grow at 11.52% through 2031, driven by subscriber gains in China, India, and Southeast Asia. Tencent Music reached 119.8 million paying users in Q3 2024 and generated revenue of CNY 7.02 billion (USD 0.99 billion). NetEase Cloud Music achieved 49 million payers and CNY 2.5 billion (USD 0.35 billion) revenue in the same period. Local ecosystem integration and telco bundles underpin rapid expansion. In India, JioSaavn leverages Reliance Jio distribution to exceed 100 million users, demonstrating the power of bundled data plans.
EMEA and South America Cloud Music Services Market
Europe, South America, the Middle East, and Africa collectively account for approximately 45.98% of global revenue. Europe exhibits high penetration, but faces heavier regulation under the Digital Services Act and Copyright Directive, resulting in increased operating overheads. South America benefits from falling handset costs yet faces currency volatility that complicates pricing. The Middle East and Africa showcase regional platforms like Anghami and Boomplay, which thrive through localized catalogs and handset pre-installation. Diverse regional dynamics make localization and flexible payment options decisive for success in the cloud music services market.

Regulatory Landscape
Compliance requirements for cloud music services continue to tighten around royalties, platform accountability, and transparency. In the United States, the Copyright Royalty Judges published a final rule in March 2026 covering rates and terms for digital performances by new subscription services for 2026-2030, which establishes a multi-year statutory framework that shapes how new or niche subscription offerings structure pricing and bundles.
In Europe, implementation of the Digital Services Act (DSA) adds operational obligations for online services used by EU citizens. The European Parliament has also called for greater transparency around streaming platform algorithms and improved visibility and accessibility of European works (2024 resolution). In the United Kingdom, the government-backed industry Code of Good Practice on Transparency in Music Streaming (announced January 2024) reinforces policy focus on licensing clarity and royalty reporting, raising the bar for metadata quality, reporting systems, and audit-ready processes among scaled platforms.
Value Chain Analysis
The cloud music services value chain begins with creators (artists and songwriters) and moves through rights owners and administrators, including record labels, music publishers, and collective management organizations (CMOs). Music then enters digital distribution via aggregators and direct licensing, and is delivered through streaming platforms that manage cloud hosting, recommendation and curation, consumer billing, ad tech for freemium tiers, and multi-device playback. Rights, metadata integrity, and fraud mitigation are key control points, since payout allocation depends on accurate usage reporting and compliant licensing.
Platforms increasingly function as value-chain orchestrators by combining catalog licensing with engagement layers such as personalization, live content, and creator tools. Recent multiyear label-platform agreements reflect this shift: Universal Music Group expanded its relationship with Amazon Music (December 2024), addressing product opportunities and issues such as AI-generated content and fraud, and in January 2025 announced a multiyear agreement with Spotify centered on Streaming 2.0 and artist-centric monetization. China-based platform models show deeper vertical integration, with Tencent Music and NetEase Cloud Music combining distribution with artist partnerships and content initiatives, reinforcing platform-owned data and discovery as gatekeeping functions.
Competitive Landscape
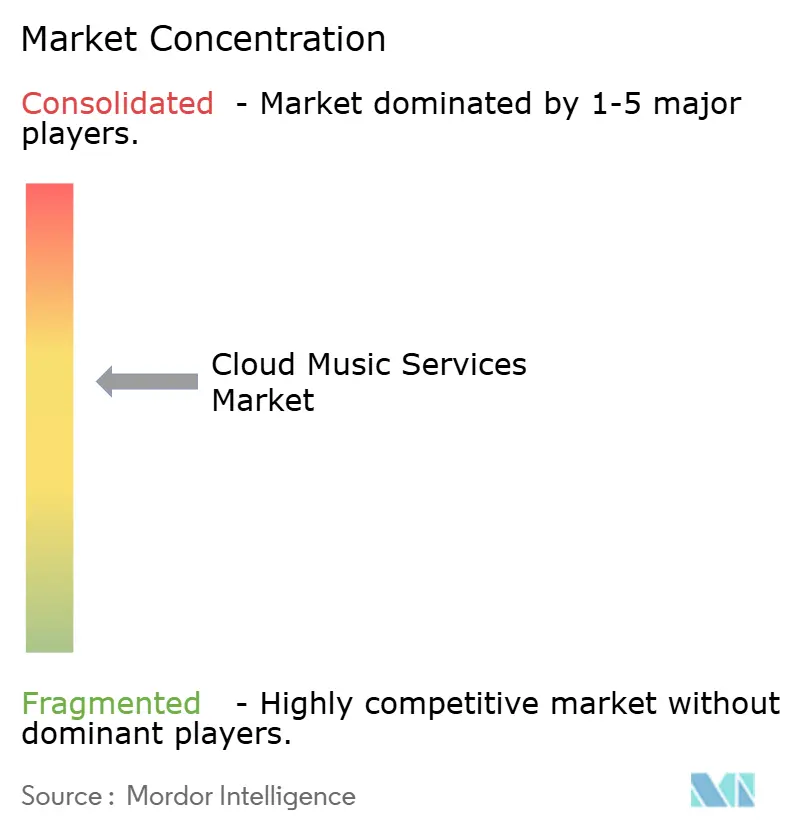
The top five platforms, Spotify, Apple Music, Amazon Music, YouTube Music, and Tencent Music, account for a significant share of global subscriptions, resulting in a moderately concentrated profile for the cloud music services market. Each leader leverages ecosystem advantages: Apple bundles services with hardware, Amazon ties music to Prime and Alexa, YouTube wields video discovery, and Tencent integrates social features. Exclusive podcasts, live-stream deals, and merchandise shops enhance differentiation and raise the barriers to switching.
White-space opportunities lie in B2B music for commercial venues, superfan monetization, and emerging markets where payment infrastructure remains underdeveloped. Soundtrack Your Brand, Anghami, and Boomplay illustrate the value of region-specific content and telco distribution. Generative AI radio and blockchain royalty platforms represent nascent threats but face scalability and compliance challenges.
Sustaining edge demands continual investment in personalization, creator tools, and adjacent content formats such as video podcasts and live events. Margins will favor platforms that balance scale with diversified revenue streams, as royalty payments remain indexed to usage and limit operating leverage in the cloud music services industry.
Cloud Music Services Industry Leaders
Spotify AB
Apple Inc.
Amazon.com Inc.
Google Llc
Youtube Llc
- *Disclaimer: Major Players sorted in no particular order
Cloud Music Services Market Companies Covered in this Report
- Spotify Ab
- Apple Inc.
- Amazon.com Inc.
- Google Llc
- Youtube Llc
- Tencent Music Entertainment Group
- Netease Cloud Music Co. Ltd.
- Deezer Sa
- Pandora Media Llc
- Sirius Xm Holdings Inc.
- Sound Cloud Global Limited & Co. Kg
- Tidal Music As
- Anghami Plc
- Gaana Entertainment Pvt. Ltd.
- Jiosaavn Media Pvt. Ltd.
- Kkbox Inc.
- Boomplay Digital Services Ltd.
- Qobuz Usa Llc
- Iheartradio Inc.
- Soundmachine Llc
- Soundtrack Your Brand Sweden Ab
- Yandex Llc
- Di.fm Llc
- Mixcloud Ltd.
- Resso Music Technology Pte. Ltd.

Market Opportunities and Future Outlook
Superfan monetization and live-event adjacency are widening the addressable revenue base beyond standard subscriptions and advertising. Spotify framed this direction in May 2026 through "Reserved by Spotify" with Live Nation, linking streaming behavior to ticket access for Premium subscribers. It also introduced licensed fan-made covers and remixes as a paid add-on built with Universal Music Group. Together, these moves highlight whitespace for fan-first commerce, including tickets, merch, and experiences, integrated directly into cloud music services, where platforms can monetize high-intent users without relying only on headline price increases.
Additional product opportunities are forming around AI interfaces that simplify discovery and support engagement across large catalogs and mixed media (music, podcasts, video). In July 2026, Spotify introduced a conversational, text or voice interface in beta for Premium users in the U.S., Ireland, and Sweden, shifting navigation away from playlist-first discovery toward assistant-led experiences that can support upsell paths and differentiated personalization. The broader creator supply chain also shows continued investment, with CVC Capital Partners signing a definitive agreement for a majority investment in DistroKid in July 2026, which supports distributor-led onboarding of independent catalogs and faster, lower-friction content ingestion for platforms.
Recent Industry Developments in Cloud Music Services Market
- July 2026: CVC Capital Partners signed a definitive agreement to make a majority investment in DistroKid. The deal strengthens an important independent-artist distribution channel, supporting faster catalog onboarding and wider global reach for music released via self-serve distribution models.
- May 2026: Spotify and Universal Music Group announced licensing agreements for fan-made covers and remixes, alongside plans for a paid add-on tool for Premium users that enables creation from participating artist catalogs. The move formalizes monetization for remix culture inside licensed frameworks, adding a new engagement-driven revenue lever while addressing rights-holder requirements.
- July 2024: Apple Music introduced the Artist Edition superfan tier priced at USD 16.99 per month. The tier broadened premium segmentation by packaging higher willingness-to-pay features, reinforcing the market shift toward margin-richer plans rather than relying only on standard subscription pricing.


Cloud Music Services Market Report Scope and Research Methodology
Market Definition and Coverage
For this study, the market covers paid and ad-supported cloud music services where music (and related audio or video content) is delivered through the internet and accessed through apps, browsers, and connected devices.
Scope exclusions: We exclude hardware sales (phones, speakers, and car head units) and standalone telecom data plans, even when these are bundled in promotional offers.
Segments Covered in This Report
- By Service Type
- On-Demand Streaming
- Cloud Music Storage And Locker
- Live Music Streaming
- By Revenue Model
- Subscription
- Ad-Supported
- Hybrid / Freemium
- By Platform
- Smartphones
- Smart Speakers And Wearables
- Pcs And Laptops
- Automotive Infotainment
- By End User
- Individual Consumers
- Commercial And Enterprise (Retail, Hospitality, Fitness)
- By Content Type
- Audio-Only Music
- Podcasts And Audio Shows
- Video Music Content
- By Geography
- North America
- United States
- Canada
- Mexico
- South America
- Brazil
- Argentina
- Rest of South America
- Europe
- United Kingdom
- Germany
- France
- Italy
- Spain
- Russia
- Rest of Europe
- Asia Pacific
- China
- Japan
- India
- South Korea
- Australia
- Rest of Asia Pacific
- Middle East
- Saudi Arabia
- United Arab Emirates
- Turkey
- Rest of Middle East
- Africa
- South Africa
- Nigeria
- Egypt
- Rest of Africa
- North America
Data Sources, Market Sizing, and Validation
Desk Research
We start with public, repeatable datapoints that explain demand and monetization for digital audio services. Helpful sources include communications regulator releases (such as the FCC and Ofcom), international statistics (such as ITU and OECD), and macro indicators from World Bank data that show connectivity, device access, and spending capacity.
To ground the revenue math, we also review company filings, investor presentations, and earnings call transcripts to capture subscription mix, ad load trends, and geographic exposure. In parallel, we use reputable press, developer documentation from major app ecosystems, and patent databases to understand product shifts such as offline mode, personalization, and codec upgrades. For faster cross-checks, analyst access to paid company financials and news intelligence databases is used to standardize currencies, timing, and reported line items. These examples are illustrative, and many other public and paid sources were reviewed for data collection, validation, and research clarification.
Primary Interviews and Surveys
Primary interviews and short surveys were used to pressure-test pricing, churn direction, ad monetization, and the realistic pace of new user adds across key regions. We spoke with a mix of product, partnerships, marketing, and operations leaders from service providers, ad ecosystem participants, and commercial users, then refined assumptions where respondent input showed consistent patterns.
Distribution of primary research fieldwork respondents
| Company type | Respondent position | Region |
|---|---|---|
| Top tier: 35% | CXOs: 15% | APAC: 44% |
| Mid tier: 49% | Functional/Unit leaders: 29% | EMEA: 30% |
| Smaller Players: 16% | Managers: 56% | Americas: 26% |
Market-Sizing & Forecasting
Sizing is built from a top-down demand pool view, where internet users, smartphone penetration, and paid and free music listening adoption are translated into active accounts and monetized users by region. Once that structure is in place, the value is formed using a blended monetization layer that combines subscription ARPU, ad-supported revenue per active user, and mix shifts between plans and platforms.
To keep the model anchored in real market behavior, we use market fingerprints such as monthly active usage trends, pricing and discounting patterns, churn expectations, ad fill rate direction, and the share of listening that moves to connected devices (smart speakers and automotive infotainment). Where direct datapoints are missing, a short set of proxy rules is applied, such as mapping ARPU bands to income levels and to ad market maturity, then tightening the output using interview-based ranges.
For forecasting, we run scenario analysis so adoption and ARPU move together in a controlled way, and then review the final path against expected changes in licensing costs, regional ad demand, and consumer spending. Selective bottom-up approximations are also used, such as sampling visible pricing tiers by country and multiplying by plausible subscriber counts, plus channel checks for ad-supported yield, which are then used to adjust totals if the top-down output drifts.
Data Validation & Update Cycle
Validation is done through multiple passes so the final totals do not rely on a single input series. We compare model outputs against independent signals like reported digital audio revenue direction, app store rank movements, and subscription price changes, then investigate any large variance that does not match the market narrative.
Before sign-off, the logic and the math are reviewed by another analyst, and follow-up calls are triggered when responses conflict across regions or when a major platform change is reported. Reports are refreshed annually, with interim updates when material events occur, such as pricing resets, major policy shifts on app stores, or sudden ad market swings. Right before delivery, a fresh pass is done so clients receive the latest updated view.
Mordor Intelligence's Cloud Music Services Market Size Versus Other Published Estimates
Published market sizes for cloud music services can vary more than buyers expect, even when the topic label looks the same. The differences usually come from what revenue lines get counted, how streaming versus downloads are treated, and whether the year used is a base year, an estimated current year, or the first forecast year.
Hardware device revenue and telecom connectivity charges sit outside Mordor Intelligence's scope, which is why some broader digital audio figures can appear larger when bundles and device-linked income are included. Gaps also show up when one source treats podcasts and video music content as fully in-scope, and another source counts only music streaming subscriptions, or when ad-supported revenue is modeled using aggressive fill-rate assumptions. Currency timing and refresh cadence matter as well, since fast pricing changes and regional mix shifts can move the USD total in a short period.
Benchmark comparison
| Source | Market Size | Gaps in Research Methodology |
|---|---|---|
| Mordor Intelligence | USD 18.18 B (2026) | |
| Industry Publisher A | USD 15.38 B (2023) | Uses an earlier base year and a segment frame that explicitly includes downloads, subscription streaming, and ad-based streaming, which can shift totals depending on how non-streaming revenues are mapped and how prices are escalated forward. |
| Advisory Firm B | USD 8.00 B (2024) | Appears to model a narrower monetization base and provides limited clarity on what is counted as cloud music revenue, which can understate ad-supported value and miss parts of commercial and device-driven usage. |
Looking across the three figures, most of the spread is explained by year selection, what gets counted as a cloud music service revenue line, and how ad-supported yield is projected. By keeping the revenue scope explicit and then tying adoption and monetization to observable indicators, the final estimate stays traceable and easier to reproduce during updates.


Key Questions Answered in the Report
What is the projected revenue value of cloud music services in 2031?
The sector is forecast to reach USD 30.24 billion by 2031, growing at a 10.71% CAGR.
Which region is expected to grow the fastest through 2031?
Asia Pacific is anticipated to post an 11.52% CAGR as China, India, and Southeast Asia add millions of paying users.
Why are superfan tiers crucial for future monetization?
They capture a higher willingness to pay from the most engaged 10% of listeners, expanding the margin without raising basic plan prices.
How do royalty costs impact platform profitability?
Royalties consume 65% to 75% of revenue, leaving single-digit operating margins and driving the need for price hikes and new revenue streams.
What role will automotive integration play in driving user growth?
Embedded infotainment apps are expected to grow at a 14.62% CAGR, giving platforms a direct channel to drivers and reducing reliance on smartphones.
Page last updated on:


 Your data is secure and never sold or shared.


