
Climate Finance Market Size and Share
Market Overview
| Study Period | 2020 - 2031 |
|---|---|
| Market Size (2026) | USD 2.17 Trillion |
| Market Size (2031) | USD 3.03 Trillion |
| Growth Rate (2026 - 2031) | 6.90 % |
| Fastest Growing Market | Middle East and Africa |
| Largest Market | Asia-Pacific |
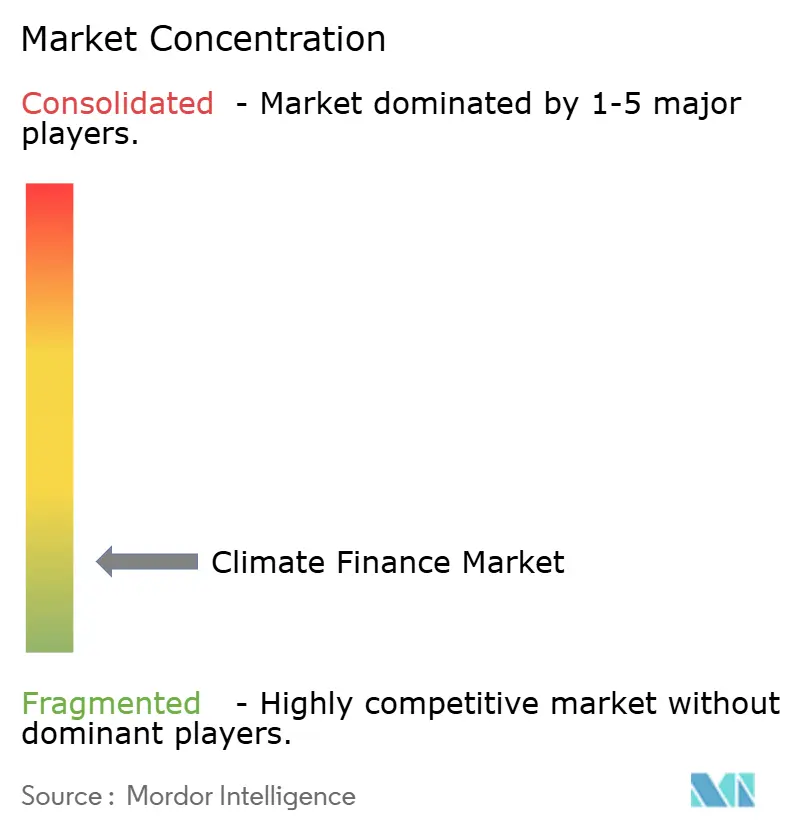
| Market Concentration | Low |
Major Players *Disclaimer: Major Players sorted in no particular order Image © Mordor Intelligence. Reuse requires attribution under CC BY 4.0. | |
Climate Finance Market Analysis by Mordor Intelligence
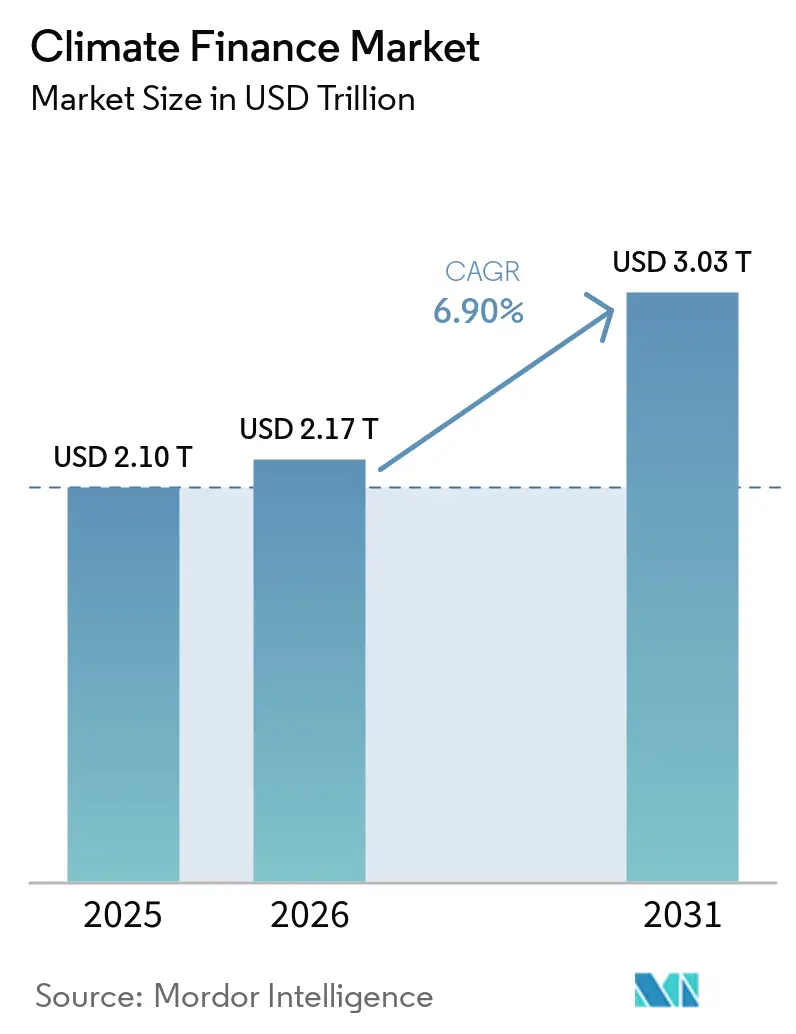
The Climate Finance Market size is projected to be USD 2.10 trillion in 2025, USD 2.17 trillion in 2026, and reach USD 3.03 trillion by 2031, growing at a CAGR of 6.90% from 2026 to 2031.
The climate finance market is expanding across energy, transport, water, buildings, and other assets that can support emissions reduction or resilience. An annual investment of USD 7.8 trillion is needed between 2025 and 2030 to support a 1.5°C pathway, leaving a large gap between available flows and investment needs. Annual growth slowed from 30% in 2021 to 2% to 3% in 2025, increasing the importance of policy execution and broader capital mobilization. Public institutions, sovereigns, multilateral development banks, and private investors are therefore using a wider range of financing structures in the climate finance market. Clean energy, electrified transport, and storage continued to attract significant investment in 2025.
Key Report Takeaways
- By finance use, mitigation captured 91.2% of the climate finance market share in 2025, while adaptation and resilience are projected to expand at a 12.2% CAGR through 2031.
- By provider class, private providers captured 62.3% of the climate finance market share in 2025, while private finance is projected to expand at a 7.4% CAGR through 2031.
- By instrument, debt financing captured 54.1% of the climate finance market size in 2025, while equity financing is projected to expand at 7.9% CAGR through 2031.
- By sector, energy systems captured 43.7% of the climate finance market size in 2025, while water and wastewater are projected to expand at 11.2% CAGR through 2031.
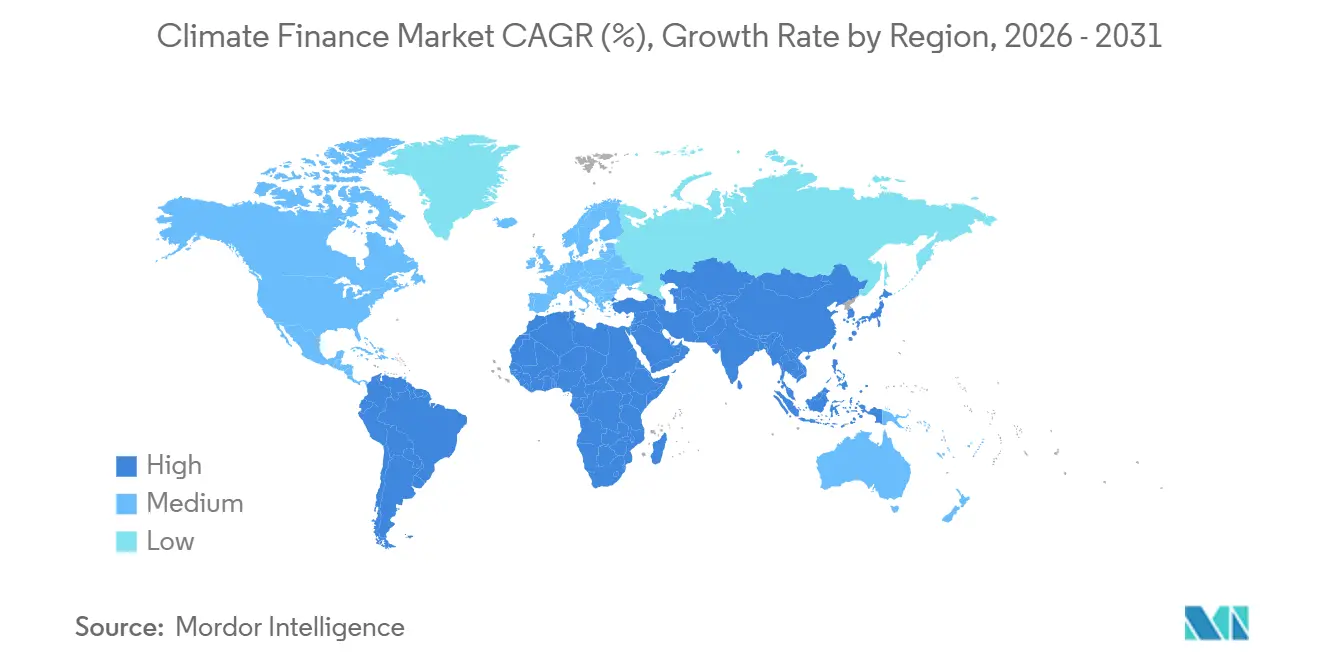
- By geography, Asia-Pacific captured 48.4% of the climate finance market size in 2025, while the Middle East and Africa are projected to expand at 11.7% CAGR through 2031.
Note: Market size and forecast figures in this report are generated using Mordor Intelligence’s proprietary estimation framework, updated with the latest available data and insights as of January 2026.
Global Climate Finance Market Trends and Insights
Drivers Impact Analysis*
| Driver | Impact on CAGR Forecast | Geographic Relevance | Impact Timeline |
|---|---|---|---|
| Declining Costs Improving the Investment Economics of Clean-Energy Projects | +1.4% | Asia-Pacific, Europe, North America, the Middle East | Short term (≤2 years) |
| Expansion of Carbon Pricing and Climate-Finance Disclosure Requirements | +1.6% | Europe, North America, Asia-Pacific, Global | Medium term (2–4 years) |
| Growth of Corporate Transition-Finance and Net-Zero Investment | +1.5% | Global, particularly Europe, North America, and the Asia-Pacific | Medium term (2–4 years) |
| Rising Investment Requirements for Climate Adaptation and Resilience | +1.2% | Asia-Pacific, Middle East and Africa, Latin America | Medium to long term (2–5 years) |
| Expansion of Public De-Risking and Blended-Finance Instruments | +1.8% | Global, with strong relevance in emerging markets, Asia-Pacific and Middle East and Africa | Medium term (2–4 years) |
| Development of Climate Taxonomies, MRV and Climate-Data Infrastructure | +1.1% | Global, particularly Europe and emerging markets | Medium to long term (2–5 years) |
| Source: Mordor Intelligence | |||
Growing International Climate Commitments and COP-Driven Finance Targets
COP29 in Baku set a USD 300 billion annual target for developed countries by 2035 and established a broader USD 1.3 trillion annual mobilization objective for all actors. These commitments provide a policy basis for public and private financing plans in the climate finance market. Multilateral development banks delivered USD 163 billion in climate finance in 2025, including USD 103 billion for low- and middle-income economies[1]. Their adaptation finance for low- and middle-income economies rose 31% to USD 35 billion in 2025, and the banks are targeting USD 42 billion annually for adaptation by 2030. The United Nations Environment Programme estimated that developing economies will need USD 310 billion annually for adaptation by 2035, showing that the funding need remains much larger than current deployment. This gap supports demand for funds, instruments, and partnerships that can direct capital to climate-related projects. National reporting schedules can also create a clearer basis for governments and institutions to track delivery. The need to convert commitments into financed projects keeps attention on implementation capacity. It also increases the relevance of institutions that can prepare bankable projects and coordinate partners.
Private Capital Mobilization and Blended Finance Mechanisms
Private climate finance exceeded USD 1.2 trillion in 2024 and grew at a 19% CAGR between 2019 and 2024. Commercial financial institutions more than doubled their climate flows over that period, reaching USD 572 billion. Households invested USD 332 billion in electric vehicles, heat pumps, and distributed solar in 2024, representing a major share of private mitigation activity. The climate finance market increasingly depends on structures that share project risk between public institutions and commercial investors. BlackRock's Climate Finance Partnership manages a USD 673 million blended vehicle focused on renewable energy infrastructure in Southeast Asia, Latin America, and Africa[2]. Such arrangements can bring private capital into projects that may otherwise face higher perceived risk or longer development periods. They can allocate losses and returns in a way that fits different investor mandates. Public partners may take positions that commercial investors cannot accept alone. This can widen the range of projects that proceed from planning to financial close.
Accelerating Renewable Energy Cost Reductions Driving Energy-Systems Investment
Solar photovoltaic levelized electricity costs fell 90% between 2010 and 2024, while battery storage costs fell 93% over the same period[3]. Lower equipment costs allow each investment dollar to support more clean energy capacity than in prior years. Energy systems consequently remained the largest destination within the climate finance market in 2025. Battery storage was the fastest-growing power technology in 2025, while offshore wind investment recovered, especially in China. These developments support investment in generation, storage, networks, and related infrastructure. Lower costs also make project debt, infrastructure equity, and power purchase agreements more viable without large concessional subsidies. The shift is important because it can reduce reliance on limited public resources. It can also make capital deployment more responsive to project fundamentals. Financing providers can then focus more closely on grid readiness, permitting, and counterparty strength.
Expanding Green Bond and Sustainable Debt Markets
Aligned green bond issuance reached USD 210.8 billion in the second quarter of 2026, taking cumulative aligned green, social, sustainability, and sustainability-linked debt to USD 7.3 trillion[4]. Aligned annual issuance exceeded USD 1 trillion in each year from 2023 through 2025. Green bonds accounted for USD 653.5 billion in 2025, and more than 400 new issuers entered the sustainable debt market that year. In July 2026, the International Finance Corporation issued a USD 2 billion, five-year green benchmark bond under its updated framework. The transaction was the International Finance Corporation's first United States dollar benchmark green bond since 2017. A growing refinancing pipeline may support issuance in the climate finance market through the forecast period. Regular issuance gives investors more reference points for evaluating price and risk. It can also allow issuers to refinance earlier projects as bonds mature. These conditions support the use of labeled debt across a broader set of project sponsors.
Restraints Impact Analysis*
| Restraint | Impact on CAGR Forecast | Geographic Relevance | Impact Timeline |
|---|---|---|---|
| High Cost of Capital and Risk Premiums in Emerging Markets | -0.9% | Asia-Pacific emerging economies, sub-Saharan Africa, the Middle East and Africa, Latin America | Medium term (2–4 years) |
| Policy Uncertainty and Fragmentation of Climate-Finance Frameworks | -1.1% | Global, particularly emerging markets with developing regulatory frameworks | Medium to long term (2–5 years) |
| Limited Supply of Bankable Climate Projects | -1.0% | Emerging markets, Asia-Pacific, the Middle East and Africa, and Latin America | Medium term (2–4 years) |
| Climate-Data Gaps and Greenwashing/Additionality Risks | -1.3% | Global, with acute constraints in emerging markets | Long term (≥4 years) |
| Source: Mordor Intelligence | |||
Fragmented Climate Finance Taxonomy and Data Standardization Gaps
A common global definition of climate-eligible investment has not yet been adopted, which limits consistent measurement across the climate finance market. Private adaptation finance and public domestic flows are not fully captured in several reporting economies. This means the USD 2.1 trillion reported for 2025 may understate activity. Green-labeled sovereign bonds represented 1% of sovereign bond issuance in 2025, while fossil fuel-related and greenhouse-gas-intensive sectors represented 5% to 30% of outstanding bond stocks. Inconsistent classifications can expose issuers to greenwashing concerns and leave investors unable to verify outcomes. Projects with limited reporting capacity may face higher funding costs or lose access to labeled financing. This is especially relevant in markets where information systems and verification resources are still developing. Comparable reporting can help lenders and investors assess the use of proceeds and intended outcomes. Better standards may therefore improve confidence without changing the underlying project need.
High Cost of Capital and Perceived Risk in Emerging Market and Adaptation Investments
International public adaptation flows to developing economies fell to USD 26 billion in 2023, compared with the modeled annual needs of USD 310 billion by 2035. Adaptation projects often deliver broad public benefits that do not generate a direct and predictable revenue stream. This makes them harder to finance on commercial terms without public participation. Climate Policy Initiative estimated that sub-Saharan Africa received 2% of global clean energy investment despite accounting for 20% of the world's population. Sovereign risk, local-currency constraints, and shallow domestic capital markets add to financing costs in these locations. The climate finance market needs credit enhancement, guarantees, and local-currency financing to improve project viability in underserved regions. Each measure can address a different constraint facing investors and project sponsors. Guarantees can mitigate certain credit risks, while local-currency tools can reduce mismatch between revenues and debt service. Coordinated public support remains important where returns alone do not compensate for the risk involved.
*Our forecasts treat driver/restraint impacts as directional, not additive. The impact forecasts reflect baseline growth, mix effects, and variable interactions.
Segment Analysis
By Finance Use: Mitigation Retains the Largest Allocation
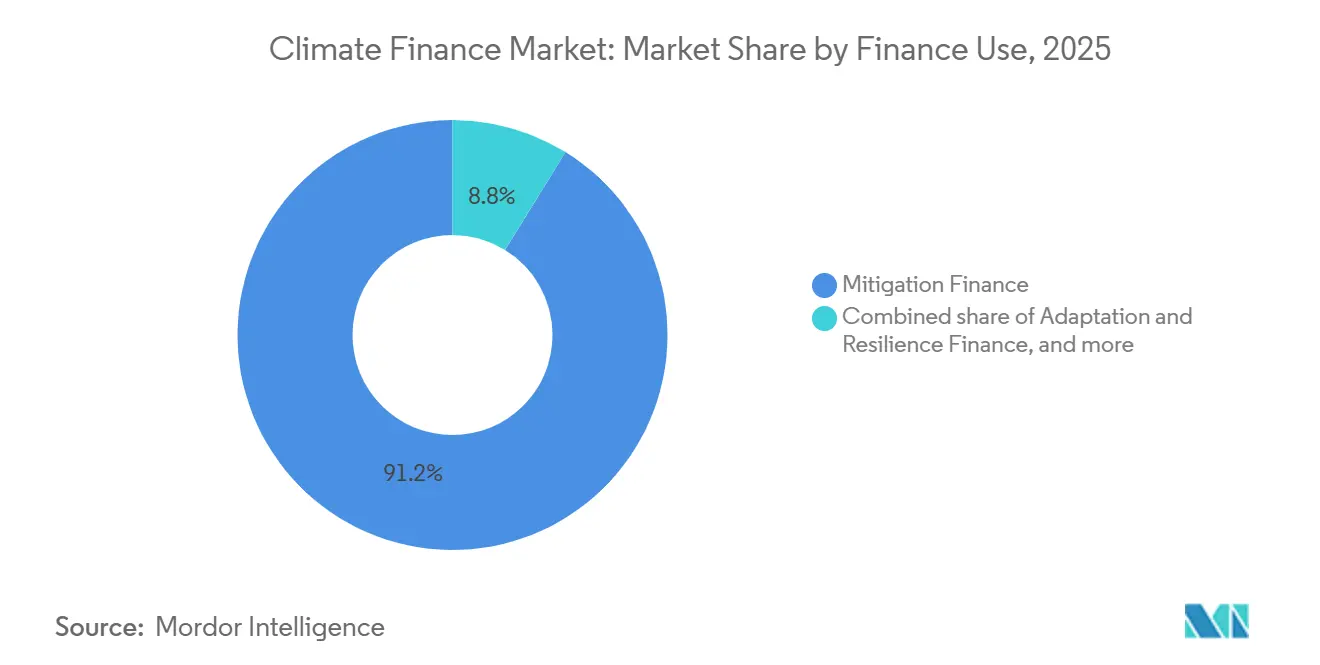
Mitigation accounted for 91.2% of climate finance flows in 2025, reflecting its concentration in energy systems, electrified transport, and industrial efficiency. The climate finance industry has directed capital toward mitigation assets with established revenue models and predictable debt-service profiles. Utility-scale renewable projects can generate cash flows that align with institutional return requirements. Dual-benefit finance, which supports mitigation and adaptation goals together, reached USD 58 billion in 2023. This approach can give investors a clearer way to recognize co-benefits within project design. Mitigation will remain important to the climate finance market while large-scale decarbonization assets continue to attract capital.
Adaptation and resilience are projected to grow at a CAGR of 12.2% from 2026 to 2031, making it the fastest-growing finance-use category. Physical risks such as drought, heat stress, and flooding are increasing the financial relevance of resilience projects. Investment pathways for adaptation infrastructure exist across water, energy, and transport in emerging markets. Better measurement of avoided disruption, stable agricultural yields, and lower recovery costs can improve the case for private investment. Adaptation financing can draw on public climate funds alongside commercial structures that value resilience benefits. Projects with credible long-term cash flows and risk reduction measures are better positioned to secure blended capital. These developments could gradually broaden the allocation mix within the climate finance market. Progress will depend on whether investors can identify and measure the economic benefits of resilience. Public and private participants will also need structures that match long asset lives. Wider adoption may help more adaptation projects compete for capital alongside mitigation assets.
By Provider Class: Private Providers Lead Capital Deployment
Private providers held 62.3% of climate finance flows in 2025 and drove 70% of net growth since 2019. They grew at a 19% CAGR from 2019 to 2024, supported by commercial institutions and households. Private providers are projected to grow at a 7.4% CAGR from 2026 to 2031. Their position reflects the wider use of private equity, private credit, infrastructure funds, and commercial lending. The climate finance industry relies on these providers to finance projects that exceed public balance-sheet capacity. Their continued participation depends on clear project pipelines and workable risk-sharing arrangements.
Public finance remains central because it can reduce risk and attract larger pools of private capital. Multilateral development banks committed USD 163 billion in climate finance in 2025 and mobilized USD 116 billion in private co-financing. This role is particularly important in locations where commercial lenders face country or currency risks. Pentagreen Capital deployed more than USD 400 million across distributed solar, waste-to-energy, and water treatment projects in Indonesia, Vietnam, and the Philippines through 2025. The platform combines commercial capabilities with capital intended to absorb catalytic risk. Similar structures may help widen participation in the climate finance market, where conventional lending remains constrained. They can connect locally relevant projects with large pools of international capital. The balance between commercial and catalytic capital will vary by project and location. This makes transaction design a continuing part of provider competition.
By Instrument: Debt Maintains a Deep Funding Base
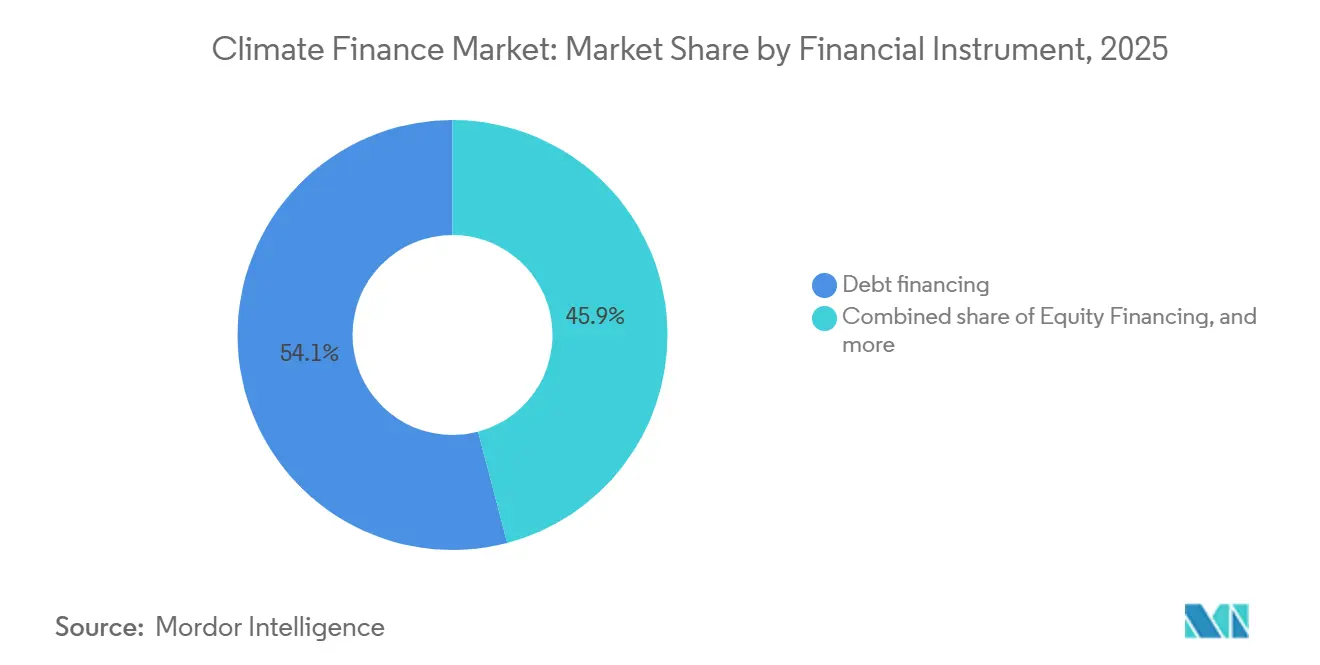
Debt financing captured 54.1% of flows in 2025, supported by expanding issuer participation and institutional demand for green bonds. The cumulative aligned green, social, and sustainability-linked debt market reached USD 7.3 trillion by mid-2026. Green bonds represented 62% of cumulative aligned volume. The Organisation for Economic Co-operation and Development reported that green-labeled syndicated loans made up 5% of new issuance in 2025, compared with 6% for fossil fuel-sector syndicated lending. In September 2026, RWE issued a USD 1.5 billion green bond that was more than six times oversubscribed. These instruments provide a familiar way for issuers and investors to fund the climate finance market. Bond structures can offer defined terms and established disclosure practices. That familiarity can shorten the path to market for issuers with eligible projects. It can also support repeated issuance as capital needs grow.
Equity financing is projected to grow at 7.9% CAGR from 2026 to 2031. Equity and first-loss capital can absorb risk that senior lenders and institutional investors are not able to accept. The World Bank Group's guarantee platform is targeting USD 20 billion in annual guarantees by 2030. BlueOrchard's Climate Action Mobilisation Fund reached a USD 250 million first close in 2026. It received an investment-grade rating for an emerging-market private-credit climate vehicle. Blended structures that combine concessional equity with senior debt may give the climate finance market a way to serve higher-risk investments at greater scale. Their use requires careful allocation of losses, returns, and governance rights. These structures may be most useful when project fundamentals are sound, but risk perceptions remain elevated. They also require clear communication with investors about the role of each capital provider.
By Sector: Energy Systems Lead, While Water Receives More Attention
Energy systems held 43.7% of total flows in 2025, supported by policy support, lower costs, and investor familiarity. Clean energy investment increased 17% in 2024, while solar photovoltaics remained a highly competitive power source. Battery energy storage became the fastest-growing power technology in 2025. Transport was the second-largest sector, supported in part by household purchases of electric vehicles. Buildings also attract capital for efficiency upgrades, heat pumps, and lower-carbon construction. Agriculture, forestry, and other land use remain comparatively underfunded, with the Climate Policy Initiative estimating that a 153-fold increase from 2024 investment levels is needed to meet stated sector goals.
Water and wastewater are projected to expand at a CAGR of 11.2% from 2026 to 2031. Climate-related water stress is increasing demand for water efficiency, resilient supply, irrigation, and flood-management assets. The Organization for Economic Co-operation and Development stated that water-labeled bonds represent less than 1% of the global green, social, sustainability, and sustainability-linked bond market. In March 2026, the Asian Infrastructure Investment Bank approved a USD 500 million results-based financing project for water efficiency and climate resilience in Türkiye. The project links disbursement to verified irrigation and flood-control outcomes. Water assets could become a larger part of the climate finance market as investors and public authorities address physical supply risks. Water projects can support resilience by limiting losses from scarcity, flooding, and disrupted supply. They may also support mitigation when efficiency improvements reduce the energy needed to treat or move water. These linked outcomes can broaden the appeal of water assets to development banks and institutional investors. Their progress will depend on credible performance measurement and appropriate revenue arrangements.
Geography Analysis
Asia-Pacific held 48.4% of climate finance flows in 2025, making it the largest regional allocation. East Asia and the Pacific received 68% of climate finance directed to emerging markets and developing economies in 2024, with China representing 63% of those regional flows. Excluding China, East Asia and the Pacific grew at a 23% CAGR from 2022 to 2024 and reached USD 104 billion. The Philippines, Thailand, and the Lao People's Democratic Republic recorded increases of 61%, 61%, and 69%, respectively. South Asia grew at a 20% CAGR since 2019, with project opportunities in grids, solar power, and clean transport. This scale gives Asia-Pacific a leading role in the climate finance market. The region combines large established investment flows with rapidly growing activity in several emerging economies. That mix gives financiers access to mature clean technology supply chains and newer project pipelines. It also means that changes in Chinese activity can materially influence regional and global flow patterns. Grid expansion, electrified transport, and energy efficiency remain important investment channels across the region.
Europe and North America remain major advanced-economy contributors to climate capital and green bond liquidity. In the United Kingdom, the government confirmed a GBP 400 million (USD 516 million) sovereign loan commitment to the Tropical Forest Forever Facility in 2026. In the United States, the International Finance Corporation issued its USD 2 billion green benchmark bond in July 2026, demonstrating continued access to United States dollar capital markets. Europe continues to provide a large institutional investor base for labeled debt. Latin America represented 8% of global sustainable bond issuance in 2025, compared with 3% in 2024. These regions support the development of financing instruments and capital-market participation across the climate finance market. Their deep institutional investor pools can help sustain demand for labeled debt. Public commitments and private issuance can work together, although the balance varies by country. The United Kingdom and the United States remain relevant sources of capital and financial expertise. Latin American issuers are also expanding their role as local financing mechanisms develop. The The
Middle East and Africa are projected to grow at 11.7% CAGR from 2026 to 2031, the fastest regional rate: high solar resources and rising domestic capital mobilization support renewable energy investment in this geography. Africa Finance Corporation launched the Infrastructure Climate-Resilient Fund Nigeria in 2026 with a USD 253 million first-loss commitment from the Green Climate Fund and a target of USD 3.7 billion in total financing. Sub-Saharan Africa received USD 55 billion in climate flows in 2024, including USD 11 billion for adaptation, but total flows declined 15% from 2023. The World Resources Institute documented rising contributions from Saudi Arabia, the United Arab Emirates, and South Korea to climate finance. These flows and risk-mitigation tools can improve project access within the climate finance market. The region still faces a material gap between available capital and project needs. First-loss capital and guarantees can be important where investors remain concerned about risk. Domestic institutional investors may become more relevant as suitable structures are established. These factors support the region's faster projected growth rate while also showing the importance of risk-sharing arrangements.
Competitive Landscape
The climate finance market is characterized by concentrated activity among multilateral development banks (MDBs) and sovereign institutions, while private blended finance remains fragmented. Major MDBs committed USD 163 billion in 2025, more than double the USD 51.6 billion committed to low- and middle-income economies in 2021. These institutions act as anchor investors and provide guarantees, concessional capital, and risk-sharing mechanisms that help mobilize commercial capital. Asset managers, climate-focused platforms, and local fund managers compete based on their ability to structure financing and access projects. Competitive advantages, therefore, vary by region, technology, and financing instrument.
MDBs also influence competition through project preparation, standards, risk allocation, and benchmark transactions that improve investor confidence. Private providers compete through project origination, underwriting capabilities, and financing structures tailored to local conditions. Corporate issuers add further demand for debt financing as they fund energy-transition investments and maintain capital-market access. Partnerships are increasingly important where projects require multiple sources of capital, guarantees, or risk support. Clear allocation of responsibilities can improve project preparation, monitoring, refinancing, and investor confidence over long project lifecycles.
Guarantee-backed structures are emerging as an important differentiator, with the World Bank Group targeting USD 20 billion in annual guarantees by 2030. In April 2026, the European Union and partner development finance institutions launched the Global Green Bond Initiative Fund, targeting up to EUR 20 billion (USD 21.6 billion) for sustainable infrastructure in low- and middle-income economies. Financing remains less developed in adaptation, local-currency instruments, water, agriculture, and blue-carbon projects compared with energy finance. Improved climate-risk data and reporting requirements may benefit providers with stronger outcome measurement and recognized reporting frameworks. Overall, competitive positioning increasingly depends on the ability to verify climate outcomes, manage risk, structure blended capital, and provide financing on workable terms.
Climate Finance Industry Leaders
-
World Bank Group
-
European Investment Bank
-
JPMorganChase
-
Goldman Sachs
-
BlackRock
- *Disclaimer: Major Players sorted in no particular order
Recent Industry Developments
- September 2026: RWE successfully issued its third United States dollar green bond, raising USD 1.5 billion in 2 tranches, including USD 750 million at a 5-year tenor and USD 750 million at a 10-year tenor. The order book was more than 6 times oversubscribed. The issuance reinforces RWE's systematic annual access to the United States capital markets for energy transition financing.
- September 2026: BlueOrchard's Climate Action Mobilisation Fund achieved a USD 250 million first close. The fund received senior financing from Aviva Investors, Daido Life Insurance, Schroders, and British International Investment. It received an investment-grade rating for an emerging-market private-credit climate vehicle.
- July 2026: 7 major multilateral development banks collectively committed USD 162.5 billion in climate financing in 2025. Low- and middle-income economy allocations rose 21% to USD 103 billion, and private capital mobilized reached USD 116 billion.
- July 2026: The International Finance Corporation priced a USD 2 billion, 5-year green benchmark bond under an updated Green Bond Framework. Net proceeds support private-sector climate-smart projects in developing economies.
Global Climate Finance Market Report Scope
| Mitigation Finance |
| Adaptation and Resilience Finance |
| Dual-Benefit Climate Finance |
| Enabling and Capacity Finance |
| Public (Governments, DFIs, climate funds, state-owned FIs, SOEs) |
| Private (Commercial FIs, Corporates, Households, & Others) |
| Grants, Technical Assistance and Results-based Cash |
| Debt Financing |
| Equity Financing |
| Energy Systems |
| Transport |
| Buildings and Built Environment |
| Industry and Manufacturing |
| Agriculture, Forestry, Other Land Use and Fisheries |
| Water and Wastewater |
| Waste |
| ICT and Climate-Data Infrastructure |
| Other Sectors |
| North America | United States |
| Canada | |
| Mexico | |
| South America | Brazil |
| Argentina | |
| Rest of South America | |
| Europe | United Kingdom |
| Germany | |
| France | |
| Italy | |
| Spain | |
| Rest of Europe | |
| Asia-Pacific | China |
| Japan | |
| India | |
| South Korea | |
| Australia | |
| Indonesia | |
| Thailand | |
| Malaysia | |
| Singapore | |
| Vietnam | |
| Rest of Asia-Pacific | |
| Middle East and Africa | Saudi Arabia |
| United Arab Emirates | |
| Turkey | |
| South Africa | |
| Egypt | |
| Rest of Middle East and Africa |
| By Finance Use | Mitigation Finance | |
| Adaptation and Resilience Finance | ||
| Dual-Benefit Climate Finance | ||
| Enabling and Capacity Finance | ||
| By Provider Class | Public (Governments, DFIs, climate funds, state-owned FIs, SOEs) | |
| Private (Commercial FIs, Corporates, Households, & Others) | ||
| By Financial Instrument | Grants, Technical Assistance and Results-based Cash | |
| Debt Financing | ||
| Equity Financing | ||
| By Sector | Energy Systems | |
| Transport | ||
| Buildings and Built Environment | ||
| Industry and Manufacturing | ||
| Agriculture, Forestry, Other Land Use and Fisheries | ||
| Water and Wastewater | ||
| Waste | ||
| ICT and Climate-Data Infrastructure | ||
| Other Sectors | ||
| By Geography | North America | United States |
| Canada | ||
| Mexico | ||
| South America | Brazil | |
| Argentina | ||
| Rest of South America | ||
| Europe | United Kingdom | |
| Germany | ||
| France | ||
| Italy | ||
| Spain | ||
| Rest of Europe | ||
| Asia-Pacific | China | |
| Japan | ||
| India | ||
| South Korea | ||
| Australia | ||
| Indonesia | ||
| Thailand | ||
| Malaysia | ||
| Singapore | ||
| Vietnam | ||
| Rest of Asia-Pacific | ||
| Middle East and Africa | Saudi Arabia | |
| United Arab Emirates | ||
| Turkey | ||
| South Africa | ||
| Egypt | ||
| Rest of Middle East and Africa | ||
Key Questions Answered in the Report
What is driving climate finance growth through 2031?
The forecast reflects capital deployment in energy, transport, water, buildings, and resilience assets, supported by policy commitments and private participation.
Which finance use receives the largest allocation?
Mitigation held 91.2% of flows in 2025, largely because renewable energy and transport projects have established financing models.
Which climate finance use is growing fastest?
Adaptation and resilience is projected to grow at 12.2% CAGR from 2026 to 2031 as physical risks increase financing needs.
Which funding instrument leads climate investment?
Debt financing held 54.1% of flows in 2025, supported by the growing green and sustainable bond market.
Which region holds the largest allocation?
Asia-Pacific held 48.4% of flows in 2025, supported by activity in China and other East Asian and Pacific economies.
Why is water and wastewater gaining attention?
Water and wastewater is projected to grow at 11.2% CAGR through 2031 as resilience, water efficiency, and supply security become higher priorities.