
Clean-Label Preservatives Market Size and Share
Market Overview
| Study Period | 2021 - 2031 |
|---|---|
| Market Size (2026) | USD 1.51 Billion |
| Market Size (2031) | USD 2.14 Billion |
| Growth Rate (2026 - 2031) | 7.24 % |
| Fastest Growing Market | Asia-Pacific |
| Largest Market | North America |
| Market Concentration | Medium |
Major Players *Disclaimer: Major Players sorted in no particular order Image © Mordor Intelligence. Reuse requires attribution under CC BY 4.0. | |
Clean-Label Preservatives Market Analysis by Mordor Intelligence
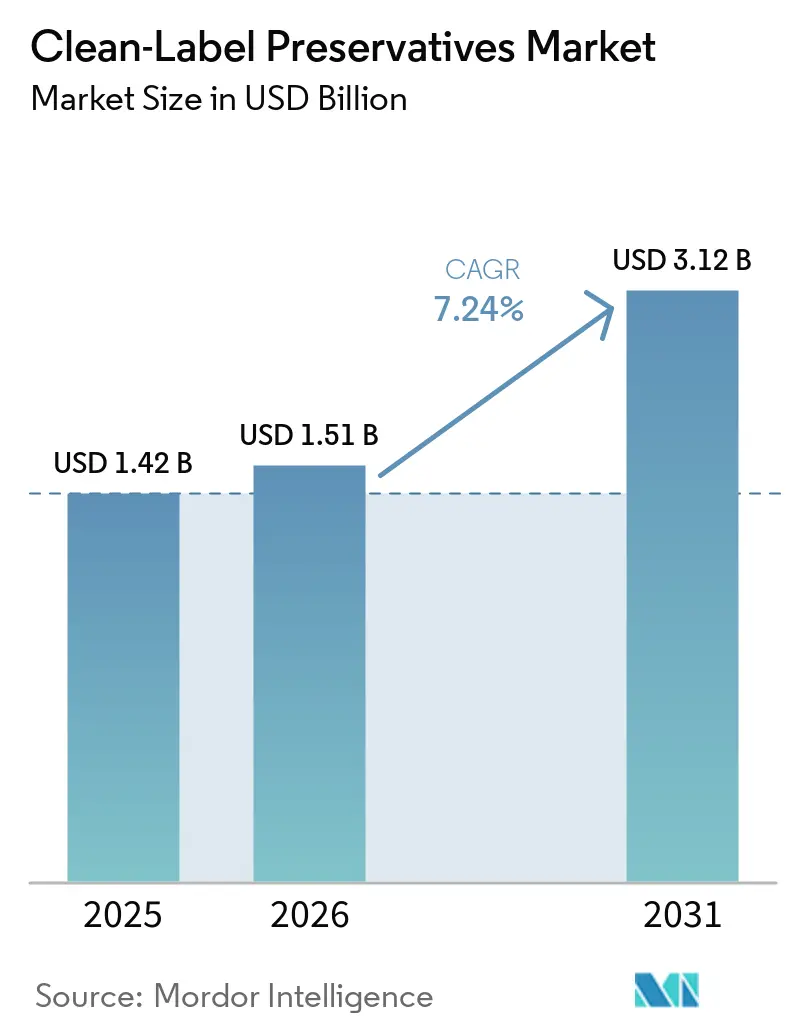
The clean-label preservatives market is projected to expand from USD 1.42 billion in 2025 and USD 1.51 billion in 2026 to USD 2.14 billion by 2031, registering a CAGR of 7.24% between 2026 and 2031. The market is supported by increasingly stringent retailer requirements, heightened consumer scrutiny of ingredient lists, and regulatory restrictions on selected synthetic additives. Food manufacturers are increasingly seeking preservation solutions that effectively control microbial growth and extend product shelf life while maintaining simple, recognizable ingredient statements. Fermentation-derived ingredients, plant extracts, and organic acids offer suppliers several formulation routes to meet these requirements across a range of food systems, including bakery, beverages, dairy, meat products, and prepared foods. Suppliers are also expanding their technical capabilities to help manufacturers balance preservation performance with taste, texture, label claims, and processing requirements. Competitive activity is shifting toward integrated portfolios that combine preservation, texture enhancement, and broader formulation support, as demonstrated by Tate & Lyle’s acquisition of CP Kelco in November 2024.
Key Report Takeaways
- By product type, organic acids and salts held 38.62% of the clean-label preservatives market share in 2025, while natural antioxidants are forecast to expand at an 8.55% CAGR through 2031.
- By source, plant-based ingredients held 56.23% of clean-label preservatives market share in 2025, while fermentation-based ingredients are forecast to grow at an 8.79% CAGR through 2031.
- By form, powder held 67.21% of clean-label preservatives market share in 2025, while liquid products are forecast to grow at a 9.02% CAGR through 2031.
- By application, bakery and confectionery held 42.72% of clean-label preservatives market share in 2025, while ready meals and processed foods are forecast to grow at an 8.74% CAGR through 2031.
- By geography, North America held 40.12% of the clean-label preservatives market share in 2025, while Asia-Pacific is forecast to grow at an 8.35% CAGR through 2031.
Note: Market size and forecast figures in this report are generated using Mordor Intelligence’s proprietary estimation framework, updated with the latest available data and insights as of January 2026.
Market Trends and Insights
Drivers Impact Analysis of Clean-Label Preservatives Market*
| Driver | (~) % Impact on CAGR Forecasts | Geographic Relevance | Impact Timeline |
|---|---|---|---|
| Growing demand for clean-label and recognizable ingredients | +1.8% | Global | Short term (≤ 2 years) |
| Rising demand for extended shelf life and food-waste reduction | +1.4% | Global, with concentrated pull in North America and Europe | Short term (≤ 2 years) |
| Commercialization of fermentation-based preservation solutions | +1.2% | North America, Europe, Asia-Pacific core | Medium term (2–4 years) |
| Expansion of premium packaged, refrigerated, and convenience foods | +0.9% | Asia-Pacific, Eastern Europe, North America | Medium term (2–4 years) |
| Increasing regulatory and retail pressure to reduce artificial preservatives | +0.8% | North America, European Union, China | Short to Medium term (≤ 4 years) |
| Advancements in food-specific biopreservation and protective cultures | +0.7% | Europe, North America, spill-over to Asia-Pacific | Long term (≥ 4 years) |
| Source: Mordor Intelligence | |||
Growing Demand for Clean-Label and Recognizable Ingredients
Consumer attention to ingredient lists has become a commercial issue for packaged-food manufacturers. Global consumers are actively seeking products without preservatives. Retail private-label programs have strengthened this shift because suppliers need accepted ingredient systems before they can win or retain listings. The clean-label preservatives market therefore benefits when ingredient recognition becomes part of supplier approval. This process also shortens reformulation timelines for manufacturers that rely on private-label volume. It favors suppliers that can support customers with validated ingredients, labeling guidance, and application knowledge.
Rising Demand for Extended Shelf Life and Food-Waste Reduction
Food loss and waste account for 8% to 10% of annual global greenhouse-gas emissions[1]. That relationship gives shelf-life extension a role in food manufacturers’ waste-reduction programs. Natural preservation systems can reduce spoilage risk in chilled products when formulation and distribution conditions remain controlled. The clean-label preservatives market also gains when retailers assess suppliers on waste, delivery reliability, and product freshness. Longer shelf life can reduce delivery frequency and the risk of product disposal. This makes preservation performance relevant to procurement teams as well as food scientists.
Commercialization of Fermentation-Based Preservation Solutions
Fermentation-derived preservatives include cultured dextrose, fermented sugar and vinegar blends, nisin, and natamycin. These ingredients are becoming more relevant in dairy, meat, and refrigerated food applications. The European Food Safety Authority has evaluated nisin and maintains food-additive safety information for food businesses and regulators[2]. Fermentation platforms can improve access to antimicrobial peptides and organic acids when producers achieve better strain performance and production efficiency. The clean-label preservatives market benefits because these systems can provide a label-friendly route to microbial control. Their value is greatest where food producers need efficacy without introducing unfamiliar chemical names.
Expansion of Premium Packaged, Refrigerated, and Convenience Foods
Chilled, ready-to-eat, and premium packaged foods require preservation systems that work under refrigeration. These formats are expanding the need for botanical antimicrobials and fermentation-derived cultures in the clean-label preservatives market. Cold-chain investment in India, Vietnam, and Indonesia supports a larger base for refrigerated food production and retail distribution. Exporters serving European customers must also meet additive requirements that apply to food placed on European shelves[3]. This creates demand from both local consumption and export-oriented manufacturing. Suppliers that can show performance in chilled food matrices are better placed to serve these applications.
Restraints Impact Analysis of Clean-Label Preservatives Market*
| Restraint | (~) % Impact on CAGR Forecasts | Geographic Relevance | Impact Timeline |
|---|---|---|---|
| Inconsistent performance across pH, processing, and storage conditions | -0.8% | South America, Middle East and Africa, and warm-climate Asia-Pacific markets | Medium term (2-4 years) |
| Higher formulation costs and required usage levels | -0.7% | Global, with greater pressure in price-sensitive Asia-Pacific and South American markets | Short term (≤ 2 years) |
| Sensory changes and ingredient compatibility challenges | -0.5% | Global | Medium term (2-4 years) |
| Raw-material supply and cost volatility | -0.5% | Global, with exposure to rosemary, lactic-acid feedstocks, and botanical extraction | Medium term (2-4 years) |
| Source: Mordor Intelligence | |||
Inconsistent Preservation Performance Across pH, Processing, and Storage Conditions
Natural preservatives often have narrower operating ranges than synthetic alternatives. Organic acids can lose effectiveness at higher pH levels, while some botanical antimicrobials can lose activity during heat treatment. Fermentation-derived cultures also depend on stable cold-chain conditions in many applications. Clean-label alternatives usually need combination strategies and food-matrix-specific adjustment rather than direct substitution. These limits can slow adoption in warm climates and in foods exposed to variable distribution conditions. The clean-label preservatives market therefore rewards suppliers that provide validation, predictive tools, and technical application support.
Higher Formulation Costs and Required Usage Levels
Natural preservative systems can carry higher cost-in-use than conventional synthetic options. Some natural antimicrobials require higher inclusion levels to achieve the same control of target organisms. This is particularly challenging in high-volume bakery, tortillas, and mass-market dairy products. Price-sensitive manufacturers in India, Brazil, and Vietnam may delay reformulation when retailer or export requirements do not create a direct commercial need. Fermentation scale-up and feedstock optimization can improve the cost position over time. The clean-label preservatives market will expand more easily where suppliers can prove a clear value case through shelf life, waste reduction, or premium product positioning.
*Our forecasts treat driver/restraint impacts as directional, not additive. The impact forecasts reflect baseline growth, mix effects, and variable interactions.
Clean-Label Preservatives Market Segment Analysis
By Product Type:
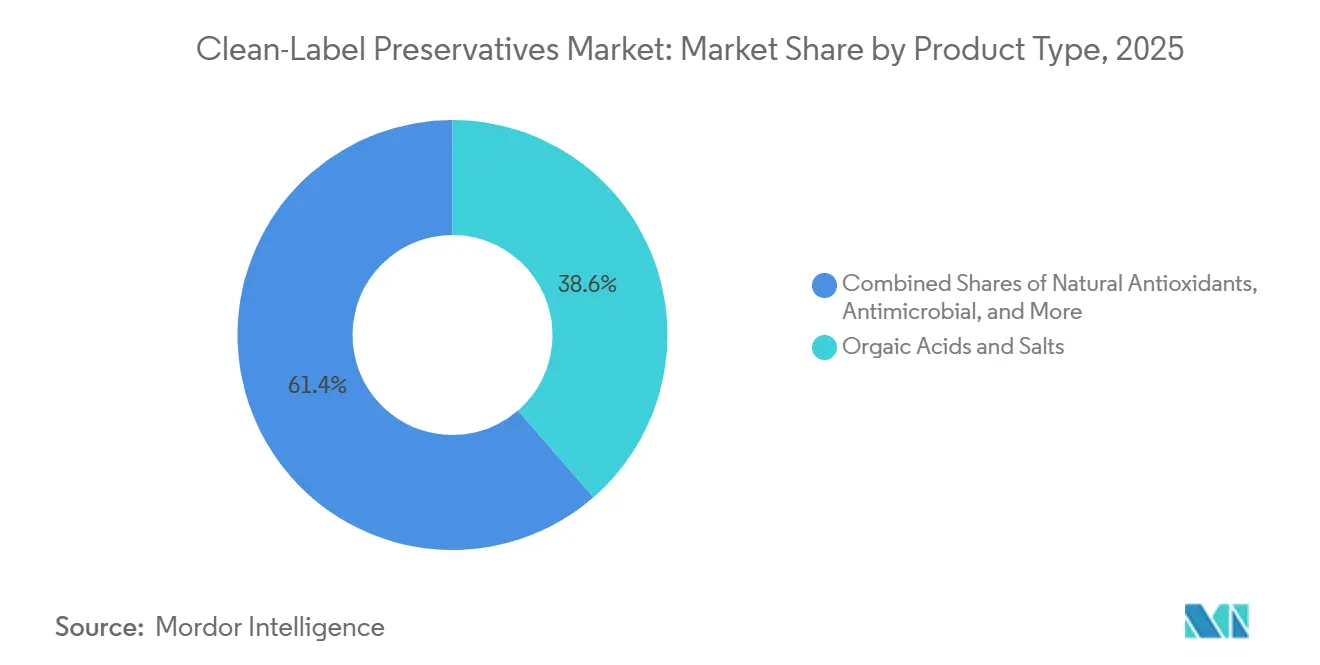
Organic Acids Hold Scale as Natural Antioxidants Drive GrowthOrganic acids and salts held 38.62% of the clean-label preservatives market share in 2025. Their position reflects broad use across protein, carbohydrate, and high-moisture food systems. Lactic acid remains important because it can support both acidification and microbial control in multiple applications. Fermentation-based production of lactic acid also supports its clean-label positioning. Natural antioxidants are projected to grow at an 8.55% CAGR through 2031. Rosemary extract, green tea extract, and mixed tocopherols are relevant for lipid-rich foods where manufacturers seek substitutes for butylated hydroxy toluene and butylated hydroxy anisole. These extracts are used in processed meat, confectionery coatings, and nut-based foods. The clean-label preservatives market size for natural antioxidants is supported by demand for protection against oxidation and a more recognizable ingredient statement.
Organic acids have a structural advantage because many food manufacturers already understand their processing behavior. Citric acid, lactic acid, acetic acid, and their salts can serve established applications with familiar manufacturing practices. Their future growth depends on reliable feedstocks, consistent quality, and cost control. Food businesses are also reviewing supply concentration for ingredients such as citric acid. This supports dual-source qualification and can create opportunities for producers using alternate agricultural feedstocks. Codex General Standard for Food Additives provides the international baseline for permitted uses of food additives, including nisin, lysozyme, and organic-acid salts. Established ingredients with clear regulatory standing are more likely to fit global product portfolios.

By Source:
Plant-Based Matures as Fermentation Extends ApplicationsPlant-based ingredients held 56.23% of the clean-label preservatives market share in 2025. Rosemary extract, citrus antimicrobials, and organic acids from agricultural feedstocks give this source category a mature commercial base. Brands often value these ingredients because they can be explained in familiar food terms. Plant-based systems remain useful in bakery, snacks, meat, and selected dairy applications. Fermentation-based ingredients are projected to grow at an 8.79% CAGR through 2031. Their growth reflects improved access to antimicrobial peptides, culture systems, and lactic-acid derivatives. The clean-label preservatives market size for fermentation-based sources increases as dairy and meat manufacturers seek alternatives that protect safety and support additive-free claims. Animal-based ingredients such as chitosan and lysozyme retain specialized use where allergen and vegan-positioning limits can be managed.
Chitosan can be effective against several food-spoilage and food-safety organisms. Its use remains concentrated in applications where its source and label implications fit the finished food. Fermentation offers a different route because culture-based products can work directly within a food’s microbial environment. Novonesis offers FreshQ bioprotective cultures for fermented milk, yogurt, and plant-based dairy applications. The formation of Novonesis consolidated major culture capabilities under a single company. This gives the company a broad base for genomic screening and food-culture development. Smaller suppliers can still compete by focusing on individual application niches and customer-specific formulation support.
By Form:
Powder Retains Distribution Advantages as Liquid Gains UsePowder held 67.21% of clean-label preservatives market share in 2025. Powdered ingredients fit dry blending, bulk storage, and bakery or snack manufacturing processes. They also offer practical shelf-stability advantages in warmer distribution routes. These features support continued use in food categories that do not require liquid dosing. Liquid ingredients are projected to grow at a 9.02% CAGR through 2031. They suit brine systems, dips, sprays, and other processing steps used for chilled protein, ready meals, and refrigerated dairy. The clean-label preservatives market size for liquid form is therefore linked to the expansion of refrigerated products. Liquid formats can also offer more precise dosing in aqueous food systems.
Buffered-vinegar and fermented sugar-vinegar systems are often supplied as liquids because they work well in water-based matrices. These formats are relevant in deli salads, soups, dressings, and other mildly acidic foods. Form selection also affects how preservation ingredients respond to pH and processing conditions. Corbion expanded its Verdad Opti Powder portfolio in 2025 and continues to provide preservation tools for food manufacturers. This shows that both powder and liquid formats can remain important. Encapsulated, gel, and controlled-release formats are smaller categories with potential in heat-processed foods. They can help protect sensitive natural ingredients during thermal treatment.
By Application:
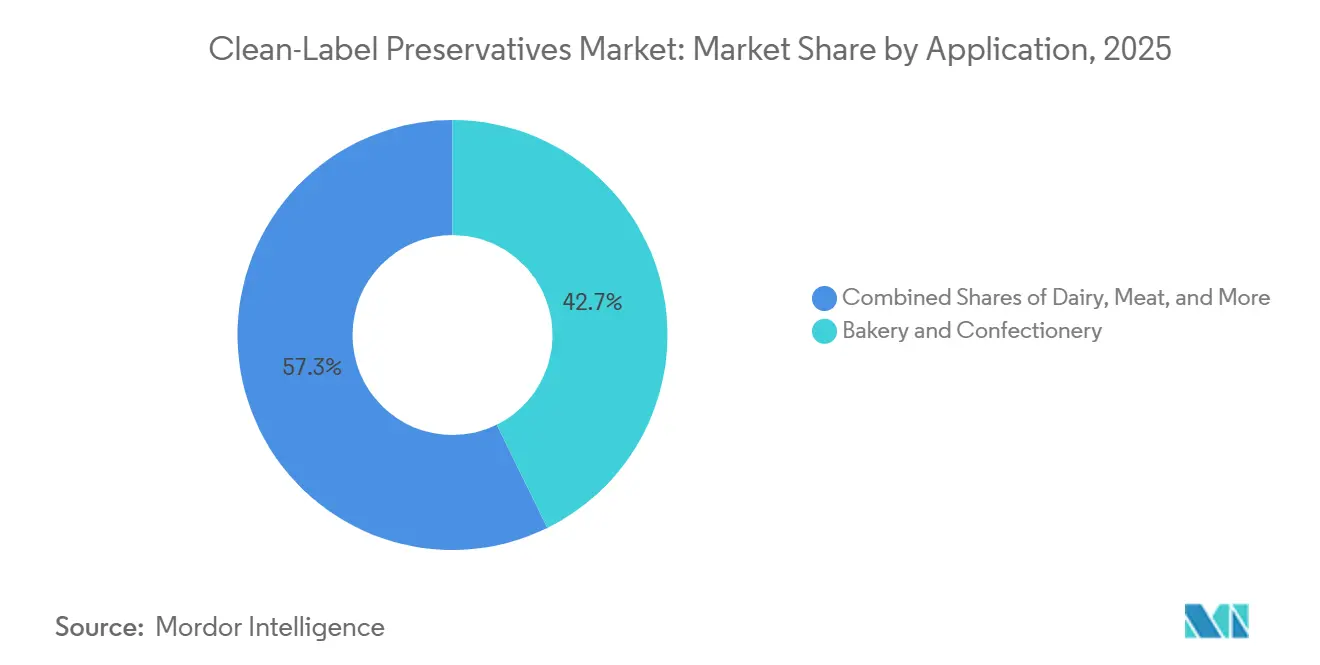
Bakery Anchors Revenue as Ready Meals Grow FasterBakery and confectionery held 42.72% of the clean-label preservatives market share in 2025. This category remains important for organic acids and mold-inhibitor systems because bread and related products need reliable shelf-life control. Ready meals and processed foods are projected to grow at an 8.74% CAGR through 2031. Cold-chain retail growth in Asia-Pacific and Eastern Europe supports this outlook. Foodservice buyers are also asking ingredient suppliers to meet clean-label requirements across wider supply chains. Corbion launched Verdad Essence WH100 in April 2025 as a cultured wheat solution for mold inhibition in bread, buns, tortillas, and flatbreads. The product was supported by testing against 11 mold species. Application-specific tools can reduce reformulation uncertainty for commercial bakeries.
Dairy and dairy alternatives are an important opportunity for fermentation-based preservation systems. Yogurt, soft cheese, and plant-based dairy can use bioprotective cultures to manage spoilage while maintaining a simple ingredient list. DSM-Firmenich reported that 10% of European cheese launches carried an additive-free claim. Meat and meat alternatives remain difficult because these products can present high pH conditions and demanding safety requirements. Beverages, sauces, and condiments provide additional use for organic acids and botanical antimicrobials in mildly acidic matrices. The clean-label preservatives market continues to depend on food-specific development because no single natural system addresses every pathogen, sensory, and storage condition. Suppliers that validate solutions in individual food types can reduce adoption barriers for customers.
Geography Analysis
APAC, South America and MEA Clean-Label Preservatives Market
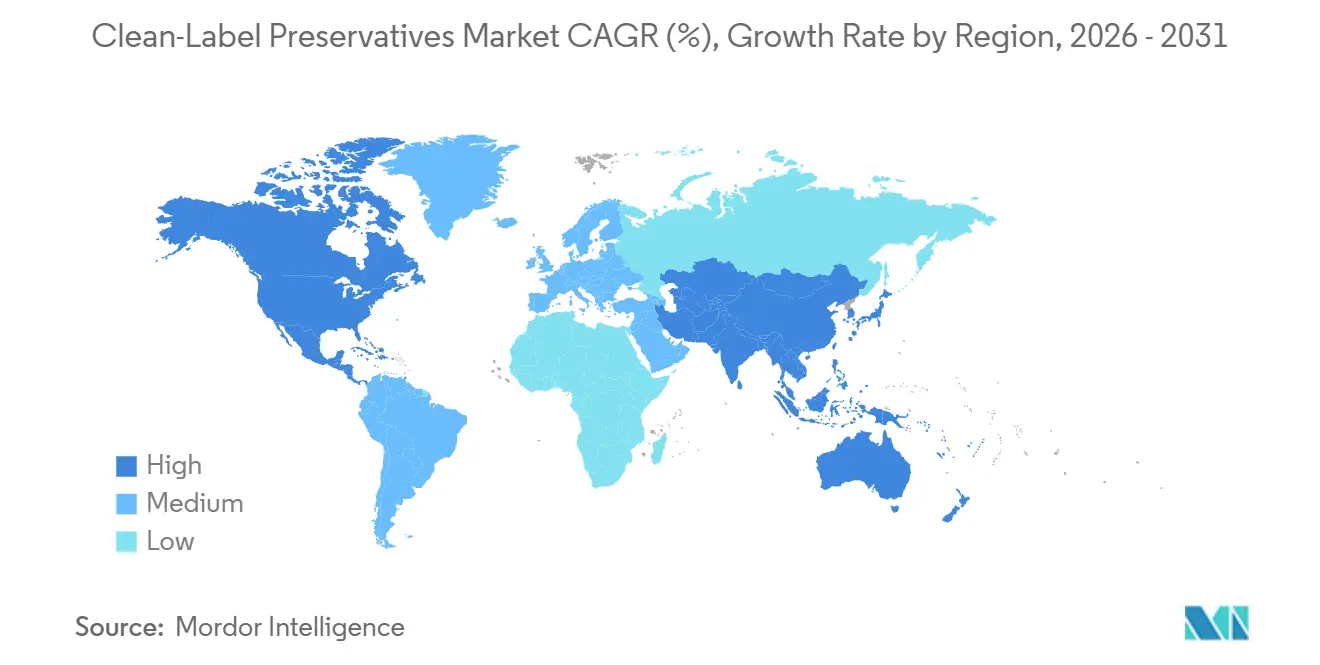
North America held 40.12% of the clean-label preservatives market share in 2025. The region benefits from a large private-label ecosystem, strong cold-chain infrastructure, and high demand for packaged foods with recognizable ingredients. The Food and Drug Administration’s post-market chemical assessment framework increased attention to the safety review of food chemicals in 2026. This encourages manufacturers to evaluate established natural alternatives. The United States Department of Agriculture reported USD 70.1 billion in United States organic sales during 2025, which supports a large customer base for products positioned around organic and clean-label standards. Canada and Mexico add demand through processed meat and bakery export supply chains. Their food manufacturers also need systems that can meet destination-market ingredient expectations.
Europe’s regulatory framework supports demand for natural alternatives while creating a high entry threshold. Commission Regulation (EU) 2024/2597 changed conditions for selected additives and established transition provisions that started in April 2025. Germany, France, the Netherlands, and the United Kingdom remain major consumption centers for clean-label foods. European consumers also show strong interest in familiar ingredients. EIT Food reported that 67% of European consumers avoided foods with unfamiliar ingredients. The clean-label preservatives market size in Europe is reinforced by retailer expectations and ongoing additive re-evaluations. Sweden, Belgium, and the Netherlands also support innovation and exports within the region.
Asia-Pacific is projected to grow at an 8.35% CAGR through 2031. China’s Food Additive Regulation GB 2760-2024 increased the importance of compliance for both domestic and imported foods from February 2025. India’s food regulator is strengthening additive-labeling oversight as organized retail and quick-service supply chains develop. Ready-to-eat food demand and cold-chain investment support the region’s use of chilled preservation systems. South America and the Middle East and Africa offer longer-term opportunities for the clean-label preservatives market. Brazil and Argentina have food-export sectors that need to meet overseas standards. The United Arab Emirates and Saudi Arabia add demand as premium retail and foodservice buyers include clean-label requirements in supplier specifications.
Competitive Landscape
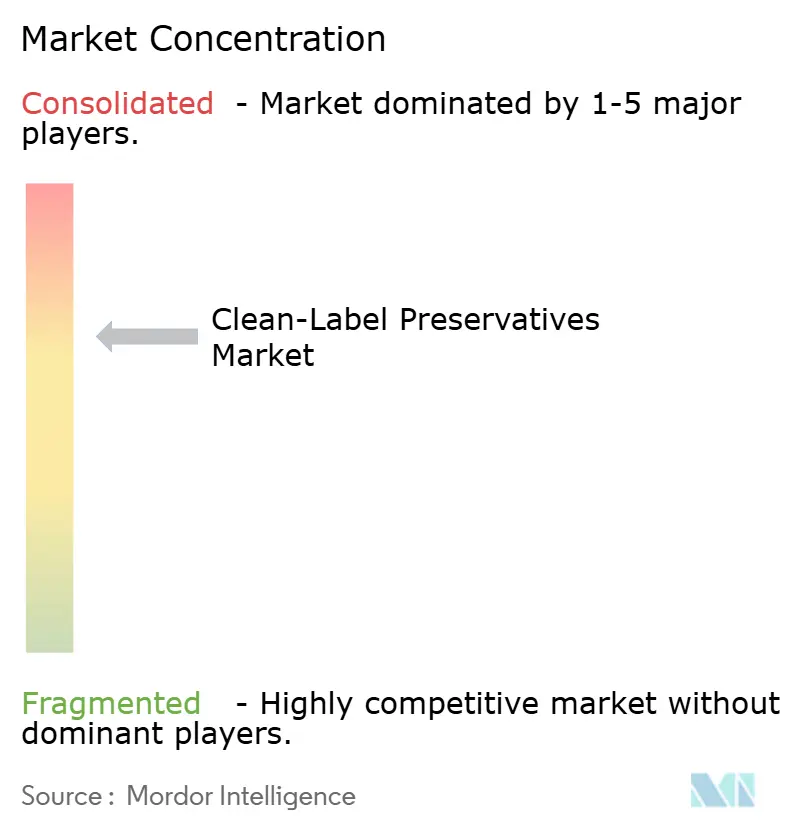
The clean-label preservatives market has a moderate concentration because a group of established ingredient specialists holds considerable formulation capabilities and application-development resources. Corbion, Kerry Group, DSM-Firmenich, IFF, Novonesis, Kemin Industries, and Archer Daniels Midland (ADM) are prominent suppliers across preservation-related food ingredients. Their advantage comes from product portfolios, food-application laboratories, regulatory expertise, and customer technical support. Corbion reported EUR 1,332 million in annual sales in 2024. Its preservation portfolio addresses bakery, meat, dairy, and refrigerated foods. The company’s mold-inhibition tools show the importance of application validation in this field. Kerry’s clean-label preservation portfolio combines functional ingredients with technical services across food applications.
DSM-Firmenich has invested in culture-based solutions that address cheese safety and label requirements. Its September 2025 Dairy Safe launch illustrates a strategy centered on targeted food applications. Corbion’s April 2025 launch of Verdad Essence WH100 shows a related strategy focused on bread and mold control. Novonesis is extending the use of bioprotective cultures in fermented milk and plant-based dairy. These moves show that leading suppliers compete through food-specific performance rather than generic preservation claims. They also seek to make adoption easier through fewer formulation changes and more evidence on finished-food shelf life.
Smaller companies can compete in novel antimicrobial sources and specialized formulation needs. Chinova Bioworks focuses on mushroom-derived chitin, while Handary and A&B Ingredients focus on biopreservation and plant-based antimicrobial applications. Meat alternatives, plant-based dairy, and ready meals remain important areas because their preservation needs are complex. Large suppliers may have scale advantages, but specialist suppliers can address categories where minimum order sizes or broad portfolios do not fit customer needs. Tate & Lyle’s acquisition of CP Kelco in November 2024 also shows a wider move toward multifunctional specialty-ingredient portfolios. The clean-label preservatives market is therefore moderately concentrated, with competition based on technical capability, regional service, and the ability to combine preservation with other food-performance needs.
Clean-Label Preservatives Industry Leaders
-
Corbion N.V.
-
Kerry Group
-
Archer Daniels Midland Company
-
DSM-Firmenich
-
International Flavors and Fragrances Inc.
- *Disclaimer: Major Players sorted in no particular order
Clean-Label Preservatives Market Companies Covered in this Report
- Kemin Industries, Inc.
- Corbion N.V.
- Kerry Group plc
- Cargill, Incorporated
- Archer Daniels Midland Company
- International Flavors and Fragrances Inc.
- DSM-Firmenich
- Chr. Hansen Holding A/S
- Novonesis A/S
- Galactic S.A.
- Jungbunzlauer Suisse AG
- Tate & Lyle PLC
- Lallemand Inc.
- Kalsec Inc.
- Chinova Bioworks
- Handary S.A.
- Sensient Technologies Corporation
- Brenntag SE
- A&B Ingredients
- WTI, Inc.
- Innodal Inc.
Recent Industry Developments in Clean-Label Preservatives Market
- July 2026: Kemin Food Technologies showcased clean-label reformulation solutions at IFT FIRST 2026, targeting manufacturers seeking alternatives to synthetic preservatives and dough conditioners. Its portfolio included enzyme blends to replace DATEM and monoglycerides, clean-label mold inhibition alternatives to calcium propionate, fermentate and buffered vinegar systems for meat products, and rosemary extract as an alternative to TBHQ.
- January 2026: Archer Daniels Midland Company completed a USD 26 million expansion of its Erlanger, Kentucky, flavor and color innovation campus, adding 3,600 square feet to support food and beverage reformulation work. The site upgrade strengthened ADM's ability to develop and scale clean-label systems where antioxidant performance is delivered alongside taste and color optimization.
- April 2025: Corbion launched Verdad® Essence WH100, a cultured wheat-based solution designed to provide natural mold inhibition for breads, buns, tortillas, and flatbreads while supporting clean-label formulations. Alongside the product launch, Corbion upgraded its Natural Mold Inhibition Model (CNMIM) to compare standard and natural preservation solutions against 11 types of mold, helping bakers optimize formulations, reduce development trial-and-error, and extend shelf life.
Global Clean-Label Preservatives Market Report Scope
Clean label preservatives are natural or minimally processed substances that extend the shelf life and enhance the safety of food products without using synthetic or artificial chemical additives. They are typically produced using traditional or gentle processing methods rather than intensive chemical synthesis.
The clean-label preservatives market is segmented by product type (organic acids and salts, fermentation-derived, and more), source (animal-based, plant-based, and fermentation-based), form (powder, liquid), application (bakery and confectionery, dairy alternatives, and more), and geography (North America, Europe, Asia-Pacific, and more). The market forecasts are provided in terms of value (USD).
Segmentation Overview
| Organic Acids and Salts | Acetic Acid |
| Lactic Acid | |
| Citric Acid | |
| Others | |
| Fermentation-Derived Preservatives | |
| Botanical Antimicrobials | |
| Natural Antioxidants | |
| Others |
| Animal-Based |
| Plant-Based |
| Fermentation-Based |
| Powder |
| Liquid |
| Others |
| Bakery and Confectionery |
| Dairy and Dairy Alternatives |
| Meat and Meat Alternatives |
| Ready Meals and Processed Foods |
| Other Applications |
| North America | United States |
| Canada | |
| Mexico | |
| Rest of North America | |
| Europe | Germany |
| United Kingdom | |
| France | |
| Italy | |
| Spain | |
| Netherlands | |
| Sweden | |
| Poland | |
| Belgium | |
| Rest of Europe | |
| Asia-Pacific | China |
| India | |
| Japan | |
| Australia | |
| South Korea | |
| Vietnam | |
| Indonesia | |
| Rest of Asia-Pacific | |
| South America | Brazil |
| Argentina | |
| Chile | |
| Peru | |
| Colombia | |
| Rest of South America | |
| Middle East and Africa | United Arab Emirates |
| Saudi Arabia | |
| South Africa | |
| Nigeria | |
| Rest of Middle East and Africa |
| By Product Type | Organic Acids and Salts | Acetic Acid |
| Lactic Acid | ||
| Citric Acid | ||
| Others | ||
| Fermentation-Derived Preservatives | ||
| Botanical Antimicrobials | ||
| Natural Antioxidants | ||
| Others | ||
| By Source | Animal-Based | |
| Plant-Based | ||
| Fermentation-Based | ||
| By Form | Powder | |
| Liquid | ||
| Others | ||
| By Application | Bakery and Confectionery | |
| Dairy and Dairy Alternatives | ||
| Meat and Meat Alternatives | ||
| Ready Meals and Processed Foods | ||
| Other Applications | ||
| By Geography | North America | United States |
| Canada | ||
| Mexico | ||
| Rest of North America | ||
| Europe | Germany | |
| United Kingdom | ||
| France | ||
| Italy | ||
| Spain | ||
| Netherlands | ||
| Sweden | ||
| Poland | ||
| Belgium | ||
| Rest of Europe | ||
| Asia-Pacific | China | |
| India | ||
| Japan | ||
| Australia | ||
| South Korea | ||
| Vietnam | ||
| Indonesia | ||
| Rest of Asia-Pacific | ||
| South America | Brazil | |
| Argentina | ||
| Chile | ||
| Peru | ||
| Colombia | ||
| Rest of South America | ||
| Middle East and Africa | United Arab Emirates | |
| Saudi Arabia | ||
| South Africa | ||
| Nigeria | ||
| Rest of Middle East and Africa | ||
Key Questions Answered in the Report
What is driving demand for clean-label preservatives?
Demand is supported by ingredient scrutiny, retailer requirements, regulatory reviews, and the need to reduce food waste through longer shelf life.
Which product type leads clean-label preservative use?
Organic acids and salts led with 38.62% share in 2025 because they are used across many food systems.
Which source category is growing fastest?
Fermentation-based ingredients are forecast to grow at an 8.79% CAGR through 2031 as dairy and meat processors adopt culture-based solutions.
Why are liquid preservation ingredients growing faster?
Liquid products are projected to grow at a 9.02% CAGR because chilled foods often need precise dosing in brines, dips, and sprays.