
Market Overview
| Study Period | 2021 - 2031 |
|---|---|
| Forecast Data Period | 2026 - 2031 |
| Base Year Market Size (2025) | USD 9.82 Billion |
| Market Size (2026) | USD 10.52 Billion |
| Market Size (2031) | USD 14.84 Billion |
| Growth Rate (2026 - 2031) | 7.13 % |
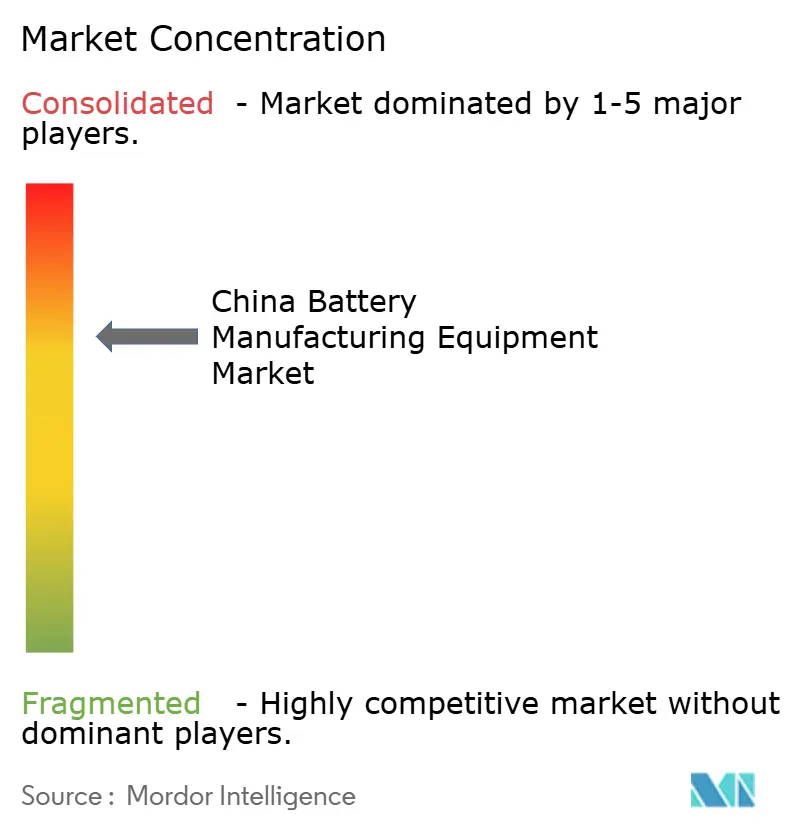
| Market Concentration | Medium |
Major Players *Disclaimer: Major Players sorted in no particular order Image © Mordor Intelligence. Reuse requires attribution under CC BY 4.0. | |
China Battery Manufacturing Equipment Market Analysis by Mordor Intelligence
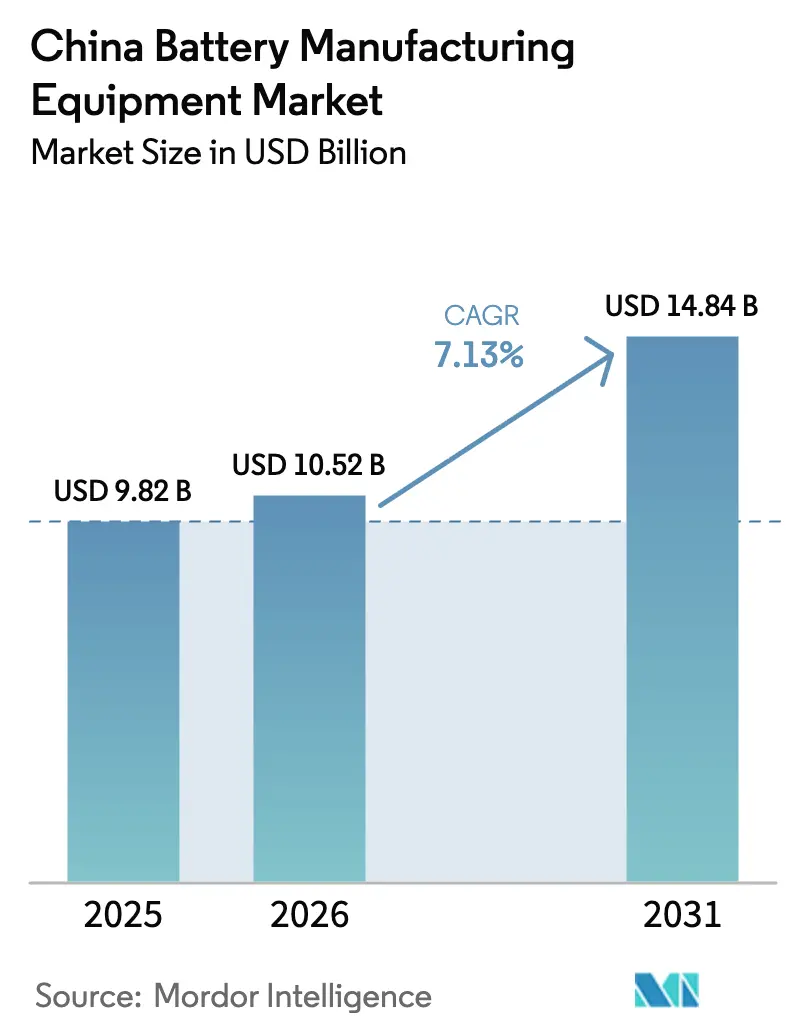
The China Battery Manufacturing Equipment Market size is expected to grow from USD 9.82 billion in 2025 to USD 10.52 billion in 2026 and is forecast to reach USD 14.84 billion by 2031 at 7.13% CAGR over 2026-2031.
Demand is shifting from commodity lithium-ion lines toward high-margin solid-state and sodium-ion pilot systems as domestic policy discourages pure capacity expansion and rewards quality upgrades. Firms offering AI-supervised automation, turnkey delivery within 12–18 months, and localized after-sales support continue to win bids from Tier-1 cell makers. Regional equipment clusters in Jiangsu and Guangdong reduce logistics costs, while emerging hubs in Sichuan and Inner Mongolia leverage low-cost renewable energy. Price wars triggered by 2023-2024 overcapacity have compressed gross margins, yet software-bundled “lights-out” lines help vendors defend pricing as clients seek the 2–3 percentage-point yield gains they deliver.
Key Report Takeaways
- By battery chemistry, lithium-ion held 84.62% of the China battery manufacturing equipment market share in 2025, whereas solid-state equipment is advancing at a 30.24% CAGR through 2031.
- By machine type, coating and drying systems contributed 20.12% of 2025 revenue, while assembly and handling robots posted the fastest 16.15% CAGR to 2031.
- By automation level, fully automatic lines represented 62.74% of 2025 installations, whereas AI-supervised “lights-out” facilities are scaling at an 18.05% CAGR.
- By end-user, automotive OEMs and Tier-1 suppliers accounted for 59.12% of spending in 2025, while energy storage system integrators registered the highest 18.66% CAGR.
Note: Market size and forecast figures in this report are generated using Mordor Intelligence’s proprietary estimation framework, updated with the latest available data and insights as of 2026.
Market Trends and Insights
Drivers Impact Analysis of China Battery Manufacturing Equipment Market*
| Driver | (~) % Impact on CAGR Forecast | Geographic Relevance | Impact Timeline |
|---|---|---|---|
| Rapid EV-led gigafactory expansion | 2.10% | Jiangsu, Guangdong, Sichuan | Short term (≤ 2 years) |
| Government “Made-in-China 2025” automation subsidies | 1.30% | Yangtze River Delta, Pearl River Delta | Medium term (2-4 years) |
| Vertical integration by Tier-1 cell makers | 0.90% | National | Medium term (2-4 years) |
| Solid-state pilot-line investments | 0.70% | Beijing, Shanghai, Shenzhen | Long term (≥ 4 years) |
| AI-driven yield-improvement software bundling | 0.60% | Tier-1 gigafactories nationwide | Short term (≤ 2 years) |
| Surging demand for sodium-ion pilot equipment | 0.50% | National | Medium term (2-4 years) |
| Source: Mordor Intelligence | |||
Rapid EV-Led Gigafactory Expansion
China produced 9.5 million electric vehicles in 2024, spurring CATL to add 200 GWh of annual capacity by 2026 and BYD to plan 150 GWh over the same horizon. Each gigafactory wave requires USD 3-4 billion of fresh machinery, favoring suppliers able to deliver turnkey lines within 12-18 months. Jiangsu, Guangdong, and Sichuan host dense supply chains, enabling just-in-time installation that entrenches local vendors. Provincial incentives further accelerate deployments by offsetting up to 30% of qualifying equipment costs. As a result, the Chinese battery manufacturing equipment market enjoys near-term order visibility despite nationwide capacity utilization below 50%.
AI-Driven Yield-Improvement Software Bundling
Bundling machine-vision analytics with hardware lifts average selling prices 15-20% and locks customers into multi-year service contracts.[1] Wuxi Lead reports first-pass yields of 96-97% on AI-supervised lines versus 92-93% on conventional systems, translating into USD 8-10 million in annual savings for a 10 GWh plant. Real-time defect detection shrinks downtime, while data feedback loops inform cell chemistry tweaks, deepening vendor-client ties. Suppliers lacking native software capabilities must acquire startups or license algorithms, both of which dilute margins and reinforce the competitive moat of full-stack integrators.
Surging Demand for Sodium-Ion Pilot Equipment
CATL’s sodium-ion-powered Sehol E10X debuted in 2024, proving commercial viability and prompting BYD to plan 30 GWh of sodium-ion capacity by 2026.[2] Sodium-ion uses much of the lithium-ion tool set, yet electrolyte filling and sealing require moisture-proof redesigns. Vendors pitch retrofit kits delivering 70-80% output efficiency on repurposed lithium-ion lines, an attractive path for second-tier players short on capex. Sodium-ion is expected to capture 5-8% of China’s cell output by 2030, with equipment sales concentrating in Jiangsu and Guangdong, where brownfield capacity is plentiful.
Solid-State Pilot-Line Investments
The State Council allocated CNY 6 billion (USD 830 million) in 2024 for solid-state R&D, prompting partnerships such as Wuxi Lead-WeLion on dry-electrode pilot lines. Solid-state production demands vacuum deposition, high-pressure calendaring, and solvent-free coating, areas where vendors co-develop bespoke machinery alongside battery chemists. A 31.5% CAGR for solid-state equipment through 2030 presumes 3-5 GWh of pilot capacity online by 2026 and hinges on resolving interfacial resistance that limits cycle life to 500-700 cycles. Equipment makers banking on the transition are embedding upgrade paths into today’s lithium-ion lines, preserving option value for clients wary of stranded assets.
Restraints Impact Analysis of China Battery Manufacturing Equipment Market*
| Restraint | (~) % Impact on CAGR Forecast | Geographic Relevance | Impact Timeline |
|---|---|---|---|
| Equipment over-capacity after 2023-24 capex spree | –1.2% | Jiangsu, Anhui clusters | Short term (≤ 2 years) |
| Intensifying price-cut wars among Chinese OEMs | –0.8% | Nationwide | Short term (≤ 2 years) |
| Scarcity of senior automation engineers | –0.4% | Tier-1 cities | Medium term (2-4 years) |
| Export-control risks on US/EU process IP | –0.3% | National | Medium term (2-4 years) |
| Source: Mordor Intelligence | |||
Equipment Over-Capacity After 2023-24 Capex Spree
Nationwide utilization fell to 47% in 2023 after a two-year installation boom, leaving vendors with idle inventory and forcing discounts that sliced working-capital buffers. Commodity mixers, slitters, and coaters face the deepest glut, while MIIT guidelines now discourage fresh builds unless tied to quality upgrades. Provincial enforcement remains uneven because local authorities still prioritize employment, prolonging oversupply and intensifying competition within the Chinese battery manufacturing equipment market.
Intensifying Price-Cut Wars Among Chinese OEMs
Average selling prices for fully automatic coating lines slid 18-22% between 2023 and 2024 as vendors fought for share. Margins for mid-tier suppliers now hover at 22-25%, down from 30-35% in 2021. Multi-vendor tenders and lengthened payment terms pressure cash flows, limiting R&D budgets for next-gen chemistries and potentially ceding future precision niches back to European or Japanese rivals.
*Our forecasts treat driver/restraint impacts as directional, not additive. The impact forecasts reflect baseline growth, mix effects, and variable interactions.
China Battery Manufacturing Equipment Market Segment Analysis
By Battery Chemistry:
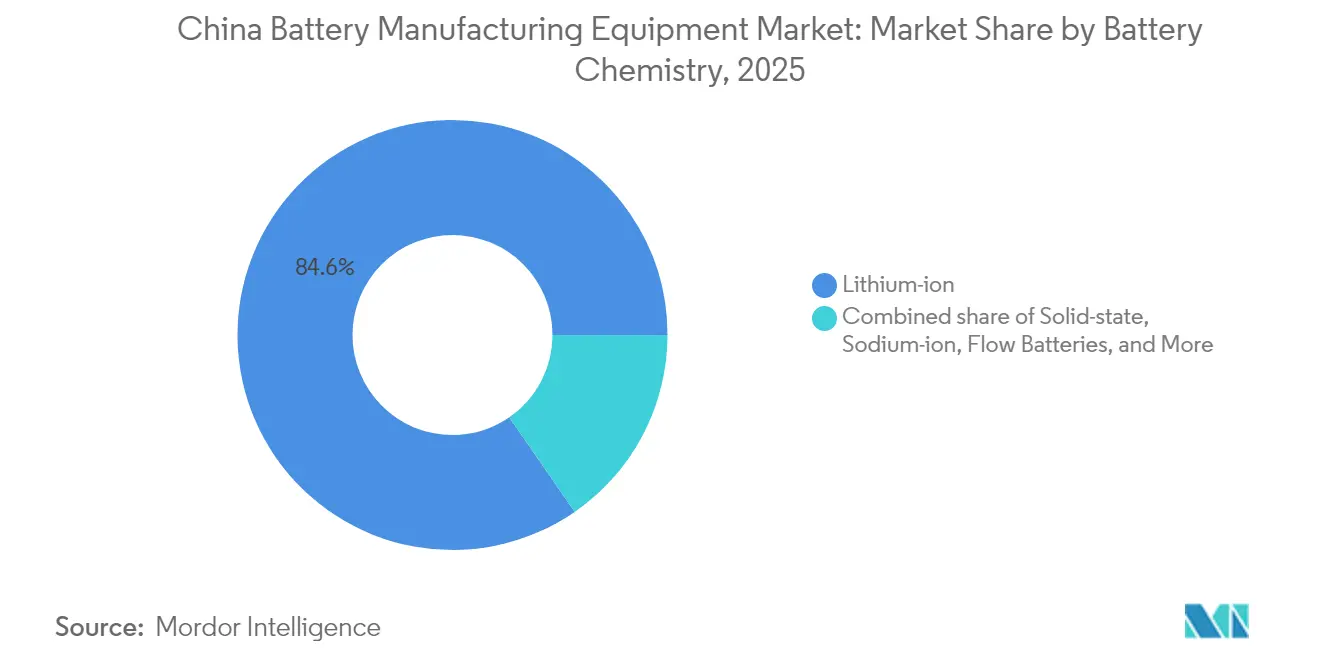
Solid-State Bets Reshape Equipment PipelinesSolid-state equipment revenues are projected to climb at a 30.24% CAGR, reflecting China’s CNY 6 billion commitment to pilot builds that could reach 3-5 GWh by 2026. In contrast, lithium-ion retained 84.62% of the Chinese battery manufacturing equipment market share in 2025 due to entrenched EV and consumer electronics demand. Sodium-ion demand is accelerating as retrofit-friendly tooling appeals to budget-conscious producers, while flow batteries gain traction in grid-scale storage. Lead-acid and nickel-based chemistries remain niche but stable, serving industrial and aerospace use cases.
Strong policy backing and co-development alliances between Wuxi Lead, Putailai, and Tier-1 cell makers underpin rapid solid-state adoption. Equipment designs feature solvent-free coating, vacuum deposition, and high-pressure calendaring that few vendors presently master, making early movers well-positioned to capture the next wave of China battery manufacturing equipment market expansion.

By Machine Type:
Robotics Surge as Labor Costs ClimbCoating and drying systems generated 20.12% of 2025 revenue, reflecting their capital intensity and precision requirements. Assembly and handling robots, however, post the quickest 16.15% CAGR as producers automate labor-heavy stacking and packaging to offset wage inflation. The Chinese battery manufacturing equipment market size for robots, therefore, expands rapidly alongside cell format diversification.
Laser notching and high-precision cutting benefit from large-format cell architectures that demand tighter dimensional control. Formation and testing lines integrate AI diagnostics to catch early-life defects, reducing warranty provisions for EV makers. Meanwhile, recycling and black-mass processing equipment gains policy tailwinds from the 95% material-recovery mandate effective 2028, broadening revenue opportunities beyond primary battery production.
By Automation Level:
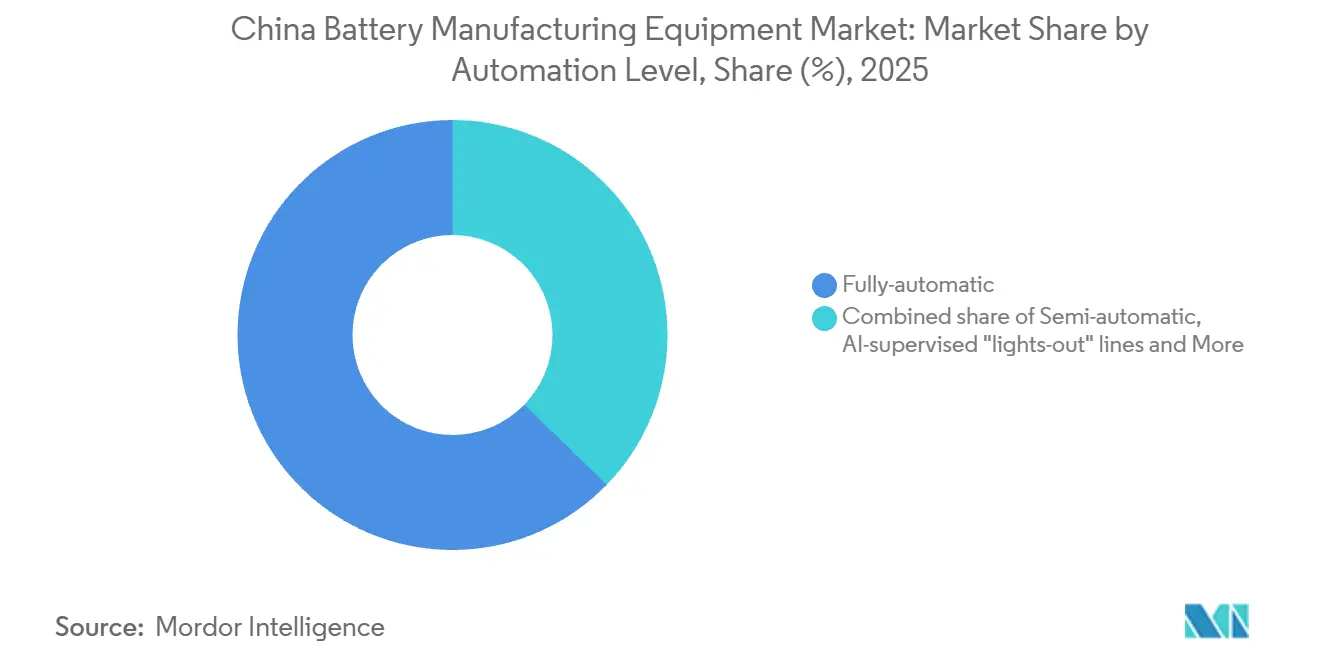
Lights-Out Lines Command Premium PricingFully automatic lines accounted for 62.74% of 2025 installations, underpinning a mature baseline within the China battery manufacturing equipment market size for factory-wide automation. AI-supervised lights-out facilities, however, are outgrowing legacy systems at an 18.05% CAGR as battery makers chase 2-3 percentage-point yield gains. Subsidies covering up to 30% of qualifying spend further tilt purchasing decisions toward premium configurations.
Vendors with integrated software platforms capture recurring analytics revenue that cushions margin erosion in mechanical hardware. Conversely, semi-automatic and manual options persist among pilot lines where flexibility outweighs throughput. The adoption curve suggests lights-out architecture could equip 40-50% of new gigafactory builds by 2030, raising the overall sophistication of the China battery manufacturing equipment market.
By End-User:
ESS Integrators Drive Next Wave of DemandAutomotive OEMs and Tier-1 suppliers consumed 59.12% of equipment in 2025, yet energy storage system integrators now deliver 18.66% CAGR growth as grid operators embrace 4-8 hour discharge solutions. The China battery manufacturing equipment market size allocated to ESS lines is therefore expanding faster than the automotive portion.
Modular containerized production lines shorten project cycles, letting integrators scale capacity alongside provincial renewable-energy rollouts. Consumer electronics remains a steady but modest buyer, while aerospace and defense procure specialty tooling with higher margins. Diversification across end-users cushions vendors against the cyclical nature of EV demand.
Geography Analysis
Jiangsu and Guangdong together hosted more than 60.38% of installed equipment value in 2025, leveraging electronics and auto supply-chain density to attract both domestic champions and foreign precision firms. Their port proximity lowers logistics costs and accelerates commissioning, reinforcing their status as core clusters within the China battery manufacturing equipment market.
Sichuan and Inner Mongolia are fast-growing nodes, drawing on low-cost hydropower and vast land availability for gigafactory campuses. Inner Mongolia’s wind-solar mix aligns with policy aimed at pairing renewable generation with storage, driving dedicated flow and sodium-ion line orders. These inland provinces also benefit from central directives that rebalance industrial growth away from coastal hot spots, gradually diffusing equipment demand across a broader geographic footprint.
Secondary hubs such as Anhui and Hubei specialize in AI-oriented control systems and automation subsystems, leveraging lower real estate and labor expenses. Their local governments experiment with innovative subsidy schemes and environmental standards that could inform national policy refinements. The evolving map of installations underscores the geographically diversified yet still cluster-centric nature of the Chinese battery manufacturing equipment market.
Regulatory Landscape
China’s regulatory environment for battery manufacturing equipment is increasingly shaped by MIIT’s Lithium-ion Battery Industry Norms and the accompanying public lists of compliant enterprises, with the Ninth Batch released in March 2026. This framework discourages simple capacity additions and elevates procurement requirements around process stability, quality management, and green manufacturing, which directly favors higher-precision, automation-heavy equipment and turnkey integrators serving Tier-1 cell makers.
Carbon accounting and end-of-life compliance are tightening the operating requirements for battery plants and, by extension, the equipment and software used on production lines. QC/T 1246-2025 (greenhouse gas emission accounting and reporting for power battery manufacturing enterprises) was published on December 29, 2025 and takes effect on July 1, 2026, pushing factories toward metering, data capture, and reporting-ready systems. Separately, national recycling management measures effective April 1, 2026 establish traceability requirements, including a national platform and digital identity for power battery assets, reinforcing demand for equipment and MES-level integration that can support lifecycle data collection from manufacturing through recycling.
Competitive Landscape
Domestic champions Wuxi Lead, Putailai, HangKe, and Shenzhen Yinghe jointly held roughly 60% of 2024 revenue, supported by short lead times and government procurement preferences that stipulate domestic content thresholds. Their tight integration with local clients facilitates rapid customization and robust after-sales support, reinforcing market dominance even amid price pressure.
Foreign incumbents Dürr, Schuler, Manz, and Andritz retain niche strongholds in ultra-precision coaters, laser systems, and vacuum tools where sub-10-micron tolerances remain demanding. Export-control headwinds, however, force them to localize production or establish joint ventures, such as Dürr’s 2025 AI-coater alliance, to preserve addressable share.
White-space in solid-state, sodium-ion, and recycling lines attracts smaller domestic innovators offering modular, rapidly prototypeable machines. Meanwhile, vertical integration by CATL and BYD trims third-party demand for standard lines by an estimated 8-10%. Competitive intensity is therefore expected to consolidate around software-enabled differentiation and next-gen chemistry readiness within the Chinese battery manufacturing equipment market.
China Battery Manufacturing Equipment Industry Leaders
-
Wuxi Lead Intelligent Equipment Co Ltd
-
HangKe Technology
-
Shenzhen Yinghe Technology
-
Putailai (PTL) Intelligent Equipment
-
Shenzhen Colibri Technologies
- *Disclaimer: Major Players sorted in no particular order
China Battery Manufacturing Equipment Market Companies Covered in this Report
- Wuxi Lead Intelligent Equipment Co., Ltd.
- Shenzhen Yinghe Technology Co., Ltd.
- HangKe Technology Co., Ltd.
- Dürr AG
- Xiamen Tmax Battery Equipments Ltd.
- Xiamen TOB New Energy Technology Co., Ltd.
- Xiamen ACEY New Energy Technology
- Schuler AG
- Hitachi Ltd.
- Andritz AG
- Shenzhen Colibri Technologies
- Putailai (PTL) Intelligent Equipment
- Manz AG
- NAURA Technology Group
Read Analysis of China Battery Manufacturing Equipment Companies
Market Opportunities and Future Outlook
Quality-upgrade regulation and standardization work are creating whitespace for equipment suppliers that can embed compliance into production tooling and factory software. National guidelines to build out a lithium battery standards体系 include an objective of creating at least 100 new national and industry standards by 2026, raising the bar for repeatability, measurement, and documentation across core processes such as coating, welding, formation, and testing. In this environment, vendors that combine hardware with machine vision, process analytics, and traceability-ready MES interfaces are positioned to defend pricing better than commodity machine builders that compete mainly on capex.
Recycling and carbon-accounting requirements are expanding the addressable scope beyond new cell output into lifecycle data capture and recovery-aligned processes. The recycling management measures effective April 1, 2026 introduce a national traceability platform and digital identity management for used power batteries, which increases demand for end-to-end serialization, labeling/marking, and data integration capabilities in upstream manufacturing equipment. In parallel, QC/T 1246-2025 becoming effective on July 1, 2026 increases the value of energy and emissions data instrumentation across electrode production and cell assembly, opening opportunities for equipment retrofits and new-line specifications that include measurement, reporting, and audit-friendly data pipelines.
Recent Industry Developments in China Battery Manufacturing Equipment Market
- July 2026: Hangke Technology announced an investment of 1.79 billion yuan to acquire a 51 percent stake in Hangke Instruments, expanding into the semiconductor testing market alongside its lithium battery equipment business. The move broadens HangKe's product footprint and creates cross selling opportunities to battery equipment clients, while diversifying revenue streams in adjacent high tech segments.
- July 2026: Hangke Technology - Invested 1.79 billion yuan to acquire a 51 percent stake in Hangke Instruments to expand into the semiconductor testing market alongside its lithium battery equipment business. The investment signals a deliberate push into semiconductor testing, which could strengthen its position in integrated equipment solutions for advanced manufacturing.
- May 2026: Wuxi Lead Intelligent Equipment signed a strategic cooperation agreement with the Beijing Humanoid Robot Innovation Center to integrate humanoid robots into new energy manufacturing production lines. The partnership advances automation capability within energy manufacturing, potentially delivering efficiency gains and differentiated offerings to customers.
China Battery Manufacturing Equipment Market Report Scope and Research Methodology
Market Definition and Coverage
This market covers equipment used inside China to manufacture rechargeable batteries, including machines used from electrode preparation through cell assembly, formation, and finishing, along with associated automation used on these lines.
Scope exclusions: We exclude battery materials, finished batteries, general factory utilities, and non-manufacturing services such as logistics and aftersales labor-only contracts.
Segments Covered in This Report
- By Battery Chemistry
- Lithium-ion
- Solid-state
- Sodium-ion
- Lead-acid
- Nickel-based
- Flow Batteries (Zn-Br, Vanadium etc.)
- By Machine Type
- Coating and Drying Systems
- Calendaring Presses
- Mixing and Homogenizers
- Slitting Machines
- Laser Notching and Cutting
- Electrode Stacking
- Vacuum Drying and Degassing
- Electro-lyte Filling
- Assembly and Handling Robots
- Formation and Testing Lines
- Packaging and Sealing
- Recycling and Black-mass Processing Equipment
- By Automation Level
- Manual/Lab-scale
- Semi-automatic
- Fully-automatic
- AI-supervised “lights-out” lines
- By End-User
- Automotive OEMs and Tier-1s
- Energy Storage System Integrators
- Consumer Electronics
- Industrial and Power Tools
- Aerospace and Defense
- Other End Users
Data Sources, Market Sizing, and Validation
Desk Research
Desk research was used to set a clear boundary for what qualifies as battery manufacturing equipment, and then to tie China demand to measurable industrial signals. We reviewed public data series and notices that reflect battery expansion activity, trade flows, and policy direction that can shape equipment ordering.
Key public inputs included sources such as the International Energy Agency for EV and battery context, China customs statistics for equipment import and export signals, Ministry of Industry and Information Technology releases for industrial policy and capacity themes, and NBS China macro series that help normalize investment cycles. We also used company filings and investor presentations to understand capex plans and typical line configurations, plus peer-reviewed papers and patent databases to sanity-check process shifts (for example, coating and formation improvements). In addition, a paid subscription for company financials and news helped track project announcements and delivery timing. These source examples are illustrative only, and many other references were also used to collect, validate, and clarify the data.
Primary Interviews and Surveys
Primary work focused on validating how equipment demand is created in China, and how ordering changes when utilization rates move or when new chemistries ramp. We spoke with a mix of equipment makers, cell manufacturers, integrators, and channel participants to confirm line-level spend patterns, lead times, localization rates, and the process steps where upgrades are happening.
Since this is a China-specific market, our outreach concentrated on domestic demand centers and export-facing supply chains, and we re-checked assumptions when feedback showed meaningful differences by plant maturity and customer type.
Distribution of primary research fieldwork respondents
| Company type | Respondent position |
|---|---|
| Top tier: 25% | CXOs: 20% |
| Mid tier: 55% | Functional/Unit leaders: 25% |
| Smaller Players: 20% | Managers: 55% |
Market-Sizing & Forecasting
Our sizing starts from a China demand pool built using a top-down approach, where planned and active battery capacity additions, typical process-step capex, and procurement timing are reconstructed into annual equipment spend. To keep the model grounded, results are then checked against selective bottom-up approximations such as sampled line cost ranges, supplier revenue exposure to China, and channel checks on delivery schedules, which are used to adjust totals where needed.
Inputs that mattered most included announced and under-construction cell capacity (in GWh), the mix of chemistries that changes the equipment set, the share of automated lines versus semi-automated lines, typical replacement and upgrade cycles, and observed order deferrals when utilization dips. Where direct values were missing, gaps were handled by using process-based spend shares and then narrowing ranges through interviews.
For forecasting, we relied mainly on scenario analysis, since equipment orders can be lumpy and tied to policy, pricing, and project readiness. Base, upside, and downside cases were built around capacity utilization recovery, pace of new plant approvals, and the speed of technology transitions, and then aligned to what respondents said is realistic for procurement and commissioning.
Data Validation & Update Cycle
Validation was done through triangulation across independent signals, and then through structured variance checks before sign-off. We compared modeled equipment spend against capex guidance, trade movement patterns, and project timelines, and then flagged outliers such as sudden step-changes in implied cost per GWh for re-review.
A second analyst review is completed to confirm that assumptions stay consistent across years and that unit economics still make sense after currency and inflation handling. Reports are refreshed annually, and interim updates are made when material events occur, such as major policy changes or large project delays. Before delivery, an analyst performs a fresh pass so clients receive the latest updated view.
Mordor Intelligence's China Battery Manufacturing Equipment Market Estimate Compared With Other Published Estimates
Published market sizes for China battery manufacturing equipment often differ because the market perimeter is easy to stretch, and because timing assumptions for orders versus deliveries are not always handled the same way. We also see gaps when studies mix domestic spending with overseas orders booked by China-based suppliers, which can shift the number even if the factory build-out inside China is unchanged.
By checking line-step capex, delivery timing, and currency conversion cutoffs, Mordor Intelligence keeps the estimate focused on equipment supplied into China plants and excludes adjacent factory infrastructure that is often bundled into broader capex totals.
Benchmark comparison
| Source | Market Size | Gaps in Research Methodology |
|---|---|---|
| Mordor Intelligence | USD 10.52 B (2026) | |
| Industry Research House A | USD 18.40 B (2026) | This estimate appears to use a wider perimeter, where battery equipment is combined with building fit-outs, utilities, and some overseas project orders linked to China-based suppliers. |
| China Trade Tracker B | USD 9.20 B (2025) | This figure looks closer to a trade and shipment proxy approach, which can miss domestically produced equipment shipped within China and can shift value depending on customs classification and invoice timing. |
The spread in the table mainly comes from what is counted as equipment spend and when the value is recognized, which matters in a market that moves in waves. Our steps make the result traceable to practical drivers like capacity additions, process-step requirements, and realistic procurement timing, and then easy to refresh when those drivers change.
Key Questions Answered in the Report
What is the current value of the China battery manufacturing equipment market?
The sector generated USD 10.52 billion in 2026 and is forecast to reach USD 14.84 billion by 2031.
Which segment is growing fastest within Chinese battery machinery demand?
Solid-state battery equipment posts the quickest 30.24% CAGR through 2031 as pilot lines transition toward commercialization.
Why are AI-supervised “lights-out” lines gaining traction?
They improve first-pass yields by 2–3 percentage points and reduce labor costs by more than 60%, enabling sub-three-year paybacks.
How will sodium-ion chemistry influence equipment procurement?
Retrofit-friendly kits allow existing lithium-ion lines to produce sodium-ion cells at 70-80% efficiency, fueling 18.66% CAGR demand from ESS integrators.
Which provinces dominate China’s battery equipment clusters?
Jiangsu and Guangdong together host more than 60.38% of installed value, while Sichuan and Inner Mongolia are emerging challengers.
What impact do U.S. and EU export controls have on Chinese equipment vendors?
Restrictions on precision coaters and laser welders add supply-chain risk, prompting accelerated domestic substitution but only shave 0.3 percentage points off forecast CAGR.