Market Overview
| Study Period | 2019 - 2030 |
| Base Year For Estimation | 2024 |
| Forecast Data Period | 2025 - 2030 |
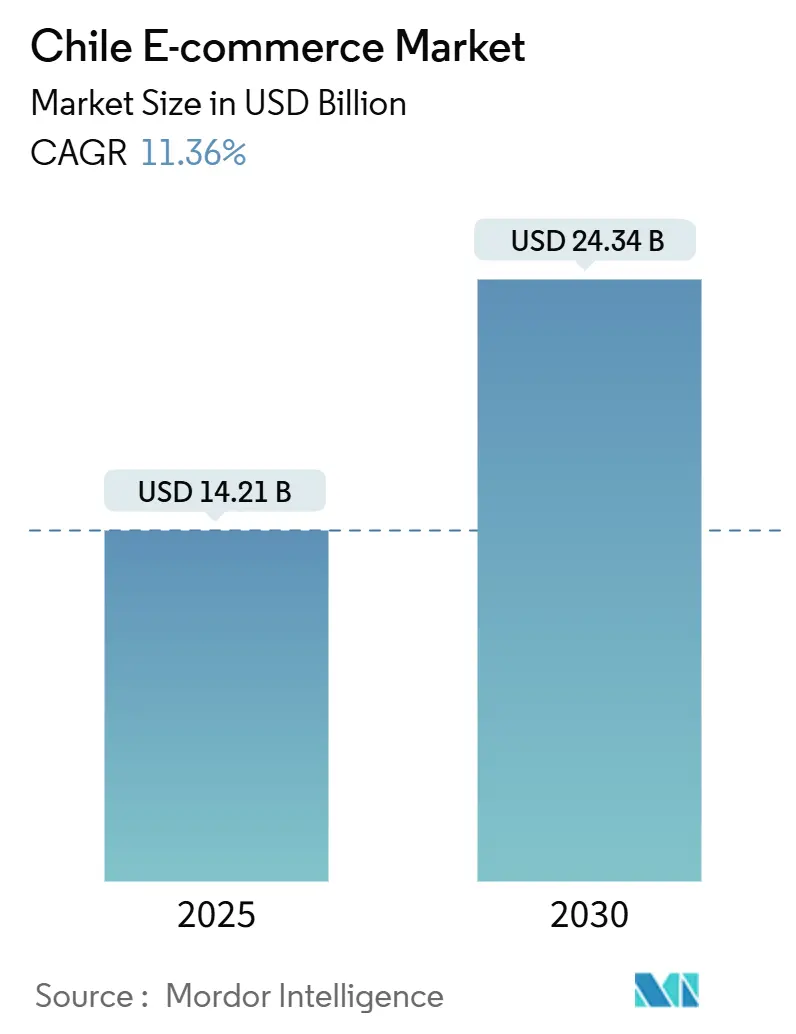
| Market Size (2025) | USD 14.21 Billion |
| Market Size (2030) | USD 24.34 Billion |
| Growth Rate (2025 - 2030) | 11.36% CAGR |
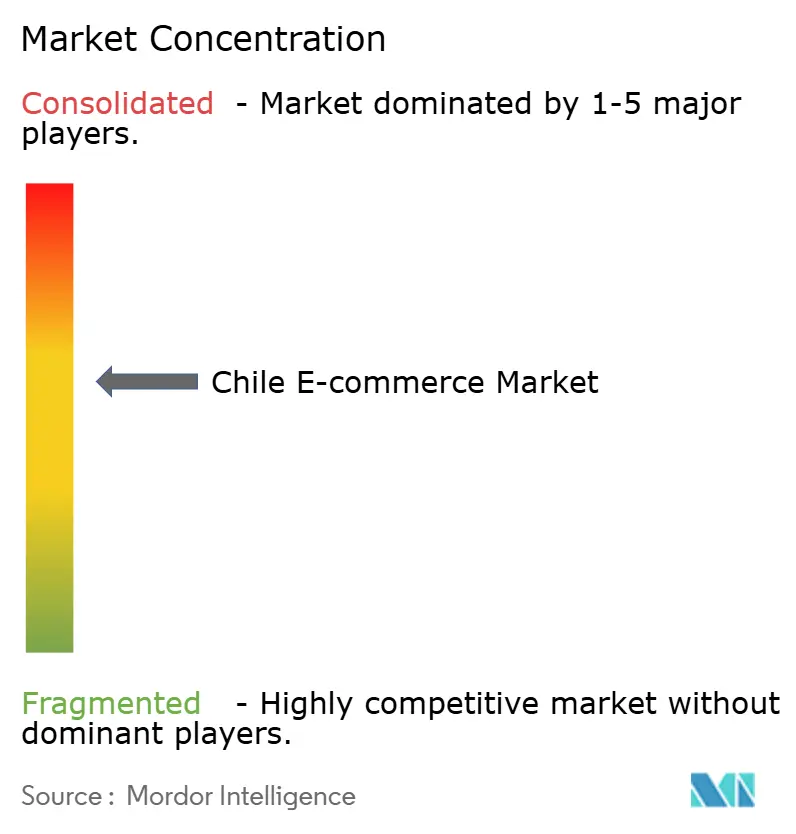
| Market Concentration | Medium |
Major Players*Disclaimer: Major Players sorted in no particular order Image © Mordor Intelligence. Reuse requires attribution under CC BY 4.0. |
|

Chile E-commerce Market Analysis by Mordor Intelligence
The Chile e-commerce market size is valued at USD 14.21 billion in 2025 and is projected to reach USD 24.34 billion by 2030, reflecting an 11.36% CAGR. Chile’s 88.3% internet penetration, nationwide 4G coverage and rapid 5G deployment underpin this trajectory, positioning the country as Latin America’s most digitally advanced consumer market.[1]Subsecretaría de Telecomunicaciones, “Conectividad 2025 Report,” subtel.gob.cl Government-backed fiber-optic expansion, strong banking penetration and a modernized payments ecosystem accelerate the migration from traditional retail to integrated omnichannel models. Continued foreign direct investment in telecommunications—over USD 3 billion since 2024—creates a dense logistics and data-center grid that lowers fulfillment costs and enhances platform reliability. Rising smartphone adoption, now responsible for 66% of transactions, amplifies the reach of digital wallets such as WebPay and MACH, while new value-added tax (VAT) rules effective January 2025 increase compliance costs for cross-border merchants but level the playing field for domestic sellers. Despite currency volatility and rural delivery inefficiencies, the Chile e-commerce market continues to attract regional expansion by global platforms and local incumbents alike.
Key Report Takeaways
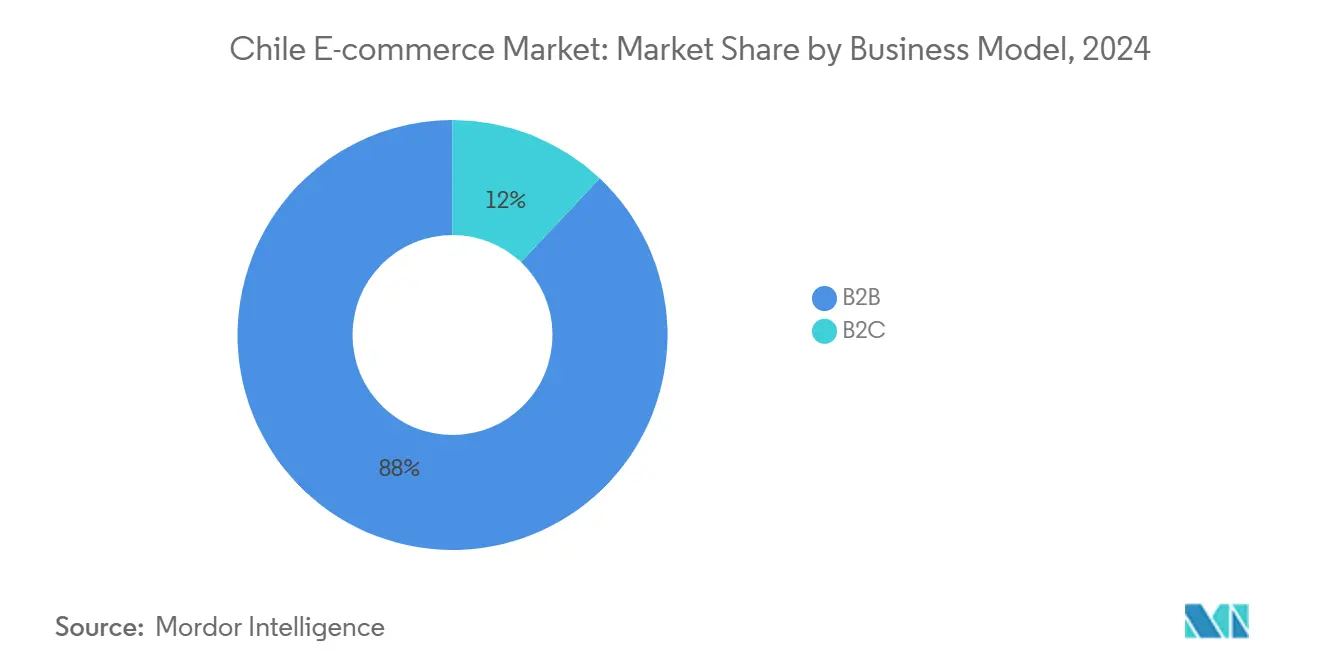
- By business model, the B2C segment held 88% of the Chile e-commerce market share in 2024, whereas B2B is set to grow at a 14.5% CAGR to 2030.
- By device type, smartphones and tablets captured 66% revenue share in 2024; desktop usage is declining while mobile sales are advancing at a 10.7% CAGR.
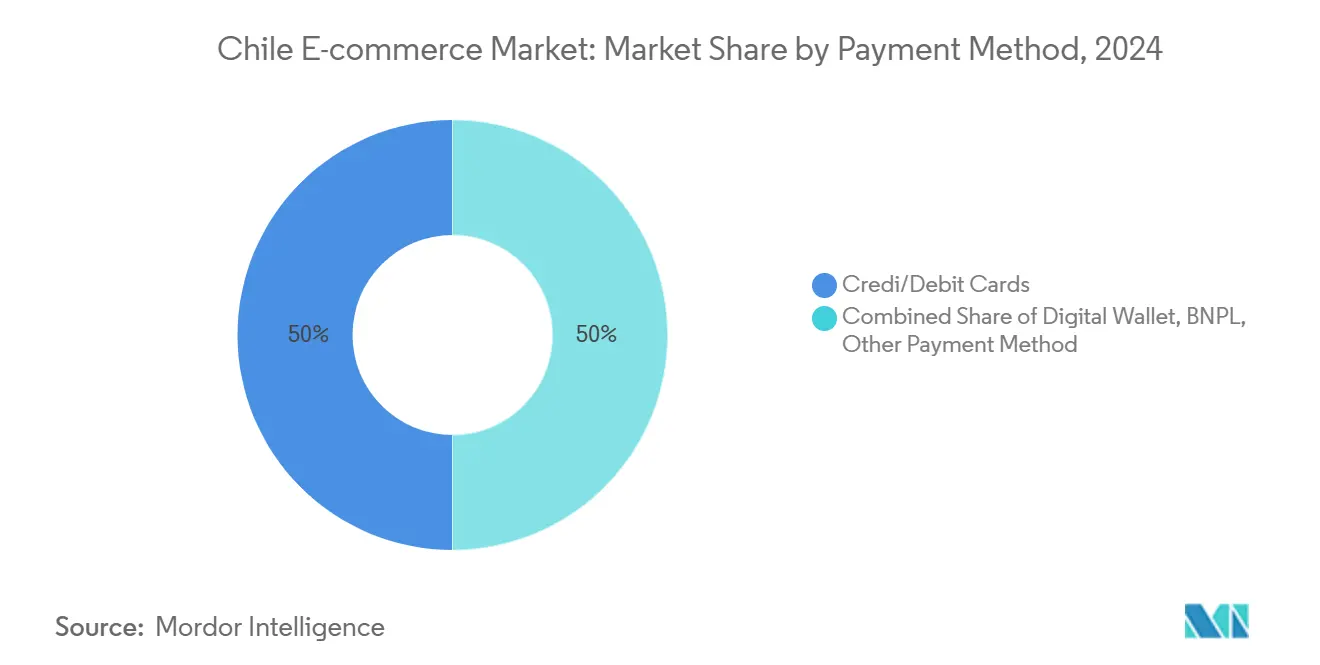
- By payment method, cards retained 50% of the Chile e-commerce market size in 2024, yet digital wallets are forecast to rise at a 16.6% CAGR through 2030.
- By product category, consumer electronics led with 22% revenue share in 2024; food and beverage is projected to expand at a 14.7% CAGR to 2030.
Chile E-commerce Market Trends and Insights
Drivers Impact Analysis
| Driver | (~) % Impact on CAGR Forecast | Geographic Relevance | Impact Timeline |
|---|---|---|---|
| Rapid Expansion of WebPay-Enabled Digital Wallets | +2.8% | National, with early gains in Santiago, Valparaíso, Concepción | Medium term (2-4 years) |
| Omnichannel Push by Chile's Top-4 Brick-and-Mortar Retailers | +2.1% | National, concentrated in urban centers | Short term (≤ 2 years) |
| 5G Roll-out Boosting Mobile Checkout Speeds | +1.9% | National, prioritizing metropolitan areas | Medium term (2-4 years) |
| Government "Chile Digital 2035" Fiber-Backhaul Investments | +1.7% | National, targeting rural connectivity gaps | Long term (≥ 4 years) |
Source: Mordor Intelligence
Rapid Expansion of WebPay-Enabled Digital Wallets
WebPay is now integrated across all major marketplaces, eliminating legacy payment friction and lifting merchant conversion rates by double digits. MACH surpassed 4 million users in 2025 with 95% satisfaction, reflecting deepening financial inclusion amid 87% bank-account penetration.[2]Banco de Chile, “MACH User Milestones 2025,” bci.cl Chile also became South America’s fourth-largest real-time payments market, processing 1.43 billion electronic transfers in 2024, which reduces cash handling and accelerates settlement cycles. As digital wallets layer loyalty, micro-credit and buy-now-pay-later (BNPL) functions onto their rails, platform stickiness rises and average order values climb. These network effects reinforce the Chile e-commerce market’s growth momentum and lower acquisition costs for both local and cross-border sellers.
Omnichannel Push by Chile’s Top-4 Brick-and-Mortar Retailers
Retail incumbents are converting stores into fulfillment nodes that shorten last-mile distances, raise same-day delivery coverage and boost click-and-collect traffic. Falabella’s Fulfillment By Falabella now supports 18% of marketplace sales with 90% post-purchase satisfaction.[3]Falabella S.A., “Fulfillment By Falabella Fact Sheet,” falabella.com Cencosud’s AI-enabled recommendation engine lifted online basket size by 12% in 2024, illustrating how data-driven personalization increases lifetime value. These initiatives also monetize idle store inventory and leverage established loyalty programs, creating high entry barriers for foreign pure-plays. Intensifying omnichannel competition forces marketplaces to differentiate through proprietary logistics, fintech add-ons and exclusive brand partnerships, thereby raising overall service standards in the Chile e-commerce market.
5G Roll-out Boosting Mobile Checkout Speeds
Telecom operators have earmarked USD 3 billion for 5G spectrum, fiber backhaul and edge nodes, promising latency below 20 milliseconds. Faster mobile sessions cut cart abandonment, especially for impulse buyers and flash-sale events. The Asia–South America Digital Gateway cable strengthens international bandwidth and lowers packet loss, encouraging cross-border purchases of high-value electronics and fashion. As video-rich product pages and AR try-on tools become mainstream, 5G enables fluid rendering on mid-range phones, driving up session duration and conversion.
Government “Chile Digital 2035” Fiber-Backhaul Investments
The initiative extends fiber spines into underserved communes, aiming to halve the rural connectivity gap by 2028. A newly established National Cybersecurity Agency coordinates threat-intel sharing, raising consumer confidence in storing card credentials online. Subsidized digital-skills programs help 55,000 SMEs adopt storefront plug-ins and cross-list on multiple marketplaces. Over the long haul, these measures are expected to unlock new seller cohorts and give the Chile e-commerce market an inclusive growth profile that balances urban scale with provincial reach.
Restraints Impact Analysis
| Restraint | (~) % Impact on CAGR Forecast | Geographic Relevance | Impact Timeline |
|---|---|---|---|
| High Inter-change & Gateway Fees Concentrated in Two PSPs | -1.4% | National, affecting all digital transactions | Short term (≤ 2 years) |
| Rural Delivery Costs in Patagonia & Extreme North | -0.9% | Regional, concentrated in remote areas | Medium term (2-4 years) |
| Persistent Cash Usage in 45+ Age Cohort | -0.7% | National, with urban-rural variations | Long term (≥ 4 years) |
Source: Mordor Intelligence
High Inter-change & Gateway Fees Concentrated in Two PSPs
A duopoly in card acquiring keeps interchange fees around 1.9% per transaction, squeezing SME margins. Because the same processors also dominate wallet top-ups, fee opacity persists, limiting the scope for dynamic discounting and installment promotions. Draft Fintech Law decrees open-banking interfaces, yet compliance grace periods delay meaningful competition.
Rural Delivery Costs in Patagonia & Extreme North
Sparse road networks, weather volatility and low stop densities inflate per-parcel costs by 40% versus Santiago. Government transport subsidies of USD 87 million focus on passengers, not freight, so e-commerce logistics remain self-funded. Consequently, bulky categories such as home appliances see slower adoption, constraining total addressable demand even as fiber connectivity improves.
Segment Analysis
By Business Model: B2B Platforms Accelerate Digital Transformation
The B2B slice of the Chile e-commerce market size is forecast to advance at a 14.5% CAGR to 2030, outpacing the consumer side that already controls 88% of 2024 sales. Procurement digitization mandates, cross-dock inventory hubs and embedded trade-credit tools attract manufacturers and distributors seeking cycle-time reductions. Large buyers favor closed-loop portals, but SME exporters migrate to public marketplaces to tap regional demand under the EU-Chile Interim Agreement.
The dominant B2C arena remains highly competitive, yet logistics density and gig-worker networks sustain profitable unit economics. Governance reforms under Law No 21.431 elevate delivery-partner costs, but platforms offset with dynamic routing and peak-pricing levers. Cross-border entrants accept lower margins to gain share, prompting domestic leaders to enhance loyalty perks and in-app financial products. These counter-moves maintain the Chile e-commerce market’s robust engagement metrics.
By Device Type: Mobile Commerce Dominance Reshapes User Experience
Smartphones and tablets represented 66% of 2024 gross merchandise value, and mobile revenue is growing at a 10.7% CAGR. This share gives handheld devices the largest Chile e-commerce market size contribution within hardware form factors. Desktop remains relevant for big-ticket B2B orders, but traffic shows a down-trend as responsive design, biometric login and one-click wallets simplify checkouts on smaller screens.
App-first players such as MercadoLibre record 72% active users transacting solely via mobile, reflecting UI investments like visual search and chat-based customer support. The 5G network roll-out accelerates adoption of video-rich, AR-enhanced browsing, further tipping the balance toward mobile interfaces. Kiosks and smart-TV commerce are experimental today, yet edge-device proliferation signals future multichannel contention.
By Payment Method: Digital Wallet Revolution Challenges Card Dominance
Cards held 50% of transaction value in 2024, but digital wallets are rising at a 16.6% CAGR. Wallets already represent 34% of the Chile e-commerce market size for payments, anchored by WebPay’s ubiquitous QR acceptance and MACH’s zero-fee peer transfers. This momentum shortens settlement cycles and curbs charge-backs.
BNPL remains marginal because credit scoring frameworks and interest-rate spreads deter usage. However, real-time payments infrastructure enables deferred debit products, and regulators are drafting disclosure rules to protect consumers. As interoperability APIs open, niche fintechs can overlay loyalty schemes onto wallet rails, eroding card preference and compressing interchange.
Note: Segment shares of all individual segments available upon report purchase
By Product Category: Food & Beverage E-commerce Leads Growth Acceleration
Food and beverage is on track to log a 14.7% CAGR through 2030, the fastest among product lines. Aggregators like Rappi and Cornershop extend cold-chain coverage and micro-fulfillment nodes within supermarket premises, shrinking delivery windows to under 60 minutes. Consumer electronics retained a 22% revenue share in 2024, the largest Chile e-commerce market share at category level, buoyed by cross-border price arbitrage and brand launches timed around Cyber events.
Fashion, boosted by fast-fashion imports, draws shoppers with predictive sizing tools, while furniture growth is capped by volumetric shipping costs. Seasonal tourism in Patagonia supplements demand for sports gear and travel accessories yet remains volatile.
Geography Analysis
Metropolitan Santiago anchors over 54% of national GMV owing to dense population, same-day delivery coverage and the presence of key fulfillment centers along Route 68. Valparaíso and Concepción follow, leveraging port connectivity and university-driven consumer bases. Together, these corridors amplify the Chile e-commerce market’s urban concentration and support parcel drop densities exceeding 3,000 deliveries per sq km.
Northern macro-zones tied to copper mining display above-average disposable income, spurring luxury and electronics uptake. Nonetheless, logistical lead times reach 4-5 days, tempering impulse-buy categories. Patagonia and the Araucanía region illustrate the rural gap: fiber projects under Chile Digital 2035 broaden access, but road distance and weather idiosyncrasies elongate last-mile costs, limiting retailer promotional breadth.
Cross-border flows are increasingly routed through bonded warehouses in the Santiago Free Zone, enabling Chinese marketplaces to promise customs-cleared 7-day delivery. The EU-Chile Interim Agreement eliminates tariffs on 99.9% of EU imports, widening product assortments in cosmetics and premium food lines. Concurrently, January 2025 VAT reforms abolish the de minimis rule, obliging all inbound parcels to pay tax and thus narrowing the landed-cost advantage previously enjoyed by ultra-low-value shipments.
Competitive Landscape
The Chile e-commerce market hosts a blend of retail stalwarts and digital-native challengers. MercadoLibre leverages its end-to-end ecosystem of marketplace, payments, credit and logistics; brand preference reached an all-time high in 2025 as monthly active fintech users grew 31%. Falabella reported a tripling of Q1 2025 profit, confirming the payoff from its logistics automation and loyalty-card integration.
Cencosud’s data-science engine drives product bundling and dynamic pricing, particularly in grocery, defending share against Rappi and Jumbo. International actors such as Shein exploit direct-from-factory supply chains to compress fashion lead times. AliExpress capitalizes on postal treaties and bonded warehousing to capture 42% of cross-border parcels, keeping ASPs low.
Strategic patterns center on three levers: 1) proprietary fulfillment that ensures service-level adherence during promotions, 2) captive wallets that turn payment data into cross-sell triggers and 3) regional alliances that diversify sourcing. Consolidation moves are plausible, yet antitrust thresholds remain vigilant. Given the top five players command about 55% of gross merchandise value, rivalry intensity remains moderate and encourages aggressive loyalty incentives rather than deep price wars.
Chile E-commerce Industry Leaders
-
Falabella
-
Ripley
-
Paris (Cencosud)
-
Walmart Chile (Lider)
-
MercadoLibre
- *Disclaimer: Major Players sorted in no particular order
Need More Details on Market Players and Competitors?
Download PDF
Recent Industry Developments
- February 2025: EU-Chile Interim Trade Agreement took effect, removing tariffs on 99.9% of EU exports and easing rules of origin.
- January 2025: Chile’s new VAT regime eliminated the de minimis threshold, requiring platforms to collect VAT on every B2C import.
- October 2024: Chile’s Congress approved a comprehensive tax-compliance bill, tightening VAT enforcement on digital platforms.
- March 2024: Chile launched a national cybersecurity strategy within Chile Digital 2035, establishing a dedicated agency for threat oversight.
Chile E-commerce Market Report Scope
E-commerce is the purchasing and selling of products and services over the Internet. It is conducted over computers, mobiles, tablets, and other smart devices. There are primarily two types of e-commerce, including Business-to-Consumer (B2C) and Business-to-Business (B2B).
The Chile E-commerce Market is segmented by B2C E-Commerce (Beauty and Personal Care, Consumer Electronics, Fashion and Apparel, Food and Beverage, Furniture and Home), and B2B E-Commerce. In addition, Toys, hobbies & DIY, Electronics & Media, Fashion, Furniture & Appliances, and Food & Personal Care account for the majority of E-commerce revenue in Chile.
| By Business Model | B2C |
| B2B | |
| By Device Type | Smartphone / Mobile |
| Desktop and Laptop | |
| Other Device Types | |
| By Payment Method | Credit / Debit Cards |
| Digital Wallets | |
| BNPL | |
| Other Payment Method | |
| By B2C Product Category | Beauty and Personal Care |
| Consumer Electronics | |
| Fashion and Apparel | |
| Food and Beverages | |
| Furniture and Home | |
| Toys, DIY and Media | |
| Other Product Categories |
By Business Model
| B2C |
| B2B |
By Device Type
| Smartphone / Mobile |
| Desktop and Laptop |
| Other Device Types |
By Payment Method
| Credit / Debit Cards |
| Digital Wallets |
| BNPL |
| Other Payment Method |
By B2C Product Category
| Beauty and Personal Care |
| Consumer Electronics |
| Fashion and Apparel |
| Food and Beverages |
| Furniture and Home |
| Toys, DIY and Media |
| Other Product Categories |
Need A Different Region or Segment?
Customize Now
Key Questions Answered in the Report
What is the current value of the Chile e-commerce market?
The market is worth USD 14.21 billion in 2025 and is projected to reach USD 24.34 billion by 2030, implying an 11.36% CAGR.
Which business model is growing fastest in Chilean e-commerce?
B2B platforms are expanding at a 14.5% CAGR through 2030 as enterprises digitize procurement and export workflows.
How dominant is mobile commerce in Chile?
Smartphones and tablets account for 66% of transaction value, with mobile sales rising at a 10.7% CAGR amid 5G roll-out.
What payment methods are gaining share?
Digital wallets are growing at a 16.6% CAGR, eating into the 50% share still held by credit and debit cards.
Which product category shows the fastest growth?
Food and beverage e-commerce leads with a 14.7% CAGR due to rapid grocery-delivery platform expansion.
How will new VAT rules affect cross-border shopping?
From January 2025 all B2C imports incur VAT, narrowing the landed-cost advantage of low-value parcels and benefiting domestic sellers.
Page last updated on: June 23, 2025

