Chaos Engineering Tools Market Size and Share
Market Overview
| Study Period | 2019 - 2030 |
|---|---|
| Market Size (2025) | USD 2.36 Billion |
| Market Size (2030) | USD 3.51 Billion |
| Growth Rate (2025 - 2030) | 8.28% CAGR |
| Fastest Growing Market | Asia Pacific |
| Largest Market | North America |
| Market Concentration | Medium |
Major Players *Disclaimer: Major Players sorted in no particular order Image © Mordor Intelligence. Reuse requires attribution under CC BY 4.0. | |

Chaos Engineering Tools Market Analysis by Mordor Intelligence
The chaos engineering tools market size reached USD 2.36 billion in 2025 and is forecast to expand at an 8.28% CAGR to USD 3.51 billion by 2030, underscoring the shift from reactive trouble-shooting to proactive resilience validation. Heightened regulatory scrutiny, escalating downtime losses, and the convergence of reliability and security testing are catalyzing tool adoption across cloud-native and legacy estates. North America continues to lead uptake on the back of mature DevOps cultures, while the European Union’s Digital Operational Resilience Act (DORA) positions resilience testing as a compliance requirement rather than a discretionary initiative. Asia-Pacific’s rapid digital transformation propels the fastest regional growth, and artificial-intelligence-driven experiment design is lowering the skills barrier that once confined chaos practices to large enterprises.
Key Report Takeaways
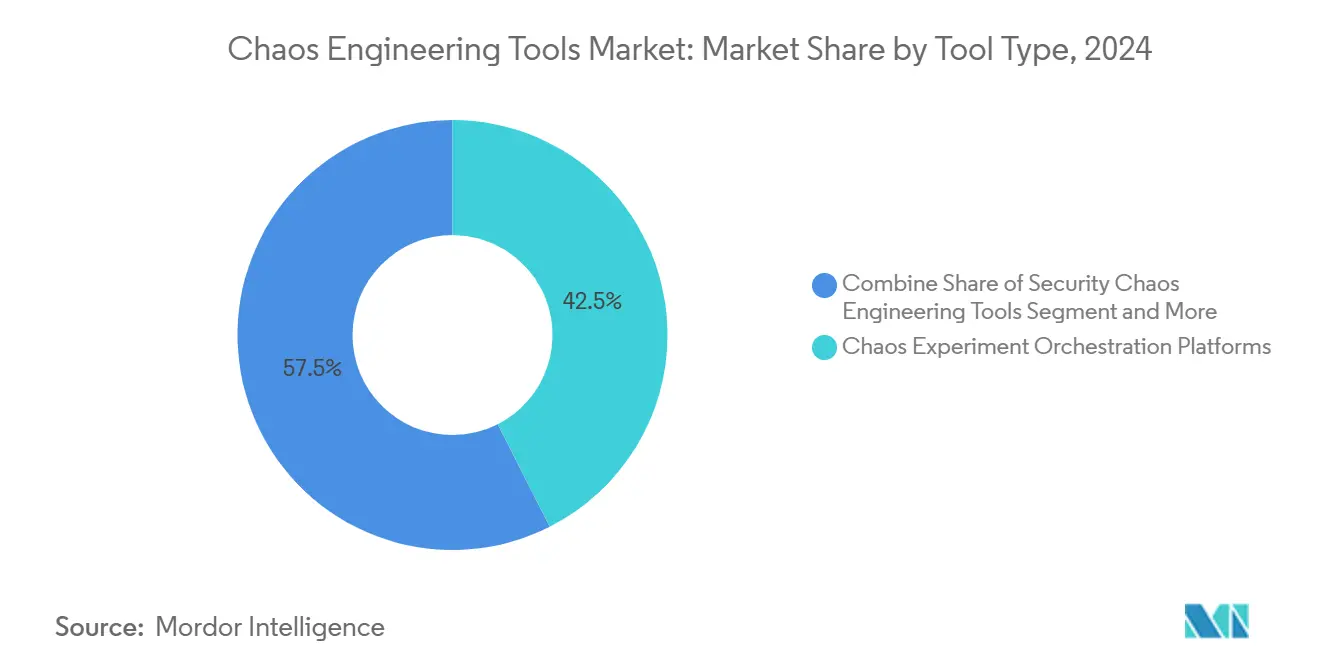
- By tool type, Chaos Experiment Orchestration Platforms commanded 42.53% of chaos engineering tools market share in 2024, while Security Chaos Engineering Tools are advancing at an 11.34% CAGR through 2030.
- By deployment mode, SaaS models contributed 56.75% of the chaos engineering tools market size in 2024; Hybrid deployments are projected to register a 10.34% CAGR to 2030,
- By end-user industry, IT and ITeS drove 29.12% revenue in 2024, whereas Healthcare and Life Sciences are on track for a 12.64% CAGR, the fastest among verticals.
- By organization size, Large Enterprises represented 54.57% of the 2024 chaos engineering tools market size, while Mid-sized Enterprises are forecast to climb at a 10.12% CAGR to 2030.
- By platform environment, Kubernetes accounted for 45.12% of chaos engineering tools market share in 2024, yet Serverless deployments are poised for a 10.55% CAGR over the forecast period.
- By geography, North America drove 38.65% revenue in 2024, whereas Asia-Pacific are on track for a 12.18% CAGR, the fastest among verticals.
Global Chaos Engineering Tools Market Trends and Insights
Drivers Impact Analysis*
| Driver | (~) % Impact on CAGR Forecast | Geographic Relevance | Impact Timeline |
|---|---|---|---|
| Growing adoption of microservices and cloud-native architectures | +2.1% | Global, concentrated in North America and EU | Medium term (2-4 years) |
| Rising cost of downtime prompting proactive reliability testing | +1.8% | Global, acute in APAC financial services | Short term (≤2 years) |
| DevSecOps and shift-left mandates embedding chaos testing | +1.5% | North America and EU leading, Asia-Pacific following | Medium term (2-4 years) |
| Digital-operational-resilience regulations (EU-DORA) | +1.2% | EU primary, global spillover | Long term (≥4 years) |
| AI-driven experiment design lowering skills barrier | +0.9% | Global, tech-forward regions | Long term (≥4 years) |
| Chaos-based reliability scores influencing cyber-insurance | +0.7% | North America and EU insurance markets | Medium term (2-4 years) |
| Source: Mordor Intelligence | |||
Growing adoption of microservices and cloud-native architectures
Microservices dismantle monoliths into interdependent services, multiplying failure pathways that conventional testing misses. Netflix’s 2024 rollout of ChAP, coupled with the Cloud Native Computing Foundation’s elevation of LitmusChaos, demonstrates how Kubernetes-native tooling is now viewed as mandatory for validating distributed applications. [1]Cloud Native Computing Foundation, “Litmus,” cncf.io “Shift-left chaos,” which inserts experiments into CI/CD pipelines, lets teams surface weaknesses pre-production and shortens incident recovery cycles. This approach resonates most in enterprises migrating legacy estates, where complexity gaps escalate outage risk and amplify the urgency for automated validation.
Rising cost of downtime prompting proactive reliability testing
The July 2024 CrowdStrike software failure inflicted USD 5.4 billion on Fortune 500 firms, exposing the macro-economic ripple of single-vendor failures.[2]Parametrix Insurance, “CrowdStrike to Cost Fortune 500 $5.4b; Insured Loss Range of $0.54b,” parametrixinsurance.com Healthcare alone absorbed USD 1.938 billion, illustrating how critical-service sectors convert reliability lapses into human safety concerns. Mid-size firms, lacking redundant buffers, now view chaos validation as insurance against existential risk. As cyber-insurance underwriters reward demonstrable resilience with premium discounts, chaos engineering tools graduate from cost center to financial hedge.
DevSecOps and shift-left mandates embedding chaos testing
Consolidated DevSecOps pipelines integrate security and resilience checks, turning isolated experimentation into continuous validation. Harness’s AI-generated test recommendations and AWS–GitLab’s integrated AI suite embed chaos scenarios at code-commit, increasing developer accountability for resilience. Security chaos engineering uncovers failure-induced attack vectors that static scanning overlooks, reinforcing the push to treat reliability and security as two sides of the same risk coin.
Digital-operational-resilience regulations (EU-DORA)
Effective January 2025, DORA compels European financial entities to evidence digital resilience through continuous “severe but plausible” scenario testing, elevating chaos engineering to a statutory obligation. The extraterritorial clause extends coverage to global vendors servicing EU banks, widening demand far beyond continental borders. Tools able to log, replicate, and report test evidence in audit-ready form are now vital for cross-jurisdiction compliance.
Restraints Impact Analysis*
| Restraint | (~) % Impact on CAGR Forecast | Geographic Relevance | Impact Timeline |
|---|---|---|---|
| Cultural resistance and skills gap in SRE teams | -1.4% | Global, acute in traditional enterprises | Short term (≤2 years) |
| Security / privacy concerns over fault-injection | -0.8% | EU and regulated industries globally | Medium term (2-4 years) |
| Budget diversion to bundled observability-AI platforms | -0.6% | North America and EU enterprise markets | Medium term (2-4 years) |
| Cloud provider API throttling for large-scale experiments | -0.4% | Global, multi-cloud deployments | Short term (≤2 years) |
| Source: Mordor Intelligence | |||
Cultural resistance and skills gap in SRE teams
Many operations teams recoil at intentionally degrading production, viewing failure creation as reputational risk rather than a learning exercise. Enterprises without mature monitoring fear uncontrolled blast radii, and the shortage of practitioners with systemic-thinking experience hampers program rollout. Gremlin’s template library and built-in guardrails mitigate some apprehension, yet sustained culture change demands executive sponsorship and iterative trust-building. [3]Gremlin, “Reliability and Chaos Engineering Platform,” gremlin.com Mid-size firms, unable to fund full-time reliability engineers, often stall at the proof-of-concept stage.
Security / privacy concerns over fault-injection
Fault scenarios that disturb storage, networking, or identity services raise alarms about data integrity and confidentiality, especially where regulated data resides. European banks must reconcile DORA’s test mandate with GDPR’s strict data-handling prescriptions, prolonging procurement cycles. Vendors respond by adding granular role-based access controls, immutable logging, and customer-managed encryption keys, yet risk-averse sectors remain cautious.
*Our forecasts treat driver/restraint impacts as directional, not additive. The impact forecasts reflect baseline growth, mix effects, and variable interactions.
Segment Analysis
By Tool Type: Orchestration Platforms Lead Integration
Chaos Experiment Orchestration Platforms controlled 42.53% of chaos engineering tools market share in 2024, reflecting buyer preference for unified experiment scheduling, safety checks, and analytics. The segment’s scale positions it to capture the largest portion of chaos engineering tools market size through 2030 as multi-cloud estates seek single-pane-of-glass oversight. Orchestration vendors bundle certificate-expiry checks and network degradations, expanding scope beyond initial infrastructure kills.
Security Chaos Engineering Tools remain the fastest-rising category at an 11.34% CAGR, fueled by DevSecOps mandates and the need to map failure states to adversarial opportunities. SDKs and fault-injection libraries hold steady appeal among developer-led initiatives, while managed chaos-as-a-service offerings attract organizations lacking internal expertise. AI-generated test blueprints are set to blur lines between orchestration and security tooling, signaling consolidation ahead.


By Deployment Mode: Hybrid Models Gain Momentum
Cloud-hosted SaaS deployments captured 56.75% of the 2024 chaos engineering tools market size, appealing to firms eager for instant onboarding without infrastructure burden. Automatic versioning, managed compliance attestations, and integration with cloud provider IAM drive preference for hosted consumption.
Hybrid deployments are expanding at a 10.34% CAGR as DORA and similar rules nudge banks and healthcare systems toward split-control architectures. Sensitive telemetry remains on-premises while orchestration runs in vendor clouds, marrying governance with elastic scalability. On-premises implementations continue in defense and energy sectors, but vendors are investing in air-gapped installers and edge-friendly agents to retain those accounts.
By End-user Industry: Healthcare Drives Unexpected Growth
IT and ITeS predictably dominated early adoption, yet the healthcare and life-sciences cohort is accelerating with a 12.64% CAGR thanks to patient-safety imperatives. Hospital chains emulate Main Line Health’s practice of testing analog workflows during simulated outages, cementing chaos engineering as a clinical-risk mitigation tool.
BFSI entities sustain high spend under regulatory compulsion, while e-commerce firms recognize that reliability correlates directly with checkout conversion. Media-streaming providers stress-test for peak sporting events, and telecom carriers model 5G radio-edge disruptions to avert subscriber churn. Manufacturing’s convergence of OT and IT prompts demand for tools versed in industrial protocols.
By Organization Size: Mid-Market Momentum Builds
Large Enterprises retained 54.57% share in 2024, leveraging dedicated SRE squads able to craft bespoke chaos libraries. Yet Mid-sized Enterprises are scaling fastest at 10.12% CAGR, aided by SaaS pricing and AI-assisted test authoring that reduce overhead. Vendors bundle guided wizards and point-in-time rollback safeguards, letting lean teams conduct safe experiments.
Small organizations remain cautious but are testing sandbox-only scenarios to prove value before wider rollouts. As community training resources multiply and insurance incentives align, adoption curves are flattening across size tiers, hinting that organization size will diminish as a predictor of chaos maturity after 2027.

By Platform Environment: Serverless Disrupts Traditional Patterns
Kubernetes retained 45.12% of chaos engineering tools market share in 2024, anchored by its role as the dominant container orchestrator. LitmusChaos’s CNCF graduation and Gremlin’s Chao release underscore continuing platform-specific innovation.
Serverless is on course for a 10.55% CAGR as event-driven workloads reveal novel failure conditions such as cold-start latency and queue poisoning. AWS’s Lambda-specific injectors usher edge cases into mainstream testing. Bare-metal and VM estates linger in regulated or performance-sensitive deployments, but multi-cloud abstractions encourage unified tooling capable of spanning heterogeneous substrates.
Geography Analysis
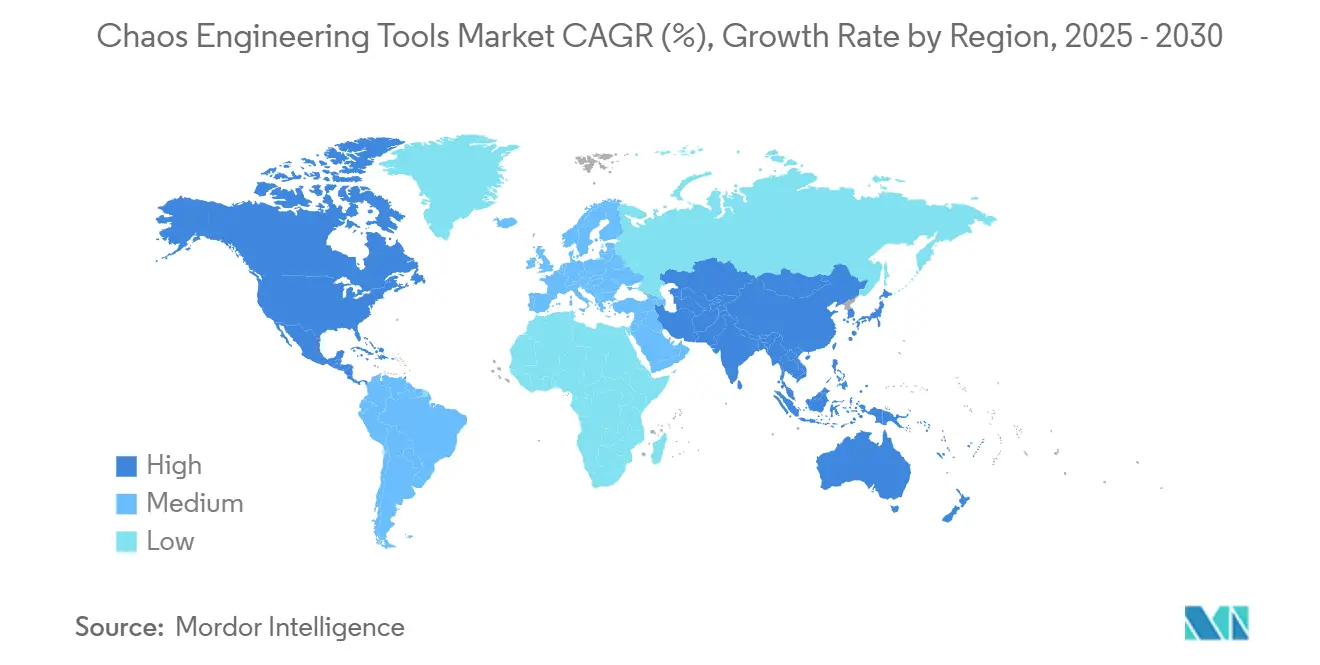
North America accounted for 38.65% of global revenue in 2024, a reflection of early-mover advantage and adjacency to hyperscale cloud ecosystems. Netflix’s Chaos Monkey heritage and venture support for vendors like Gremlin validate the region’s innovation pipeline. Cyber-insurance frameworks that reward validated resilience further entrench adoption.
Europe’s growth is policy-led: DORA’s January 2025 go-live compels banks, insurers, and ancillary service providers to embed continuous resilience testing. Hybrid deployment appeal aligns with the region’s strong data-sovereignty posture. Vendor investments such as Paladin Capital Group’s backing of Steadybit signal rising local competition.
Asia-Pacific posts the highest forecast CAGR at 12.18%, driven by aggressive cloud adoption, rising cyber-incident exposure, and supportive digital-economy agendas. A 73% surge in web attacks across the region in 2024 sharpened executive focus on fault tolerance. Japan’s positioning as OpenAI’s inaugural Indo-Pacific hub spotlights regional readiness for AI-powered tooling. Telcos in Singapore and South Korea pioneer network-lifecycle chaos to bolster 5G reliability.

Competitive Landscape
The market remains moderately fragmented. Hyperscalers integrate native fault injectors—AWS Fault Injection Simulator, Azure Chaos Studio, GCP’s Chaos-ready blueprints—leveraging platform stickiness. Specialized vendors such as Gremlin and Harness differentiate through cross-cloud breadth and deeper experiment libraries. Open-source frameworks like LitmusChaos apply pricing pressure while fostering community innovation.
AI-led automation is the emerging battleground. Harness embeds LLM-derived test recommendations, and ChaosEater’s fully automated engine promises end-to-end experiment generation. Security-centric vendors carve niches by mapping failure modes to exploit surfaces. Industrial IoT remains underserved, representing a white-space for providers able to address proprietary protocols and deterministic latency constraints.
Cloud providers wield distribution advantages but face buyer pushback on lock-in. Independent platforms counter with multi-cloud parity, policy-as-code governance, and integrations with PagerDuty or ServiceNow for incident workflows. Strategic acquisitions are expected as platforms expand into adjacent observability and remediation domains.
Chaos Engineering Tools Industry Leaders
Amazon Web Services, Inc.
Gremlin, Inc.
Microsoft Corporation
Harness, Inc.
Steadybit GmbH
- *Disclaimer: Major Players sorted in no particular order


Recent Industry Developments
- January 2025: DORA took effect, mandating resilience testing for EU financial entities
- December 2024: AWS and GitLab unveiled an integrated AI suite embedding chaos checks into secure development pipelines.
- December 2024: PagerDuty partnered with AWS to infuse generative AI into incident-response tooling.
- October 2024: Gremlin released Chao 0.10.2, extending Kubernetes-native chaos capabilities.


Global Chaos Engineering Tools Market Report Scope
| Chaos Experiment Orchestration Platforms |
| Fault-Injection SDKs and Libraries |
| Managed Chaos-as-a-Service Suites |
| Security Chaos Engineering Tools |
| Network Fault Simulators |
| Cloud-based (SaaS) |
| Self-hosted (On-premises) |
| Hybrid |
| IT and ITeS |
| BFSI |
| E-commerce and Retail |
| Media and Entertainment |
| Healthcare and Life Sciences |
| Telecom |
| Manufacturing |
| Large Enterprises |
| Mid-sized Enterprises |
| Small Enterprises |
| Kubernetes |
| VM / Bare-Metal |
| Serverless |
| Multi-cloud and Hybrid-cloud |
| North America | United States | |
| Canada | ||
| Mexico | ||
| Europe | Germany | |
| United Kingdom | ||
| France | ||
| Italy | ||
| Spain | ||
| Netherlands | ||
| Russia | ||
| Rest of Europe | ||
| Asia-Pacific | China | |
| Japan | ||
| India | ||
| South Korea | ||
| Australia and New Zealand | ||
| ASEAN | ||
| Rest of Asia-Pacific | ||
| Middle East and Africa | Middle East | Saudi Arabia |
| United Arab Emirates | ||
| Turkey | ||
| Rest of Middle East | ||
| Africa | South Africa | |
| Nigeria | ||
| Egypt | ||
| Rest of Africa | ||
| South America | Brazil | |
| Argentina | ||
| Rest of South America | ||
| By Tool Type | Chaos Experiment Orchestration Platforms | ||
| Fault-Injection SDKs and Libraries | |||
| Managed Chaos-as-a-Service Suites | |||
| Security Chaos Engineering Tools | |||
| Network Fault Simulators | |||
| By Deployment Mode | Cloud-based (SaaS) | ||
| Self-hosted (On-premises) | |||
| Hybrid | |||
| By End-user Industry | IT and ITeS | ||
| BFSI | |||
| E-commerce and Retail | |||
| Media and Entertainment | |||
| Healthcare and Life Sciences | |||
| Telecom | |||
| Manufacturing | |||
| By Organization Size | Large Enterprises | ||
| Mid-sized Enterprises | |||
| Small Enterprises | |||
| By Platform Environment | Kubernetes | ||
| VM / Bare-Metal | |||
| Serverless | |||
| Multi-cloud and Hybrid-cloud | |||
| By Geography | North America | United States | |
| Canada | |||
| Mexico | |||
| Europe | Germany | ||
| United Kingdom | |||
| France | |||
| Italy | |||
| Spain | |||
| Netherlands | |||
| Russia | |||
| Rest of Europe | |||
| Asia-Pacific | China | ||
| Japan | |||
| India | |||
| South Korea | |||
| Australia and New Zealand | |||
| ASEAN | |||
| Rest of Asia-Pacific | |||
| Middle East and Africa | Middle East | Saudi Arabia | |
| United Arab Emirates | |||
| Turkey | |||
| Rest of Middle East | |||
| Africa | South Africa | ||
| Nigeria | |||
| Egypt | |||
| Rest of Africa | |||
| South America | Brazil | ||
| Argentina | |||
| Rest of South America | |||


Key Questions Answered in the Report
What is the current value of the chaos engineering tools market?
The market reached USD 2.36 billion in 2025 and is projected to grow to USD 3.51 billion by 2030.
Which region is expanding fastest in adopting chaos testing?
Asia-Pacific leads with a 12.18% CAGR, driven by rapid digitalization and greater incident exposure.
Why is DORA important for chaos engineering adoption?
The regulation legally obliges EU financial entities to perform resilience testing, making chaos tools essential for compliance.
Which tool category is growing quickest?
Security Chaos Engineering Tools are advancing at an 11.34% CAGR through 2030.
How does AI influence chaos engineering?
Large language models automate experiment design, cutting build time and lowering the expertise threshold for new adopters.
Page last updated on:


