
Brazil Full Container Load Market Size and Share
Market Overview
| Study Period | 2021 - 2032 |
|---|---|
| Forecast Data Period | 2027 - 2032 |
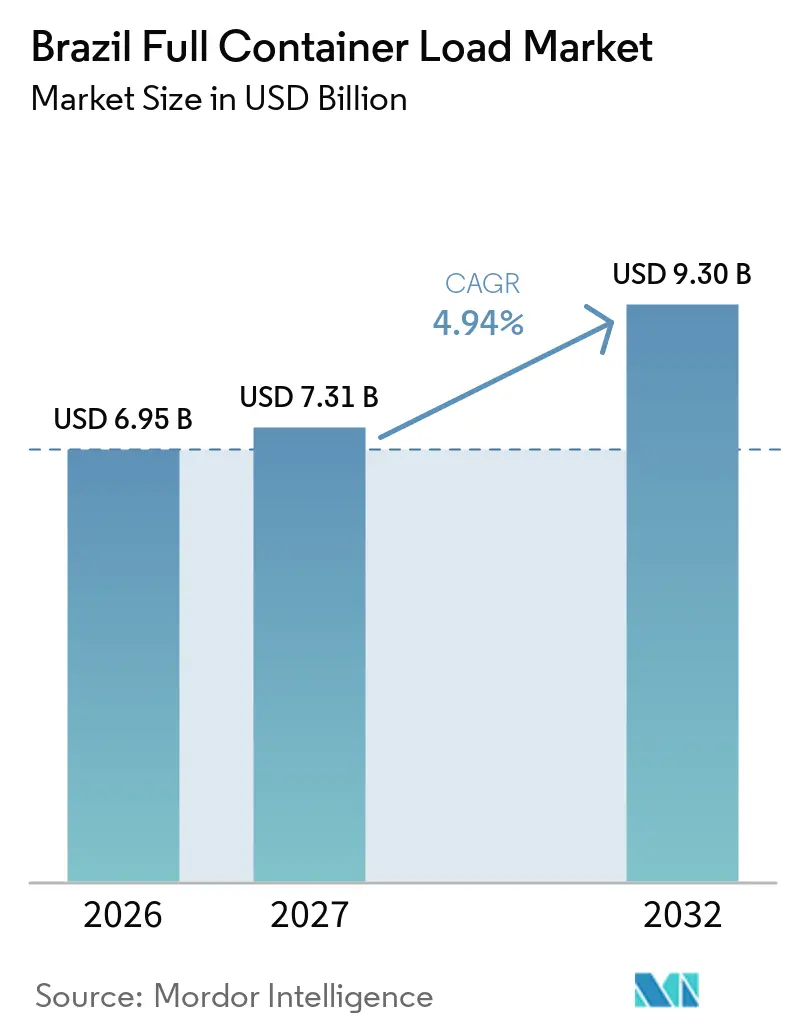
| Base Year Market Size (2026) | USD 6.95 Billion |
| Market Size (2027) | USD 7.31 Billion |
| Market Size (2032) | USD 9.30 Billion |
| Growth Rate (2027 - 2032) | 4.94 % |
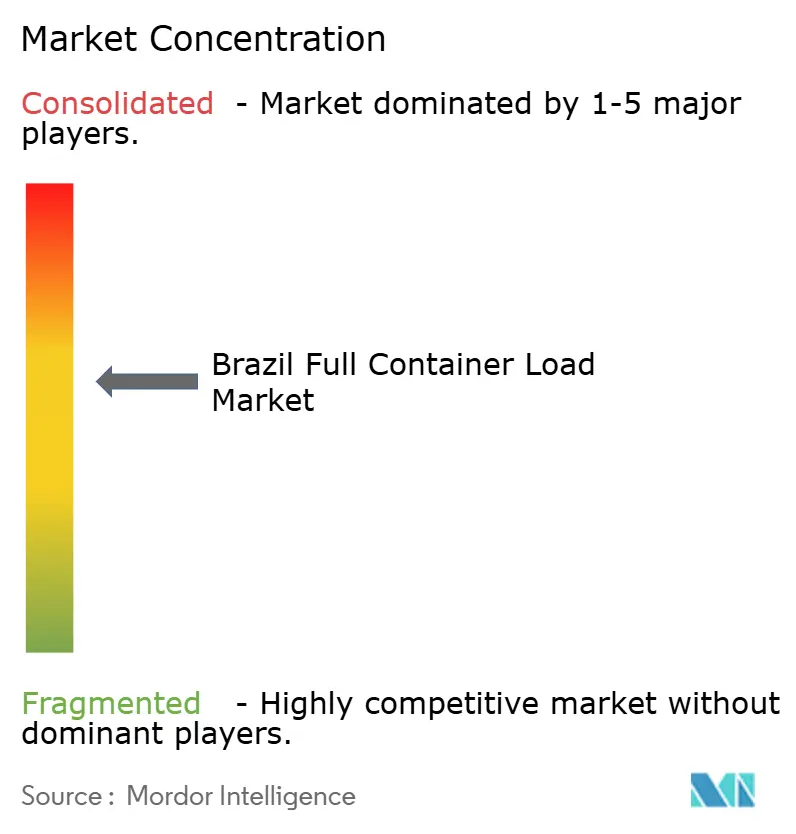
| Market Concentration | Medium |
Major Players *Disclaimer: Major Players sorted in no particular order Image © Mordor Intelligence. Reuse requires attribution under CC BY 4.0. | |
Brazil Full Container Load Market Analysis by Mordor Intelligence
The Brazil full container load market size is valued at USD 6.95 billion in 2026 and is estimated to grow from USD 7.31 billion in 2027 to reach USD 9.30 billion by 2032, at a CAGR of 4.94% during the forecast period from 2027 to 2032.
The Brazil full container load market is supported by export-oriented agricultural supply chains, import demand for industrial and consumer goods, and the concentration of container activity at major coastal gateways. Brazil’s 2025 soybean exports reached 108.2 million metric tons, which supports predictable large-lot freight demand across export corridors. Container cabotage is becoming a more relevant option for domestic distribution after the regulation of the BR do Mar program in July 2025. Terminal investment is improving capacity in Santos, Suape, and Paranaguá, although congestion and high inland transport costs remain material limits on service reliability. The Brazil full container load market also has an opening in temperature-controlled cargo, where food exports and pharmaceutical compliance requirements favor specialized services.
Key Report Takeaways
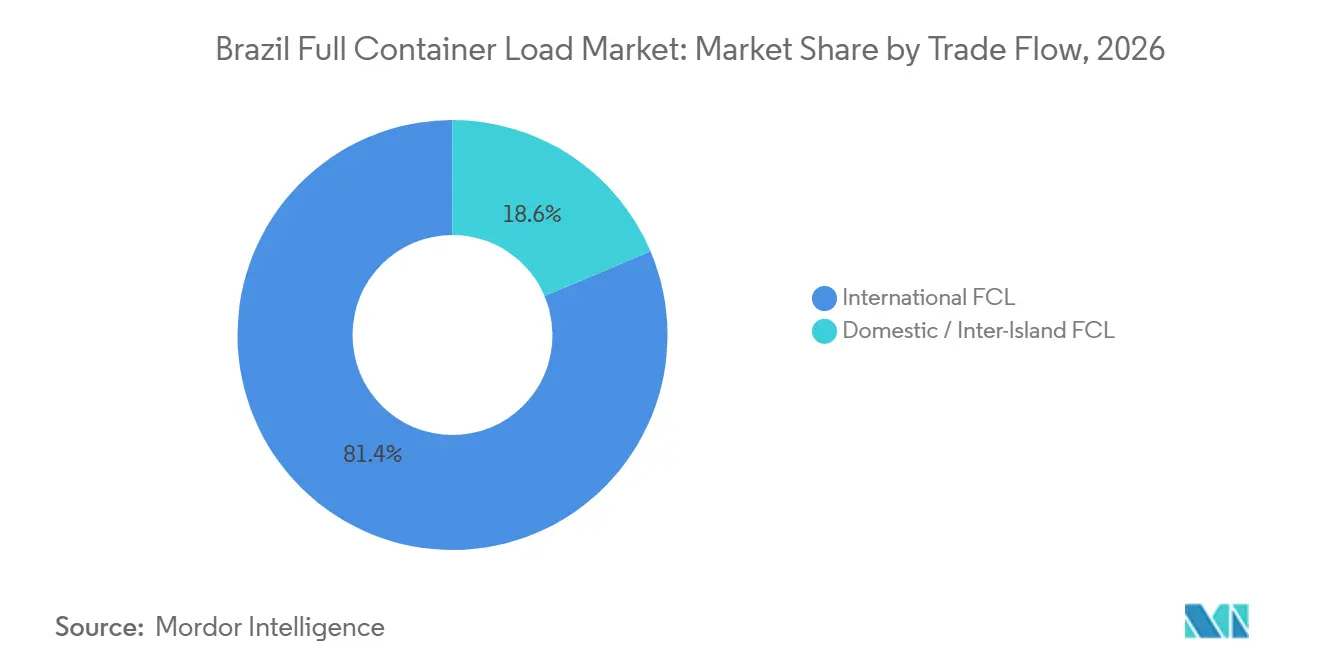
- By trade flow, international FCL accounts for 81.36% of the Brazil full container load market share in 2026, while domestic/inter-island FCL is forecast to register a 5.89% CAGR through 2032.
- By container type, dry containers account for 78.94% of the Brazil full container load market share in 2026, while refrigerated containers are projected to register at a 6.34% CAGR through 2032.
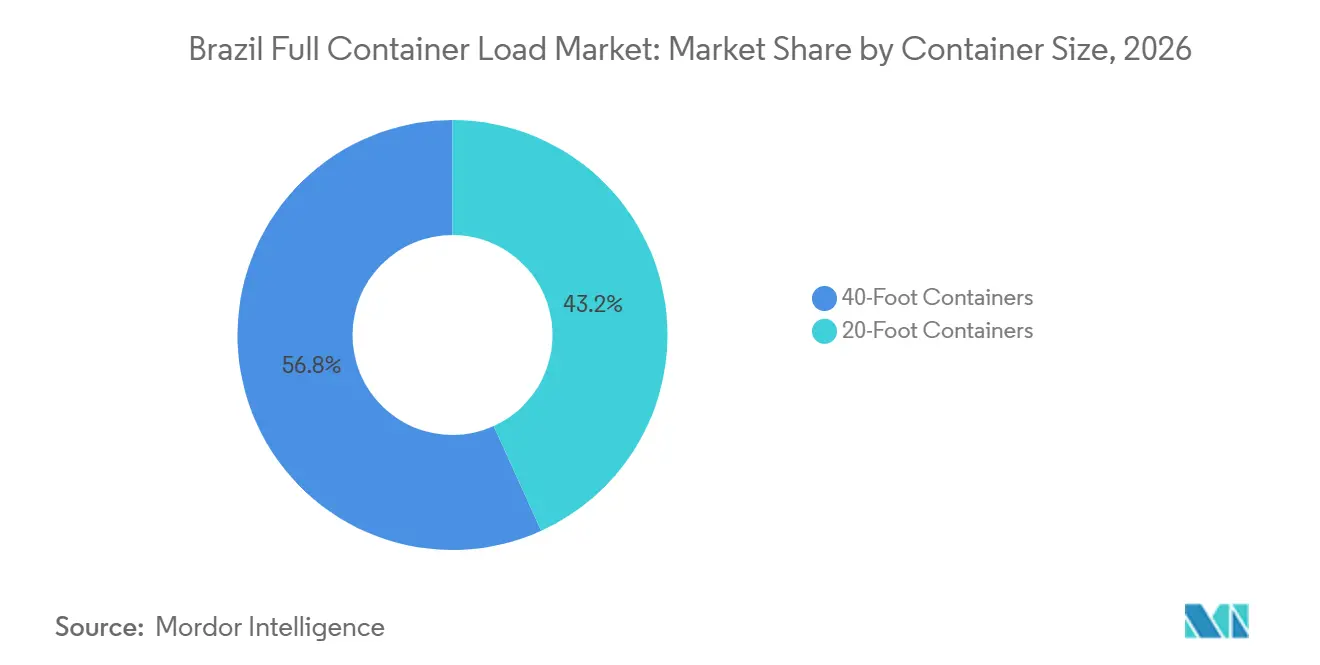
- By container size, 40-foot containers account for 56.78% of the Brazil full container load market share in 2026 and are forecast to register at a 6.23% CAGR through 2032.
- By end-user industry, food and beverage accounts for 25.54% of the Brazil full container load market share in 2026, while healthcare and pharmaceuticals are forecast to expand at a 5.97% CAGR through 2032.
- By geography, the Southeast accounts for 54.32% of the Brazil full container load market share in 2026, while the Northeast is projected to register a 5.89% CAGR through 2032.
Note: Market numbers in this report are based on Mordor Intelligence's proprietary estimation framework, which combines nine months of actuals with Q4 projections for base year 2026.
Market Trends and Insights
Drivers Impact Analysis of Brazil Full Container Load Market*
| Driver | (~) % Impact on CAGR Forecast | Geographic Relevance | Impact Timeline |
|---|---|---|---|
| Brazil-China Trade Expanding FCL Container Volumes | +1.1% | Global, with concentration at Santos, Paranaguá, and Rio Grande | Medium term (2-4 years) |
| Agricultural Exports Increasing Containerized Freight Demand | +1.0% | South, Southeast, and Central-West primary production hubs | Short term (≤ 2 years) |
| Cabotage Expansion Strengthening Domestic FCL Connectivity | +0.7% | National, with early gains at Northeast and North ports | Medium term (2-4 years) |
| Port Investment Improving Container Handling Capacity | +0.6% | Santos in the Southeast, Paranaguá in the South, Suape and Pecém in the Northeast | Long term (≥ 4 years) |
| Reefer Trade Increasing Temperature-Controlled FCL Demand | +0.5% | South and Southeast for meat and dairy, Northeast fruit corridor | Short term (≤ 2 years) |
| Digitalization Improving Container Visibility and Customs Processing | +0.4% | National, with accelerated impact at high-throughput hubs | Medium term (2-4 years) |
| Source: Mordor Intelligence | |||
Brazil-China Trade Expanding FCL Container Volumes
Trade with China is strengthening demand on Asia-to-East Coast South America routes and reinforces the Brazil full container load market’s role in long-haul container services. China was the largest containerized import source for Brazil in 2026, with 53.7% of import volume[1]. This concentration can support more direct services and larger vessel deployment because carriers can plan around fewer high-volume origin and destination pairs. Hapag-Lloyd and ZIM introduced the weekly AS3 service in September 2026, linking Chinese ports with Brazilian gateways, which shows how carriers are responding to the corridor’s commercial importance. The route’s growth also increases the value of dependable terminal calls at Santos, Paranaguá, Itajaí, Rio Grande, and Rio de Janeiro.
Agricultural Exports Increasing Containerized Freight Demand
Agricultural cargo continues to give the Brazil full container load market a broad base of export demand. Soybean exports reached 108.2 million metric tons in 2025. Meat cargo was the leading commodity group in containerized export rankings during 2025, and the pattern continued through August 2026. Paranaguá is a key outlet because TCP handles 47% of Brazilian chicken meat shipments and more than 30% of beef exports. These flows require regular availability of dry and refrigerated equipment, particularly during harvest and export peaks. The difference between import and export container flows also creates repositioning costs, which carriers may incorporate into inbound freight rates.
Cabotage Expansion Strengthening Domestic FCL Connectivity
The BR do Mar framework is broadening the role of coastal shipping in the Brazil full container load market. The government signed the implementing decree in July 2025, creating a clearer operating framework for cabotage services. ABAC figures show that container cabotage reached 1.92 million TEUs in 2025, up 23.6% year over year. Feeder activity rose 31.6%, while domestic cargo increased 15%, indicating that both international redistribution and domestic distribution are expanding. This helps link major gateways with smaller ports and can reduce reliance on long road legs for some shipments. It also gives ocean carriers more opportunities to improve utilization through multi-port services.
Port Investment and Cold-Chain Modernization Supporting Capacity
New terminal capacity and cold-chain investment can support the Brazil full container load market by improving throughput and handling options. APM Terminals opened Suape in September 2026 after investing more than USD 350 million, adding annual capacity of 400,000 TEUs and expanding the Suape Complex by 55%. The company describes the facility as Latin America’s first fully electrified container terminal, with more than 300 reefer plugs for refrigerated cargo. DP World approved BRL 1.6 billion (USD 296 million) to raise Santos capacity from 1.7 million to 2.1 million TEUs by 2028. ANVISA requirements for temperature control and documentation in pharmaceutical logistics also support the use of specialized reefer equipment. Digital customs and visibility tools can complement these physical investments when operators connect clearance information with container planning.
Restraints Impact Analysis of Brazil Full Container Load Market*
| Restraint | (~) % Impact on CAGR Forecast | Geographic Relevance | Impact Timeline |
|---|---|---|---|
| Port Congestion Reducing Schedule Reliability During Peaks | -0.9% | Santos in the Southeast primarily, with secondary impact at Paranaguá and Rio de Janeiro | Short term (≤ 2 years) |
| Inland Logistics Costs Increasing Door-to-Port Expenses | -0.7% | Central-West and North, with long hauls to the coast and national effects | Medium term (2-4 years) |
| Documentation Complexity Delaying Container Clearance Processes | -0.5% | National, with concentration at Santos and its industrial hinterland | Medium term (2-4 years) |
| Equipment Imbalances Increasing Repositioning and Detention Costs | -0.3% | Ports with high agricultural exports relative to import volumes | Medium term (2-4 years) |
| Source: Mordor Intelligence | |||
Port Congestion Reducing Schedule Reliability During Peaks
Congestion remains a material operational limit for the Brazil full container load market, especially at Santos. Santos recorded a 65% vessel delay rate in December 2025 and waiting times of up to 82 days in extreme cases during late 2025. It also reports daily vessel costs of USD 60,000 to USD 100,000, which can increase shipper costs when delays persist. Handling costs at Santos reached USD 500 per TEU in 2026. Delays can lead shippers to book excess space and allow more dwell time, which keeps equipment tied up longer. This cycle affects service reliability and may push cargo toward alternative gateways when schedules permit.
Inland Costs, Documentation, and Equipment Imbalances
Long distances between inland production areas and coastal terminals constrain the Brazil full container load market. The Central-West faces a particular challenge because road distances to the main ports can exceed 1,000 km[2]. Rumo’s Mato Grosso railway project was 80% complete in early 2026, and its first 162-kilometer phase was expected to begin operating in the second half of 2026. Documentation requirements can further delay clearance where data is incomplete or systems are not integrated. Import-heavy trade patterns and export peaks also create equipment imbalances that raise repositioning and detention costs.
*Our forecasts treat driver/restraint impacts as directional, not additive. The impact forecasts reflect baseline growth, mix effects, and variable interactions.
Brazil Full Container Load Market Segment Analysis
By Trade Flow:
International Services Retain the Largest Role While Cabotage Gains GroundInternational FCL accounts for 81.36% of the Brazil full container load market share in 2026. Its position reflects Brazil’s links with Asia-Pacific, Europe, North America, and Mercosur routes. Export flows include soybeans, meat, coffee, cotton, pulp, and other agricultural and industrial goods. Imports of consumer products and industrial inputs also require international container services. Containerized export and import volumes were higher in the first eight months of 2026 than in the corresponding 2025 period. This balance of export and import traffic supports a large international service base.
Domestic/inter-island FCL is projected to register a 5.89% CAGR from 2027 to 2032. The segment is supported by cabotage services that move containers between large hubs and secondary ports. ABAC reported 1.92 million TEUs of container cabotage in 2025, up 23.6% year-over-year[3]. Feeder services can distribute international cargo after it reaches major ports, while domestic cargo can shift from road transport to coastal shipping. This can benefit consumer goods, electronics, and industrial inputs moving between regions. Broader domestic connectivity may also improve utilization for carriers that serve both domestic and international routes.

By Container Type:
Dry Equipment Leads While Refrigerated Capacity ExpandsDry containers account for 78.94% of the Brazil full container load market size in 2026. Standard boxes support grains, cotton, pulp, sugar, manufactured imports, and a range of general cargo. Their flexibility and wide availability make them suitable for large-volume export and import flows. Tank containers and special equipment serve smaller chemical, project cargo, and liquid bulk requirements. Standard 20-foot and 40-foot boxes also fit the handling systems used by Brazil’s largest terminals. This established equipment base keeps dry containers at the center of overall volumes.
Refrigerated containers are forecast to register a 6.34% CAGR through 2032, the fastest rate among container types. TCP’s concentration of chicken and beef cargo shows why reefer availability matters at southern export gateways. ANVISA regulations RDC 430/2020 and RDC 653/2022 require temperature monitoring, validation, and documentation for pharmaceutical transport. These compliance requirements favor purpose-built cold-chain solutions over ambient equipment.
By Container Size:
Forty-Foot Units Combine Scale and Faster Growth40-foot containers account for 56.78% of the Brazil full container load market share in 2026. They are also forecast to register a 6.23% CAGR through 2032. Their scale lowers the cost per cubic meter for many high-volume agricultural and industrial shipments. This makes the format well suited to export flows that need more cubic capacity. Larger units can also improve handling efficiency when terminals and carriers plan around consistent cargo configurations. These advantages explain why the same segment leads both current share and forecast growth.
Twenty-foot containers remain important for high-density cargo such as metal components, chemicals, and some perishable loads. They can also be useful where slot availability or port clearance conditions favor smaller units. Larger vessels on Asia to East Coast South America routes encourage carriers to improve crane productivity and slot economics. This supports the continuing importance of 40-foot equipment across the Brazil full container load market.
By End-User Industry:
Food and Beverage Provides Volume While Healthcare Adds Specialized DemandFood and beverage accounts for 25.54% of the Brazil full container load market share in 2026. Exports of meat, soy-based products, coffee, sugar, and processed foods support the segment. These cargoes depend on crop cycles, export schedules, and terminal availability. Meat and pulp are among the leading contributors to Brazil’s agribusiness trade. Food shipments can require dry or refrigerated equipment depending on the product. Peak export periods can therefore raise demand for equipment, labor, gate access, and vessel slots at the same time.
Healthcare and pharmaceuticals are forecast to register at a 5.97% CAGR through 2032. This segment needs validated temperature management, mapping, monitoring, and documentation under ANVISA requirements. Those requirements distinguish pharmaceutical logistics from standard ambient container movement. Specialized reefer FCL services can command greater operational attention because cargo integrity is critical. The Brazil full container load industry also serves manufacturing, retail, automotive, chemicals, electronics, agriculture, forestry, and other end users. Import-focused sectors are particularly exposed to industrial investment cycles and the availability of inbound equipment.
Geography Analysis
The Southeast accounts for 54.32% of the Brazil full container load market share in 2026. The region combines Brazil’s largest industrial and consumer base with the country’s leading container gateway at Santos. The Port Authority of Santos recorded 186.4 million tons of total cargo in 2025 and set out plans to expand capacity. DP World is investing BRL 1.6 billion (USD 296 million) to expand its Santos terminal from 1.7 million to 2.1 million TEUs by 2028. The planned Tecon Santos 10 concession is also central to the region’s future capacity. ANTAQ’s concession framework influences the timing of berth and terminal projects. High handling costs and congestion still create an incentive for shippers to consider alternative ports when routing options allow.
The Northeast is expected to register at a 5.89% CAGR through 2032, supported by new terminal and distribution capacity. APM Terminals Suape began operations in September 2026 after a USD 350 million investment. The terminal has 400,000 TEUs of initial annual capacity and more than 300 reefer plugs, which directly support food and pharmaceutical cargo. Pecém handled a record 706,524 TEUs in 2025, and APM Terminals linked this result to a new deep-sea Asia service. Maersk opened a distribution center near Suape in July 2026, connecting ocean, cabotage, inland transport, and warehousing[4]. These developments can reduce the need to route every shipment through the Southeast. The region’s electrified terminal capacity is also a practical response to customers seeking lower-emission logistics options.
The South, North, and Central-West operate as connected demand and supply corridors rather than as a single port system. Paranaguá is important for agribusiness cargo, and CMPort has announced an expansion program there. The North benefits from growing cabotage links that connect domestic markets and coastal gateways. The Central-West has no seaport but remains a major demand generator for export containers through Santos, Paranaguá, and northern arc ports. Rail projects such as the Mato Grosso State Railway can reduce dependence on long truck movements when the next stages enter service. The Brazil full container load market therefore depends on better integration between inland rail, road, waterways, and coastal terminals.
Competitive Landscape
The Brazil full container load market is consolidated and includes global ocean carriers, terminal operators, domestic carriers, and freight forwarders. CMA CGM completed the acquisition of a 51% controlling stake in Santos Brasil in 2025, giving it a stronger position in terminal operations at the country’s main container gateway. This transaction links terminal access with ocean freight and logistics capabilities. Maersk is expanding its integrated logistics network through the USD 350 million APM Terminals Suape project, new depots in Rio Grande and Paranaguá, and a distribution center near Suape. These moves show that leading carriers are seeking more control over the inland and terminal steps surrounding ocean transport. They also raise the importance of coordination between shipping lines, terminals, customs processes, and cargo owners.
Hapag-Lloyd and ZIM launched the AS3 service in September 2026, linking Shanghai, Ningbo, Xiamen, Hong Kong, and Yantian with major Brazilian ports. The proposed Hapag-Lloyd acquisition of ZIM was under Brazilian antitrust review in August 2026. Competitive effects will depend on the regulator’s assessment of route overlaps and capacity allocation. DP World and Hapag-Lloyd also renewed their Santos operating partnership for 10 years in October 2025. Long-term terminal partnerships can improve planning certainty for both operators and shippers.
Freight forwarding remains more dispersed than carrier and terminal ownership. Specialized healthcare and pharmaceutical services remain an important area because ANVISA compliance requires proven cold-chain processes. DHL’s work with SkyCell demonstrates how value-chain firms are adapting temperature-controlled services for South America. Brazil Customs is also evaluating digital tools for customs applications, including blockchain-related work reviewed in a July 2025 World Customs Organization study mission. Operators that combine reliable clearance data with equipment visibility may offer a clearer service proposition to time-sensitive shippers.
Brazil Full Container Load Industry Leaders
-
Mediterranean Shipping Company SA
-
A.P. Moller - Maersk
-
CMA CGM SA (including CEVA Logistics)
-
Hapag-Lloyd AG (including Norcoast joint venture)
-
Asia Shipping
- *Disclaimer: Major Players sorted in no particular order
Brazil Full Container Load Market Companies Covered in this Report
- Mediterranean Shipping Company SA
- A.P. Moller - Maersk
- CMA CGM SA (including CEVA Logistics)
- Hapag-Lloyd AG (including Norcoast joint venture)
- COSCO SHIPPING Lines Co. Ltd
- Ocean Network Express
- Evergreen Marine Corp.
- HMM
- ZIM Integrated Shipping Services
- Yang Ming Marine Transport Corp.
- Pacific International Lines
- DSV (including Schenker)
- Kuehne+Nagel International AG
- DHL Group
- Asia Shipping
- GEODIS
- Expeditors International of Washington, Inc.
- Allog Group
- NX Group
- Rhenus Group
- Hellmann Worldwide Logistics
- DC Logistics Brasil
Recent Industry Developments in Brazil Full Container Load Market
- October 2026: DP World received two ship-to-shore quay cranes and six electric rubber-tired gantry cranes at its Santos terminal as part of a BRL 1.6 billion (approximately USD 310 million) expansion program. The equipment is expected to increase annual container-handling capacity to 1.7 million TEUs by the end of 2026, strengthening FCL cargo-handling efficiency.
- September 2026: Hapag-Lloyd and ZIM jointly launched the weekly AS3 Asia-South America East Coast service, with an inaugural westbound departure from Shanghai. The service connects Shanghai, Ningbo, Xiamen, Hong Kong, and Yantian with Rio Grande, Paranaguá, Itajaí, Santos, and Rio de Janeiro, deploying vessels with an average capacity of 6,500 TEU.
- September 2026: APM Terminals Suape began commercial operations at the Port of Suape, Pernambuco, welcoming its first vessel. The USD 350 million terminal is Latin America's first fully electrified container facility, with an initial annual capacity of 400,000 TEUs, a 55% increase for the Suape Complex, and more than 300 reefer plugs for refrigerated FCL cargo.
- July 2026: Maersk opened a new distribution and warehousing center in Cabo de Santo Agostinho, Pernambuco, 20 km from the Port of Suape. The 11,920 m² facility has 36 loading docks, 11,297 pallet positions, and 100% electric material-handling equipment.
Brazil Full Container Load Market Report Scope
Segmentation Overview
| Domestic / Inter-Island FCL | |
| International FCL | Import Flow |
| Export Flow |
| Dry Containers |
| Refrigerated Containers |
| Tank Containers |
| Special Equipment Containers |
| 20-Foot Containers |
| 40-Foot Containers |
| Manufacturing and Industrial |
| Retail and Consumer Goods |
| Food and Beverage |
| Automotive and Components |
| Chemicals and Petrochemicals |
| Electronics and Electrical |
| Agriculture and Forestry |
| Healthcare and Pharmaceuticals |
| Other End Users |
| North |
| Northeast |
| Central-west |
| Southeast |
| South |
| By Trade Flow | Domestic / Inter-Island FCL | |
| International FCL | Import Flow | |
| Export Flow | ||
| By Container Type | Dry Containers | |
| Refrigerated Containers | ||
| Tank Containers | ||
| Special Equipment Containers | ||
| By Container Size | 20-Foot Containers | |
| 40-Foot Containers | ||
| By End-User Industry | Manufacturing and Industrial | |
| Retail and Consumer Goods | ||
| Food and Beverage | ||
| Automotive and Components | ||
| Chemicals and Petrochemicals | ||
| Electronics and Electrical | ||
| Agriculture and Forestry | ||
| Healthcare and Pharmaceuticals | ||
| Other End Users | ||
| By Region | North | |
| Northeast | ||
| Central-west | ||
| Southeast | ||
| South | ||
Key Questions Answered in the Report
What is the forecast for the Brazil full container load market?
The sector is forecast to rise from USD 7.31 billion in 2027 to USD 9.30 billion by 2032, at a 4.94% CAGR.
Which trade flow has the largest share in Brazil’s FCL sector?
International FCL accounts for an 81.36% share in 2026, reflecting the importance of export and import routes.
What is driving refrigerated container demand in Brazil?
Meat exports and pharmaceutical requirements for temperature monitoring and validation support refrigerated container demand.
Why is the Northeast gaining relevance for container logistics?
Suape and Pecém are adding capacity, direct services, cold-chain infrastructure, and logistics facilities.
What are the main operational constraints for FCL shippers in Brazil?
Congestion at Santos, high inland transport costs, clearance complexity, and equipment imbalances can increase costs and reduce reliability.
How is cabotage affecting domestic container transport in Brazil?
BR do Mar supports broader coastal shipping, and container cabotage reached 1.92 million TEUs in 2025.