
Biomethane Market Size and Share
Market Overview
| Study Period | 2022 - 2032 |
|---|---|
| Market Size (2027) | USD 18.18 Billion |
| Market Size (2032) | USD 27.10 Billion |
| Growth Rate (2027 - 2032) | 8.30 % |
| Fastest Growing Market | Asia-Pacific |
| Largest Market | Europe |
| Market Concentration | Medium |
Major Players *Disclaimer: Major Players sorted in no particular order Image © Mordor Intelligence. Reuse requires attribution under CC BY 4.0. | |
Biomethane Market Analysis by Mordor Intelligence
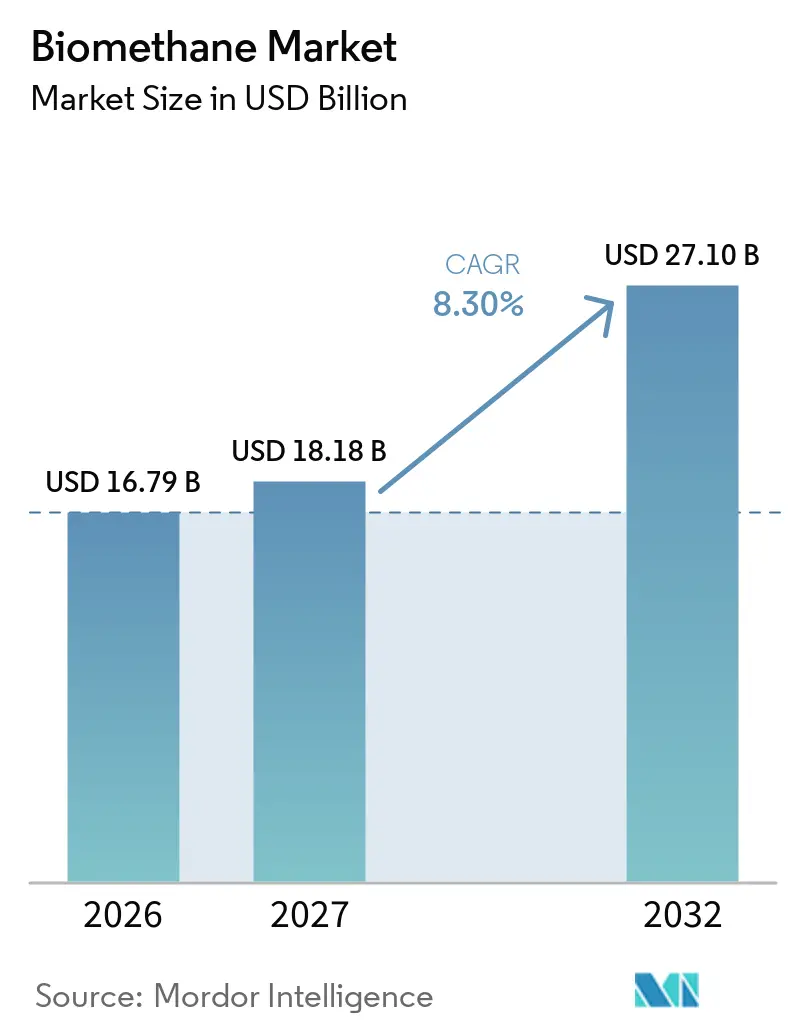
The Biomethane Market size is expected to grow from USD 16.79 billion in 2026 to USD 18.18 billion in 2027 and is forecast to reach USD 27.10 billion by 2032 at 8.30% CAGR over 2027-2032. Demand is rising because industrial users, transport operators, and utilities need renewable gas that can move through established gas infrastructure and that can be documented against increasingly specific emissions requirements. Producers are also widening their feedstock base beyond conventional farm residues to include sewage sludge, municipal organics, and food-processing waste, giving the global biomethane market more potential supply routes across varied local waste systems, an advantage for the global biomethane market. In Germany, biomethane injected into the grid reached 12.3 TWh in 2025, up 12% from the prior year, as building efficiency rules and expiring feed-in contracts encouraged some operators to shift from power generation to gas injection. The global biomethane market is also moving toward longer-term purchase agreements, which provide clearer revenue visibility for producers, more predictable renewable-gas supply for buyers, and a clearer basis for lenders assessing new plants and project sponsors considering investments across multiple facilities. Feedstock competition, permitting delays, and local grid connection limits remain important constraints on project delivery, especially where production sites sit far from gas distribution networks and cannot readily access a practical alternative use for the gas.
Key Report Takeaways
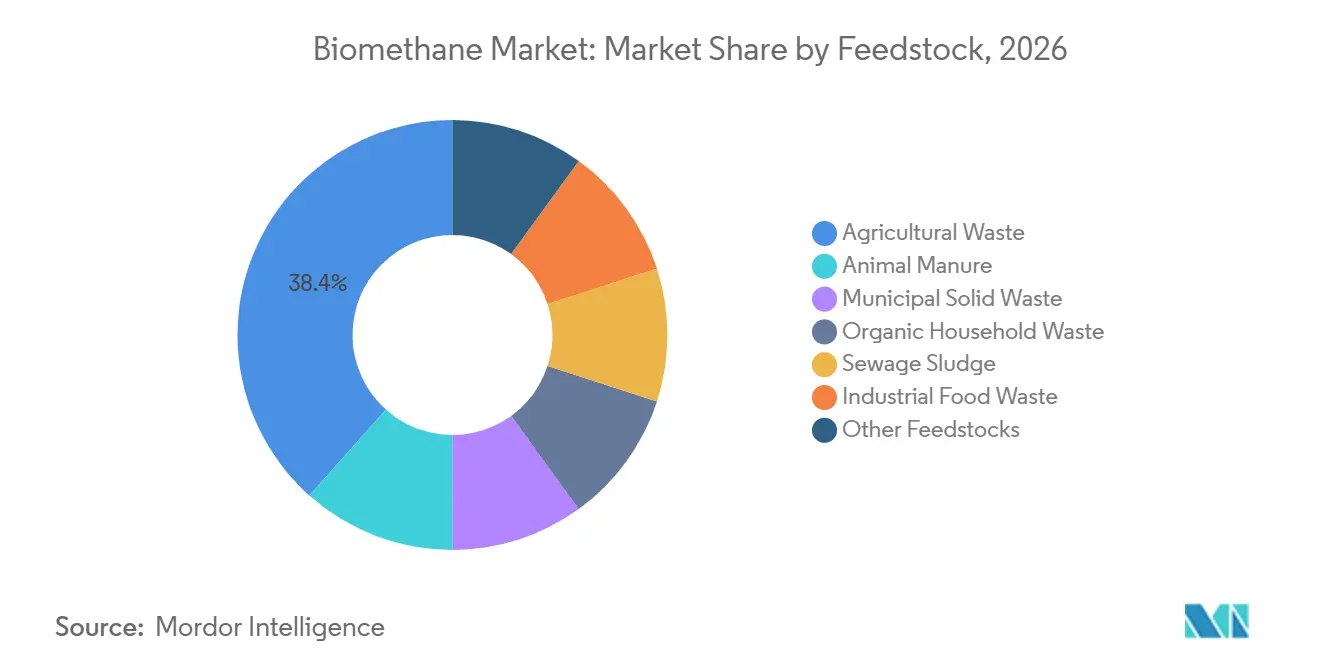
- By feedstock, agricultural waste held 38.4% of the global biomethane market share in 2026, while industrial food waste is forecast to grow at an 8.7% CAGR through 2032.
- By production process, anaerobic digestion accounted for 72.3% of the global biomethane market share in 2026, while thermal gasification is forecast to expand at a 9.8% CAGR through 2032.
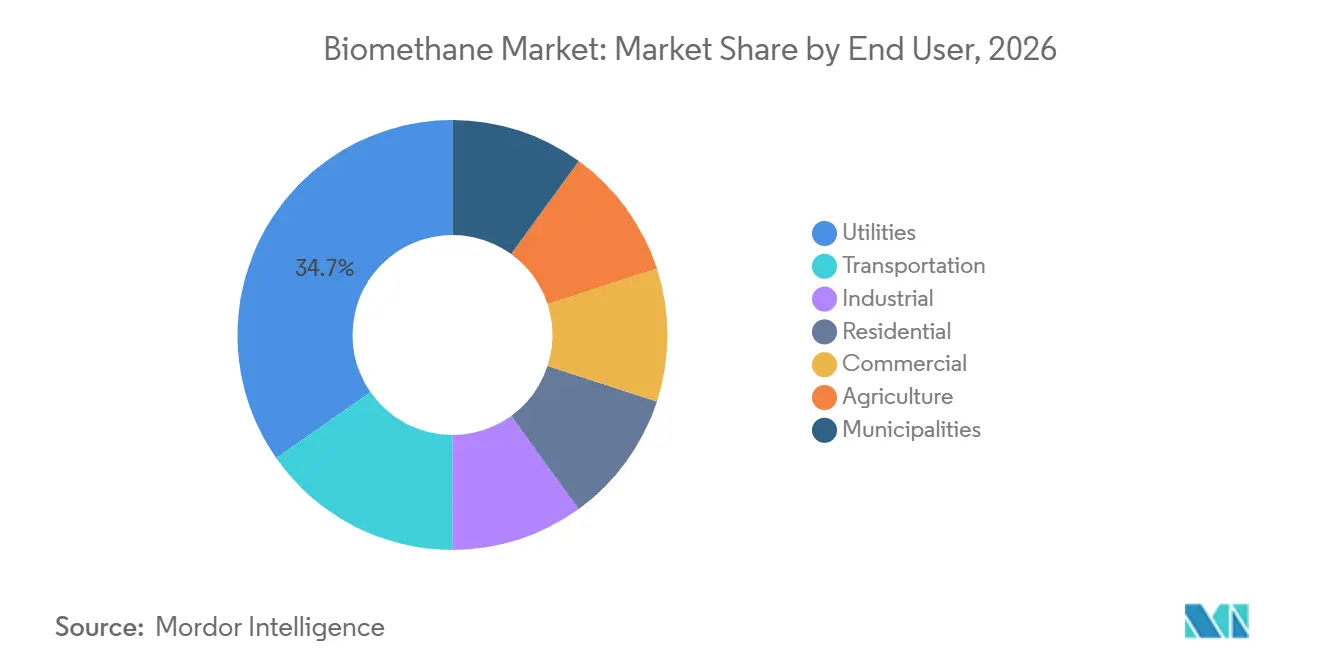
- By end user, utilities held 34.7% share in 2026, while transportation recorded the highest projected CAGR at 9.2% through 2032.
- By geography, Europe accounted for 35.1% share in 2026, while Asia-Pacific is forecast to grow at a 9.6% CAGR through 2032.
Note: Market numbers in this report are based on Mordor Intelligence's proprietary estimation framework, which combines nine months of actuals with Q4 projections for base year 2026.
Market Trends and Insights
Drivers Impact Analysis of Biomethane Market*
| Driver | (~) % Impact on CAGR Forecast | Geographic Relevance | Impact Timeline |
|---|---|---|---|
| Decarbonization Of Hard-To-Electrify Sectors | +2.1% | Global, concentrated near-term in EU industrial clusters and North American dairy and food belts | Medium term (2-4 years) |
| Renewable Gas And Energy-Security Policies | +1.8% | Europe, with early-stage activity in India and Japan | Short term (≤ 2 years) |
| Waste-To-Energy And Methane-Abatement Mandates | +1.5% | Global, including the United States, Europe, and India | Short term (≤ 2 years) |
| Transport Fuel Credit And Certification Stacking | +1.2% | North America and Europe, with pilots in Singapore and South Korea | Medium term (2-4 years) |
| Industrial Demand For Certified Low-Carbon Molecules | +0.9% | Japan and South Korea, with links to Middle East and Africa LNG corridors | Long term (≥ 4 years) |
| Expansion Of Liquefied Biomethane For Shipping | +0.8% | Rotterdam, Hamburg, Japan, and Singapore | Medium term (2-4 years) |
| Source: Mordor Intelligence | |||
Decarbonization Of Hard-To-Electrify Sectors
High-temperature industrial heat, maritime transport, and chemical processing have limited direct electrification options. These users can use biomethane as a substitute for fossil gas without replacing all existing gas assets. This makes the global biomethane market relevant to buyers seeking lower operational emissions while retaining familiar fuel systems. Shipping, steel, cement, and heavy chemicals still need scalable decarbonization routes, according to the World Economic Forum’s 2025 assessment. Food and beverage manufacturers and pharmaceutical producers are increasingly specifying renewable gas in supply contracts as their 2030 commitments approach. IEA Bioenergy documented biogas adoption across food and beverage and paper operations in Austria, Denmark, France, and Sweden, where biodegradable by-products can support co-located supply.[1]
Renewable Gas And Energy-Security Policies
European policy combines support for gas injection, transport use, and maritime decarbonization. The global biomethane market benefits where policy creates a durable demand signal instead of a short-lived capital incentive. France had 803 grid-injecting installations with 15.5 TWh of annual capacity in 2025, and its capacity was expected to reach 44 TWh by 2030 under the third multi-annual energy plan. France’s production certificates became operational in January 2026 and require gas suppliers to meet renewable-gas quotas. The European Commission reaffirmed biomethane’s role in its May 2025 REPowerEU update, supporting policy amendments in Poland, Spain, and Italy.[2] The strength of these measures will depend on national implementation, especially permitting and access to distribution networks.
Waste-To-Energy And Methane-Abatement Mandates
Waste diversion rules and agricultural methane programs convert organic residuals into more secure inputs for producers. This expands the global biomethane market by linking waste management obligations with fuel production. The American Biogas Council reported USD 2.1 billion of investment in new United States biogas systems in 2025. Investment in food waste systems more than doubled to USD 325 million, while food waste capture capacity rose 18% to 28 bcf per year. Industrial processors and retailers can reduce landfill costs while meeting internal waste targets through long-term feedstock agreements. Agricultural renewable natural gas facilities in the United States rose from 90 in 2020 to 414 at the end of 2025, supported by Renewable Fuel Standard pathways and United States Department of Agriculture programs.
Transport Fuel Credit And Certification Stacking
Multiple revenue streams can improve project economics for transport-focused biomethane plants. Renewable fuel credits, greenhouse gas quota payments, and carbon instruments are most material where certification systems are established. In the United States, 68 of 70 biogas projects commissioned in 2025 were designed to upgrade output to renewable natural gas. Those projects contributed to a 24% increase in renewable natural gas production to 225.6 million MMBtu. FuelEU Maritime and EU emissions trading requirements are also encouraging bio-LNG use in shipping. Gasum’s biomethane share of its maritime sales rose from 0.8% in 2024 to 12.3% in 2025, showing the role of compliance-based demand in the global biomethane market.
Restraints Impact Analysis of Biomethane Market*
| Restraint | (~) % Impact on CAGR Forecast | Geographic Relevance | Impact Timelin |
|---|---|---|---|
| High Upfront Capital And Feedstock Logistics Costs | -0.9% | Global, most acute in South America, Middle East and Africa, and emerging Asia-Pacific markets | Medium term (2-4 years) |
| Limited Sustainable Feedstock Accessibility | -0.7% | Asia-Pacific and Europe | Long term (≥ 4 years) |
| Grid-Injection And Interconnection Bottlenecks | -0.6% | Europe and North American rural areas | Short term (≤ 2 years) |
| Certification, Additionality, And Lifecycle-Emission Complexity | -0.5% | Global cross-border trade and mass-balance transactions | Medium term (2-4 years) |
| Source: Mordor Intelligence | |||
High Upfront Capital And Feedstock Logistics Costs
Capital costs are a material barrier where projects are small, remote, or dependent on specialized upgrading and liquefaction equipment. The global biomethane market faces a scale challenge because many agricultural feedstocks are dispersed across rural locations. France’s energy regulator reported anaerobic digestion biomethane costs of EUR 54/MWh at plants above 1,200 Nm³/h and EUR 130/MWh at smaller plants. Grid injection added EUR 5/MWh, while liquefaction added EUR 20-25/MWh for bio-LNG routes. Long transport distances can raise feedstock costs and reduce the lifecycle emissions benefit of centralized digestion. Financing is more difficult in Brazil and Vietnam, where long-term offtake structures are less established.
Limited Sustainable Feedstock Accessibility
The theoretical volume of organic waste is much larger than the commercially available and certified supply. Sustainability criteria can restrict energy crops and require stronger evidence that agricultural residues meet the additionality requirements. In the United Kingdom, the Green Gas Task Force found that policy, permitting, and grid access were more limiting than basic feedstock availability. Mandatory food waste collection reforms can still create more secure organic feedstock supply chains. Feedstock price volatility adds uncertainty for plant operators and contracted buyers. These pressures can slow capacity additions in the global biomethane market, even where physical waste volumes appear sufficient.
*Our forecasts treat driver/restraint impacts as directional, not additive. The impact forecasts reflect baseline growth, mix effects, and variable interactions.
Biomethane Market Segment Analysis
By Feedstock:
Agricultural Waste Leads While Industrial Food Waste Gains MomentumAgricultural waste held 38.4% of the global biomethane market size in 2026. Its position reflects established co-digestion systems in Germany, France, Denmark, and North America, along with the need for manure management on farms. Farmers can benefit when digesters reduce handling needs for animal waste. In the United States, dairy manure represented 87% of farm-based biogas capture capacity in December 2025. Manure-only systems have a lower energy yield per tonne than food-processing waste. Developers are therefore using co-digestion models where local conditions permit.
Industrial food waste is projected to grow at an 8.7% CAGR between 2027 and 2032. Its appeal comes from high methane yields and corporate commitments to divert organics from landfill. The United States food waste-only biogas investment rose to USD 325 million in 2025. The country had 124 standalone food waste facilities operating at 27.6 bcf per year, compared with a theoretical potential of 192 bcf per year. European collection frameworks support a more organized supply of separated organics. Municipal solid waste, household organics, and sewage sludge remain relevant sources, although their growth depends on local collection systems and wastewater infrastructure.

By Production Process:
Anaerobic Digestion Remains Established While Gasification ExpandsAnaerobic digestion held 72.3% of the global biomethane market size in 2026. The process benefits from 40 years of operating experience, established suppliers, and a large installed base in Europe and North America. The IEA reported that anaerobic digestion routes produce more than 90% of current global biomethane volumes. Operators can generally bring anaerobic digestion plants online faster than newer alternatives. Better methane-to-carbon dioxide measurement can help operators improve yields and control fugitive methane. Fermentation and other processes remain limited to specialized, co-located applications.
Thermal gasification is forecast to grow at a 9.8% CAGR from 2027 to 2032. It can use dry lignocellulosic materials and solid waste that are less suitable for anaerobic digestion. The European Biogas Association describes the route as being between demonstration and early commercial deployment. It reported that thermal gasification could help expand the use of underutilized materials as projects progress toward commercial scale. The technology could provide more flexibility in regions with abundant straw, wood residues, or solid recovered fuel. It also carries a higher execution risk because commercial experience is less mature than for digestion.
By End User:
Utilities Anchor Demand While Transportation Grows FasterUtilities commanded 34.7% of the global biomethane market size in 2026. They act as grid-injection counterparties and can aggregate supply from many small and mid-sized plants. This role gives utilities an advantage in managing gas quality, balancing, and network delivery. France’s renewable-gas certificate system creates direct demand from gas suppliers beginning in 2026. Commercial and residential users also receive biomethane through grid blending arrangements. Industrial buyers are using direct supply agreements to reduce operational emissions, while farms use biogas and biomethane in heat and machinery applications.
Transportation is projected to record a 9.2% CAGR from 2027 to 2032. Bio-CNG supports road freight, while bio-LNG can serve shipping and long-haul trucking. Renewable gas injected into European gas networks increased from 38.1 TWh in 2024 to 43.2 TWh in 2025, or 4.3 bcm, according to ENTSOG. Transport offtake represents a growing part of this activity. The global biomethane industry can benefit where fleet operators have clear fuel-credit rules and access to refueling or bunkering infrastructure. In the Asia-Pacific region, transport has become an important use case for renewable natural gas because of heavy freight and maritime demand.
Geography Analysis
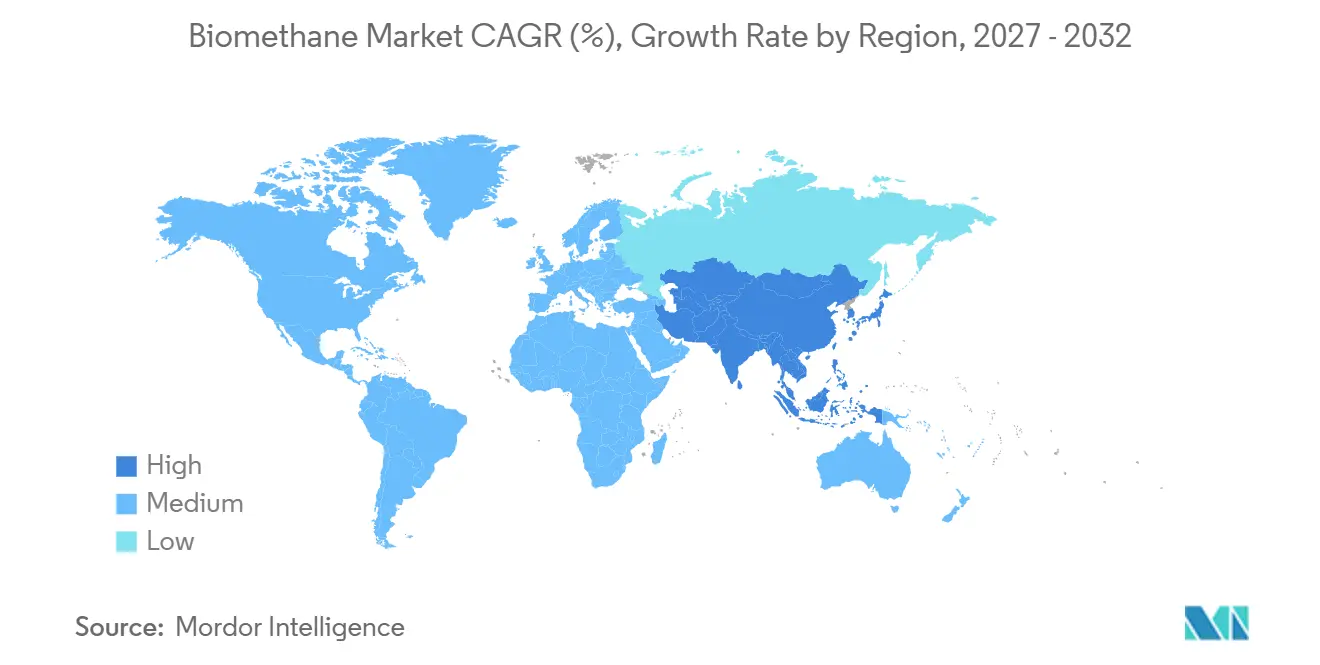
Europe held an overall 35.1% share of the global biomethane market in 2026. The region has a long history of feedstock collection, gas injection, and policy support. Germany, France, Italy, Denmark, and the Netherlands accounted for 93% of European Union biomethane production. France overtook Germany as the leading grid-injection producer in 2025. Spain has EUR 4.8 billion of allocated investment intended to add 17.3 TWh of annual capacity by 2030. Poland, Ireland, and Italy are also expanding supply, and Axpo partnered on Poland’s first agricultural plant, injecting biomethane into the national grid in September 2026. National plans still need stronger execution to meet the European Union’s 35 bcm objective.
Asia-Pacific is forecast to grow at a 9.6% CAGR through 2032. India and China have large agricultural and organic waste bases that can support new projects. India’s SATAT program targets 5,000 compressed biogas plants and a 5% CBG blending mandate by 2028-29. Japan is developing its role as a potential bio-LNG import center through companies including Osaka Gas, Tokyo Gas, and Mitsui. In 2025, Asahi Kasei commissioned a biogas purification system at the Kojima Sewage Treatment Plant with a 99.5% recovery yield and 97% methane purity. Indonesia, Vietnam, and Thailand have distinct opportunities based on palm residues and rice straw.
North America holds a significant share of global volume because of the United States Renewable Fuel Standard and California’s Low Carbon Fuel Standard. Accumulated United States biogas investment reached USD 39.9 billion in December 2025. The country had 659 facilities converting biogas to renewable natural gas, compared with 217 in 2020. Canada and Mexico have less mature infrastructure and policy frameworks. Brazil leads development in South America, with BNDES approving BRL 180.7 million for 2 landfill-gas biomethane plants in 2026. The Middle East and Africa remain early-stage areas, with waste-to-energy initiatives in Saudi Arabia, the UAE, and South Africa creating possible demand.
Competitive Landscape
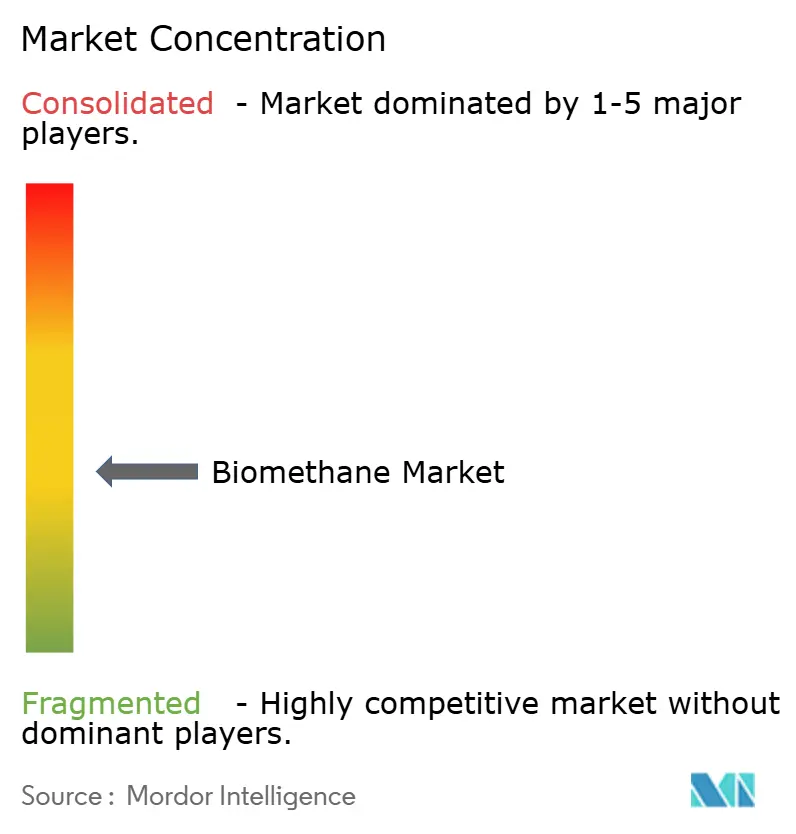
The global biomethane market is moderately fragmented and is becoming more concentrated through acquisitions, partnerships, and larger development platforms. Integrated energy companies are acquiring capacity to meet renewable-gas targets, while specialist developers continue to build plants and add adjacent assets. Shell’s ownership of Nature Energy Biogas A/S illustrates the interest of large energy companies in established production capacity. ENGIE has expanded through acquisitions in France, the United Kingdom, the Netherlands, and Belgium. These strategies give larger groups access to operating knowledge, feedstock relationships, and established offtake channels. Specialists continue to compete through technical capability and local project development.
TotalEnergies completed the sale of a 50% stake in Polska Grupa Biogazowa to HitecVision for EUR 190 million in September 2025. The 50/50 venture targets 2 TWh of equivalent biomethane capacity in Poland by 2030. ENGIE signed a 10-year Biomethane Purchase Agreement with PepsiCo UK for 60 GWh of annual supply from a GBP 70 million anaerobic digestion plant. These agreements show how industrial offtake can support financing in place of sole reliance on subsidies. Large companies are also sharing ownership with infrastructure investors to recycle capital for new projects. This can accelerate development while reducing balance-sheet exposure for individual sponsors.
Specialists such as EnviTec Biogas, Waga Energy, and Anaergia remain important in landfill gas upgrading, food-waste co-digestion, and other focused applications. Waga Energy’s WAGABOX technology is deployed in Canada, the United States, and Brazil for landfill gas upgrading. Thermal gasification presents another area where technology providers are seeking early commercial projects. The global biomethane market remains competitive because feedstock access, permitting, and local network relationships matter as much as capital scale. No combined market-share figure for the leading companies was provided, so a numeric concentration score cannot be responsibly assigned. Competition is best described as consolidating around larger platforms while remaining dispersed across regional developers and specialized technology providers.
Biomethane Industry Leaders
-
Shell plc / Nature Energy Biogas A/S
-
TotalEnergies SE
-
ENGIE
-
Gasum Ltd
-
Waga Energy
- *Disclaimer: Major Players sorted in no particular order
Biomethane Market Companies Covered in this Report
- Acorn Bioenergy
- Air Liquide
- Ameresco, Inc.
- Anaergia Inc.
- bp p.l.c.
- Chevron Corporation
- Clean Energy Fuels Corp.
- E.ON SE
- ENGIE
- EnviTec Biogas AG
- ETW Energietechnik GmbH
- Future Biogas Ltd.
- Gasum Ltd
- Kinder Morgan, Inc.
- Nature Energy Biogas A/S
- OPAL Fuels Inc.
- Raizen S.A.
- Shell plc
- SoCalGas
- Terega Solutions
- TotalEnergies SE
- Veolia Environnement S.A.
- VERBIO Vereinigte BioEnergie AG
- Waga Energy
- WELTEC BIOPOWER GmbH
Recent Industry Developments in Biomethane Market
- September 2026: Axpo partnered on Poland's first agricultural biomethane plant injecting into the national gas grid in Komorowo, marking a regulatory and commercial milestone for Poland's emerging biomethane sector.
- August 2026: TotalEnergies announced the acquisition of Shell's European renewables business and a simultaneous farm-down of a 1.2 GW renewable portfolio to KKR for EUR 1.8 billion, reinforcing TotalEnergies' integrated European bioenergy strategy.
- July 2026: European biomethane production capacity surpassed 8.2 bcm per year at the end of Q2 2026, a 17% year-on-year increase, as committed investment climbed from EUR 28 billion to EUR 36 billion, per the EBA Biomethane Investment Outlook 2026.
Global Biomethane Market Report Scope
Biomethane, also known as renewable natural gas, is a purified, near-pure methane source produced by upgrading raw biogas or through the thermal gasification and methanation of solid biomass.
The global biomethane market is segmented by feedstock, production process, end user, and geography. By feedstock, the market is segmented into agricultural waste, animal manure, municipal solid waste, organic household waste, sewage sludge, industrial food waste, and other feedstocks. By production process, the market is segmented into anaerobic digestion, thermal gasification, fermentation and other emerging processes, and production process comparison. By end user, the market is segmented into utilities, transportation, industrial, residential, commercial, agriculture, and municipalities. The report also covers the market size and forecasts for the global biomethane market across 26 countries in the key regions. For each segment, market sizing and forecasts are provided in terms of value (USD).
Segmentation Overview
| Agricultural Waste |
| Animal Manure |
| Municipal Solid Waste |
| Organic Household Waste |
| Sewage Sludge |
| Industrial Food Waste |
| Other Feedstocks |
| Anaerobic Digestion |
| Thermal Gasification |
| Fermentation and Other Emerging Processes |
| Production Process Comparison |
| Utilities |
| Transportation |
| Industrial |
| Residential |
| Commercial |
| Agriculture |
| Municipalities |
| North America | United States |
| Canada | |
| Mexico | |
| Europe | Germany |
| France | |
| Italy | |
| Spain | |
| United Kingdom | |
| Poland | |
| Russia | |
| Rest of Europe | |
| Asia-Pacific | China |
| India | |
| Japan | |
| South Korea | |
| Australia | |
| Indonesia | |
| Vietnam | |
| Thailand | |
| Rest of Asia-Pacific | |
| South America | Brazil |
| Argentina | |
| Chile | |
| Rest of South America | |
| Middle East and Africa | Saudi Arabia |
| United Arab Emirates | |
| Egypt | |
| South Africa | |
| Morocco | |
| Rest of Middle East and Africa |
| By Feedstock | Agricultural Waste | |
| Animal Manure | ||
| Municipal Solid Waste | ||
| Organic Household Waste | ||
| Sewage Sludge | ||
| Industrial Food Waste | ||
| Other Feedstocks | ||
| By Production Process | Anaerobic Digestion | |
| Thermal Gasification | ||
| Fermentation and Other Emerging Processes | ||
| Production Process Comparison | ||
| By End User | Utilities | |
| Transportation | ||
| Industrial | ||
| Residential | ||
| Commercial | ||
| Agriculture | ||
| Municipalities | ||
| By Geography | North America | United States |
| Canada | ||
| Mexico | ||
| Europe | Germany | |
| France | ||
| Italy | ||
| Spain | ||
| United Kingdom | ||
| Poland | ||
| Russia | ||
| Rest of Europe | ||
| Asia-Pacific | China | |
| India | ||
| Japan | ||
| South Korea | ||
| Australia | ||
| Indonesia | ||
| Vietnam | ||
| Thailand | ||
| Rest of Asia-Pacific | ||
| South America | Brazil | |
| Argentina | ||
| Chile | ||
| Rest of South America | ||
| Middle East and Africa | Saudi Arabia | |
| United Arab Emirates | ||
| Egypt | ||
| South Africa | ||
| Morocco | ||
| Rest of Middle East and Africa | ||
Key Questions Answered in the Report
What is the forecast growth rate for biomethane through 2032?
The Biomethane Market size is expected to grow from USD 16.79 billion in 2026 to USD 18.18 billion in 2027 and is forecast to reach USD 27.10 billion by 2032 at 8.30% CAGR over 2027-2032.
Which feedstock has the largest role in biomethane production?
Agricultural waste led with 38.4% share in 2026, supported by established manure management and co-digestion systems.
Which production method is most widely used for biomethane?
Anaerobic digestion held 72.3% share in 2026 and remains the most established route for current production.
Why are transport companies adopting biomethane?
Transportation is forecast to grow at a 9.2% CAGR through 2032 because bio-CNG and bio-LNG can support freight and maritime operations.
Which region has the strongest current biomethane position?
Europe held 35.1% share in 2026, supported by grid injection infrastructure, feedstock systems, and policy support.
What limits new biomethane project development?
High capital needs, feedstock logistics, grid connection delays, and certification complexity can slow project delivery.